Entry
Reader's guide
Entries A-Z
Subject index
Gini Index
THE GINI INDEX IS a summary measure of income inequality that was developed by the Italian statistician and demographer Corrado Gini (1884–1965). It is an application of his theory of dispersion in a concentration and is best illustrated using the so-called Lorenz curve, named after the American economist Max Lorenz (1880–1962). It is used to illustrate the size distribution of income. A hypothetical Lorenz curve is presented below.
In the figure, Y represents the cumulative percentage of income and X the cumulative percentage of households, and therefore the horizontal and vertical axes add up to 100 percent. The diagonal (45-degree line) in the box represents a perfectly equal distribution of income, each quintile (that is, each 20 percent) of households receiving exactly 20 percent of total income. The Lorenz curve under the diagonal represents an actual distribution of income and tells the extent of income inequality. Low-income households (toward the origin on the X-axis) have a relatively low share in total income, whereas high-income households, for instance in the top quintile, have a higher share in total income. The more bowed out (convex) the Lorenz curve, the higher the income inequality.
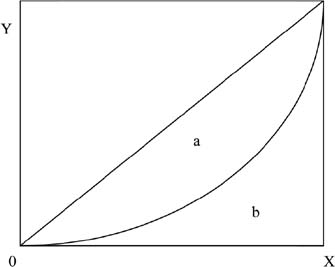
The Gini Index (G) is a summary of statistics of the extent of income inequality. It is calculated simply as the area under the diagonal and above the Lorenz curve (area a) divided by the entire area under the Lorenz diagonal (area a+b):

The Gini Index is equal to 0 when income distribution is perfectly equal and 1 when income distribution is perfectly unequal. Intercountry and, over time, intra-country comparisons of the Gini coefficient are often made, even though such comparisons have statistical measurement limits and depend on the accuracy of the data. For instance, according to the U.S. Census Bureau, income inequality in the United States increased steadily from 1970 to 2000. The Gini Index in 1970 was .394 and increased to .403 by 1980, to .428 by 1990, and to .462 by 2000.
High income inequality is one of the main causes of overall poverty. The disparity in income shares indicates that low-income groups receive a disproportionately low share in total income, are unable to meet their basic needs, and hence are poverty-stricken. It is, therefore, not surprising to note that countries with a high Gini Index are also countries with high poverty rates. According to the United Nations Development Program (UNDP), Botswana, the Central African Republic, Lesotho, Sierra Leone, and Swaziland are among the countries with the highest income inequality. Not surprisingly they are also the countries with the lowest rankings in terms of Human Development (HDI, available for 177 countries) and Human Poverty (HPI-1, available for 103 countries) Indexes. A sampling includes:
| Country | Gini Index | HDI | HPI-1 |
| Botswana | .630 | 131 | 94 |
| Central African | |||
| Republic | .613 | 171 | 92 |
| Lesotho | .632 | 149 | 91 |
| Sierra Leone | .629 | 176 | 98 |
| Swaziland | .609 | 147 | 97 |
Perhaps a strategy to fight poverty should start with measures aimed at reducing income inequality.
- Antipoverty Organizations
- African Development Foundation
- American Friends Service Committee
- Anti-Defamation League
- Better Safer World
- Big Brothers Big Sisters
- Campus Compact
- CARE
- Center for Democratic Renewal
- Center for the Study of Urban Poverty
- Center on Budget and Policies Priorities
- Center on Hunger and Poverty
- Charity Organization Society
- Comic Relief
- Cuernavaca Center
- Development Gateway
- Employment Policies Institute
- Engineers Without Borders
- Feinstein Foundation
- Food First
- Food for the Hungry
- Food Research and Action Center
- Foods Resource Bank
- Habitat for Humanity
- Haig Fund
- Hull House
- Institute for Research on Poverty
- Institute for the Study of Homelessness and Poverty
- Institute on Race and Poverty
- International Food Policy Research Institute
- International Labor Organization
- International Monetary Fund
- International Nongovernmental Organizations
- Lawyers Without Borders
- Médecins Sans Frontières
- National Alliance to End Homelessness
- National Association for the Advancement of Colored People
- National Coalition for the Homeless
- National Coalition of Barrios Unidos
- National Coalition on Health Care
- National Conference for Community and Justice
- National Low-Income Housing Coalition
- National Poverty Center
- New Partnership for Africa's Development
- Nongovernmental Organizations
- Salvation Army
- Second Harvest
- Students Against Sweatshops
- UNICEF
- United For a Fair Economy
- World Bank
- World Health Organization
- World Trade Organization
- Children and Poverty
- CDF Black Community Crusade for Children
- Child Malnutrition
- Child Mortality
- Child Welfare League of America
- ChildLine
- Children and Poverty
- Children's Aid Society
- Children's Defense Fund
- Children's Hunger Relief
- Church of England
- Education
- National Association for the Education of Young Children
- National Education Association
- National Fatherhood Initiative
- Nutrition
- Street Children
- Causes of Poverty
- Countries: Africa
- Algeria
- Angola
- Benin
- Botswana
- Brunei Darussalam
- Burkina Faso
- Burundi
- Côte d'Ivoire
- Cameroon
- Cape Verde
- Central African Republic
- Chad
- Comoros
- Congo
- Congo, Democratic Republic
- Djibouti
- Egypt
- Equatorial Guinea
- Eritrea
- Ethiopia
- Gabon
- Gambia
- Ghana
- Guinea
- Guinea-Bissau
- Kenya
- Lesotho
- Liberia
- Libya
- Madagascar
- Malawi
- Mali
- Mauritania
- Mauritius
- Morocco
- Mozambique
- Namibia
- Niger
- Nigeria
- Rwanda
- São Tomé and Principe
- Senegal
- Sierra Leone
- Somalia
- South Africa
- Sudan
- Swaziland
- Tanzania
- Togo
- Tunisia
- Uganda
- Zambia
- Zimbabwe
- Countries: Americas
- Antigua and Barbuda
- Argentina
- Bahamas
- Barbados
- Belize
- Bolivia
- Brazil
- Canada
- Chile
- Colombia
- Costa Rica
- Cuba
- Dominica
- Dominican Republic
- Ecuador
- El Salvador
- Grenada
- Guatemala
- Guyana
- Haiti
- Honduras
- Jamaica
- Mexico
- Nicaragua
- Panama
- Paraguay
- Peru
- Saint Kitts and Nevis
- Saint Lucia
- Saint Vincent and the Grenadines
- Suriname
- Trinidad and Tobago
- United States
- Uruguay
- Venezuela
- Countries: Asia
- Afghanistan
- Azerbaijan
- Bahrain
- Bangladesh
- Bhutan
- Cambodia
- China
- East Timor
- Georgia
- India
- Indonesia
- Iran
- Iraq
- Israel
- Japan
- Jordan
- Kazakhstan
- Korea, North
- Korea, South
- Kuwait
- Kyrgyzstan
- Laos
- Lebanon
- Malaysia
- Maldives
- Moldova
- Mongolia
- Myanmar
- Nepal
- Oman
- Pakistan
- Palestine
- Philippines
- Qatar
- Russia
- Saudi Arabia
- Seychelles
- Singapore
- Sri Lanka
- Syria
- Tajikistan
- Thailand
- Turkey
- Turkmenistan
- Ukraine
- United Arab Emirates
- Uzbekistan
- Vietnam
- Yemen
- Countries: Europe
- Albania
- Andorra
- Armenia
- Austria
- Belarus
- Belgium
- Bosnia and Herzegovina
- Bulgaria
- Croatia
- Cyprus
- Czech Republic
- Denmark
- Estonia
- Finland
- France
- Germany
- Greece
- Hungary
- Iceland
- Ireland
- Italy
- Latvia
- Liechtenstein
- Lithuania
- Luxembourg
- Macedonia (FYROM)
- Malta
- Monaco
- Netherlands
- Norway
- Poland
- Portugal
- Romania
- San Marino
- Serbia and Montenegro
- Slovakia
- Slovenia
- Spain
- Sweden
- Switzerland
- United Kingdom
- Countries: Pacific
- Economics of Poverty
- Agriculture
- Agriculture-Nutrition Advantage
- Area Deprivation
- Bankruptcy
- Basic Income
- Basic Needs
- Basic Security
- Capitalism
- Civil Society
- Class Analysis of Poverty
- Class Structure
- Communism
- Cost of Living
- Credit
- Debt
- Debt Relief
- Debt Swap
- Dependency School
- Deprivation
- Destitution
- Disability Insurance
- Distribution
- Drought
- Economic Distance
- Economic Growth
- Employment
- Employment Theory
- Environmental Degradation
- Equity and Efficiency Trade-Off
- Equivalence Scales
- Family Budgets
- Famine
- Financial Markets
- Fiscal Policy
- Food Shortages
- Foreign Direct Investment
- Free Trade Agreement of Americas
- Fuel Poverty
- Globalization
- Household Consumption
- Household Employment
- Household Income
- Human Capital
- Human Development
- Income
- Income Distribution Theories
- Income Inequality
- Income Poverty
- Inflation
- International Trade
- Intrahousehold Transfers
- Labor Market
- Laissez-Faire
- Lumpenproletariat
- Macroeconomic Policies
- Macroeconomics
- Market Efficiency
- Microeconomics
- Monetary Policy
- Myrdal's Theory of Cumulative Causation
- Needs
- Neoclassical Thought
- Nonincome Poverty
- North American Free Trade Agreement
- OECD Countries
- Outsourcing/Offshoring
- Pension Programs
- Physiocrats
- Planning
- Poverty Trap
- Primary Poverty
- Privatization
- Public Goods
- Public Policy
- Recession
- Redistribution
- Relative Deprivation
- Rural Deprivation
- Scarcity
- Social Democracy
- Socialism
- Stabilization
- Structural Dependency
- Structuralist School
- Supply-Side Economics
- Wage Slavery
- Wages
- War and Poverty
- Water
- Welfare State
- Effects of Poverty
- Crime
- Deprivation
- Destitution
- Disease
- Economic Distance
- Economic Insecurity
- Environmental Degradation
- Exclusion
- Exploitation
- Family Desertion
- HIV/AIDS
- Homelessness
- Malnutrition
- Nonworking Poor
- Rural Deprivation
- Social Disqualification
- Social Exclusion
- Social Inequality
- Social Insecurity
- Starvation
- Stigmatization
- Structural Dependency
- Underclass
- Vulnerability
- Welfare Dependence
- History of Poverty
- Adams, John (Administration)
- Adams, John Quincy (Administration)
- Almshouses
- Ancient Thought
- Apartheid
- Arthur, Chester (Administration)
- Buchanan, James (Administration)
- Bush, George H.W. (Administration)
- Bush, George W. (Administration)
- Carter, James (Administration)
- Cleveland, Grover (Administration)
- Clinton, William (Administration)
- Cold War
- Colonialism
- Coolidge, Calvin (Administration)
- Depression, Great
- Eisenhower, Dwight (Administration)
- Fabian Society
- Feudalism
- Fillmore, Millard (Administration)
- Ford, Gerald (Administration)
- French Revolution
- Garfield, James (Administration)
- Grant, Ulysses (Administration)
- Harding, Warren (Administration)
- Harrison, Benjamin (Administration)
- Harrison, William (Administration)
- Hayes, Rutherford (Administration)
- Hoover, Herbert (Administration)
- Imperialism
- Industrial Revolution
- Industrialization
- Irish Famine
- Jackson, Andrew (Administration)
- Jefferson, Thomas (Administration)
- Johnson, Andrew (Administration)
- Johnson, Lyndon (Administration)
- Kennedy, John F. (Administration)
- Les Misérables
- Lincoln, Abraham (Administration)
- Madison, James (Administration)
- McKinley, William (Administration)
- Medieval Thought
- Mercantilism
- Monroe, James (Administration)
- Nixon, Richard (Administration)
- Pierce, Franklin (Administration)
- Polk, James (Administration)
- Poor Laws
- Reagan, Ronald (Administration)
- Roosevelt, Franklin (Administration)
- Roosevelt, Theodore (Administration)
- Taft, William Howard (Administration)
- Taylor, Zachary (Administration)
- Truman, Harry (Administration)
- Tyler, John (Administration)
- Utopian Socialists
- Van Buren, Martin (Administration)
- War on Poverty
- Washington, George (Administration)
- Wilson, Woodrow (Administration)
- World War I
- World War II
- Measurements and Definitions of Poverty
- Absolute-Income-Based Measures of Poverty
- Arab Definition of Poverty
- Australian Definition of Poverty
- Axiom of Monotonicity and Axiom of Transfers
- Beveridge Scheme
- Brazilian Definition of Poverty
- Bureau of Labor Statistics
- Capability Measure of Poverty
- Chinese Definition of Poverty
- Comparative Research Program on Poverty
- Consumption-Based Measures of Poverty
- Contextual Poverty
- Cost-of-Living-Based Measures of Poverty
- Cyclical Poverty
- Decomposable Poverty Measures
- Definitions of Poverty
- Demographics
- Dependency Ratio
- Deprivation Index
- Direct and Indirect Measures of Poverty
- Duration of Poverty
- Economic Definitions of Poverty
- Economic Insufficiency
- Endemic Poverty
- Engel Coefficient
- European Relative-Income Standard of Poverty
- European Union Definition of Poverty
- Extended Poverty Minimum
- Extreme Poverty
- Food-Ratio Poverty Line
- Foster, Greer, and Thorbecke Index
- Gini Coefficient
- Headcount Index
- Human Poverty Index
- Indicators of Poverty
- Joint Center for Poverty Research
- Living-Standards Measurement Study
- Luxembourg Employment Study
- Luxembourg Income Study
- Mapping Poverty
- Means-Testing
- National Research Council
- Normative Standards
- Overall Poverty
- Peripheral Poverty
- Permanent (Collective) Poverty
- Poverty Assessment
- Poverty Clock
- Poverty Gap
- Poverty Gap Index
- Poverty Rate
- Poverty Research
- Poverty Threshold
- Relative Welfare Index
- Relative-Income-Based Measures of Poverty
- Rural Poverty Research Center
- Scientific Definitions of Poverty
- Secondary Poverty
- Sen Index
- Sen-Shorrocks-Thon Index
- Speenhamland System
- Squared Poverty Gap Index
- Standard Food Basket
- Standard Food Basket Variant
- Standard of Living
- Subjective Measures of Poverty
- TIP Curves
- Totally Fuzzy and Relative (TFR) Poverty Measures
- Traumatic Poverty
- UBN-PL Method
- Ultimate Poverty
- University of Kentucky Center for Poverty Research
- USDA Poverty Line
- Voluntary Poverty
- Working Poor
- World Bank Poverty Lines
- People
- Aquinas, Thomas
- Bellamy, Edward
- Black, Hugo L.
- Brandeis, Louis D.
- Bryan, William Jennings
- Calvin, John
- Carnegie, Andrew
- Coughlin, Charles
- de Soto, Hernando
- Donnelly, Ignatius
- Engels, Friedrich
- Evans, George Henry
- Foucault, Michel
- Francis of Assisi
- Frank, Andre Gunder
- Franklin, Benjamin
- Friedman, Milton
- Galbraith, John Kenneth
- Gandhi, Mahatma
- George, Henry
- Giddens, Anthony
- Gilder, George
- Greeley, Horace
- Harrington, Michael
- Heilbronner, Robert
- Hobbes, Thomas
- Hobson, John
- Lewis, Arthur
- Locke, John
- Luxemburg, Rosa
- Malthus, Thomas
- Marshall, Alfred
- Marx, Karl
- Mill, John Stuart
- Mother Teresa
- Owen, Robert
- Polanyi, Karl
- Prebisch, Raul
- Rawls, John
- Ricardo, David
- Sen, Amartya
- Smith, Adam
- Thompson, T. Phillips
- Wallerstein, Immanuel
- Weber, Max
- Politics and Poverty
- Poverty Relief Initiatives
- Access-to-Enterprise Zones
- Adjustment Programs
- Aid to Families with Dependent Children
- Asset-Based Antipoverty Programs
- Congressional Hunger Center
- Earned-Income Tax Credit
- Economic Growth and Poverty Reduction Strategy
- Federal Targeted Training
- Food Stamps
- G-8 Africa Action Plan
- Great Society Programs
- Guaranteed Assistance
- Head Start
- Heifer Project
- Help the Aged
- Housing Assistance
- Inter-American Development Bank
- International Development Cooperation Forum
- Libyan Arab Jamahiriya
- Living Wage Campaign
- Low-Income Cut-Offs
- Means-Tested Government Antipoverty Programs
- Medicaid
- Medicare
- Microcredit
- Millennium Development Goals
- Minimum Wage
- Pro-Poor Growth
- Rationing
- Regulation
- Rural Antipoverty Programs
- Social Assistance
- Supplemental Security Income
- Temporary Assistance for Needy Families
- UNDP Regional Project for Overcoming Poverty
- Unemployment Insurance
- United Nations Development Program
- Urban Antipoverty Programs
- Wealth Tax
- Work-Welfare Programs
- Workers' Compensation
- Workfare
- Religious and Secular Charities
- Africa Faith and Justice Network
- Brotherhood of St. Laurence
- Catholic Campaign for Human Development
- Christian Antipoverty Campaigns
- Christian Community Health Fellowship
- Christmas Seals
- Church World Services
- Community-Based Antipoverty Programs
- Damascus Road
- Easter Seals
- Evangelicals for Social Action
- Faith-Based Antipoverty Programs
- Franciscan Order
- Goodwill Industries
- International Red Cross and Red Crescent Societies
- Jesuits
- Jubilee 2000
- Judaism and Poverty
- Living Waters for the World
- March of Dimes
- Mendicant Orders
- Milwaukee New Hope Program
- Missionaries
- National Interfaith Committee for Worker Justice
- OXFAM
- Partnership to Cut Hunger in Africa
- Polish Humanitarian Organization
- Presbyterian Hunger Project
- Protestant Churches
- Rebuilding Together
- Roy Wilkins Center
- Samaritans
- Save the Children
- Share Our Strength
- Society of St. Vincent de Paul
- United Methodist Church Initiatives
- United Methodist Committee on Relief
- United Way
- World Concern
- World Food Program
- YMCA and YWCA
- Women and Poverty
- Loading...
Get a 30 day FREE TRIAL
-
 Watch videos from a variety of sources bringing classroom topics to life
 -
Read modern, diverse business cases
-
Explore hundreds of books and reference titles

Read next

More like this
Sage Recommends
We found other relevant content for you on other Sage platforms.
Have you created a personal profile? Login or create a profile so that you can save clips, playlists and searches