
Entry
Reader's guide
Entries A-Z
Subject index
Semi-Interquartile Range
The semi-interquartile range (semi-IQR) is a numerical measure of the spread of a quantitative data distribution. Quantitative data, as opposed to categorical variables, comprise numerical values for which arithmetic operations (e.g., adding, dividing) can be reasonably conducted. Data analysis begins by examining data with graphics and numerical summaries. A quantitative data distribution is typically summarized by its center (e.g., mean or median) and its spread (e.g., standard deviation, IQR, semi-IQR). The center quantifies the average or middle value of the data distribution, and the spread communicates the variability or range in the data.
Numerical summaries of a data distribution are derived from two types of underlying distributions: parametric and nonparametric. Parametric distributions are probability distributions with known functional forms that accompany a fixed set of parameters (e.g., the uniform distribution of a variable , for , has two parameters: and In contrast, nonparametric distributions do not follow any known function (i.e., is unknown). The center and spread of data from parametric distributions are quantified by the mean and standard deviation (e.g., for the uniform distribution, the mean is and the variance is ). Alternatively, the center and spread of data from nonparametric distributions are typically quantified by the median, IQR, and semi-IQR. Unlike parametric measures, nonparametric measures of center and spread make no assumptions of the form of the distribution underlying the data.
Center and Spread
Suppose we have the following math achievement scores on nine students, arranged from smallest to largest: 67, 79, 80, 83, 87, 90, 90, 95, 98. These data are presented as a histogram overlaid with a normal distribution in Figure 1.
Parametric Numerical Summaries
If the data are assumed to follow the parametric normal distribution, the center is estimated by the average value or mean, (solid vertical line in Figure 1A), and the spread is quantified by the standard deviation, . The values of and are sample estimates of the population parameters of the normal distribution, where μ is the population mean and σ is the population standard deviation. If the data are normally distributed, then 68% of the data will lie within or [76.0, 94.9], 95% of the data will lie within or [66.6, 104.3], and 99.7% of the data will lie within or [57.1, 113.7] (Figure 1A). The observed range is calculated by taking the difference between the minimum and maximum score, Observe that the minimum and maximum values of the intervals bounded by and exceeds the observed values in the data, [67, 98], suggesting that the mean and standard deviation may not be the best numerical summaries for these data. Numerical summaries based on parametric distributions are also sensitive to observations that are inconsistent with the assumed distribution. Stated differently, and are not robust to the presence of outliers.
Figure 1 Histogram of Math Achievement Scores
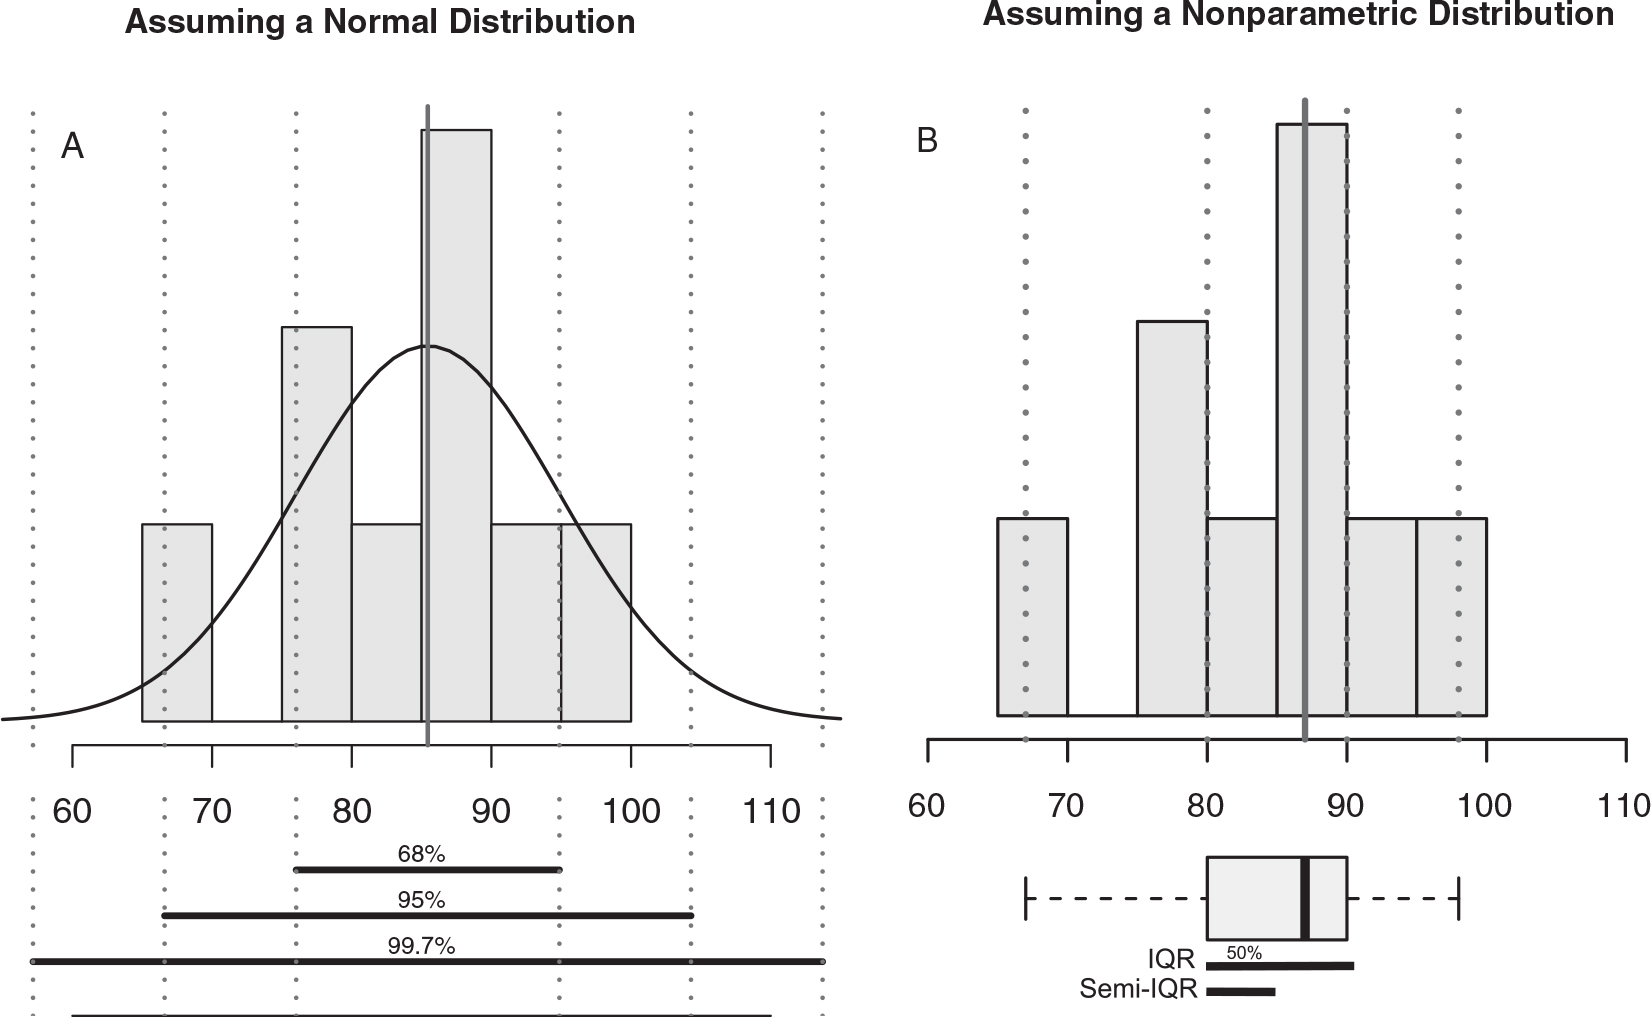
Note: (A) Assuming a normal distribution, the mean is represented by the solid vertical line, and a standard deviation is represented by the width between two vertical reference lines. (B) Assuming a nonparametric distribution, the median is represented by the solid vertical line, and the other quartiles are represented by the dotted vertical lines. The IQR is represented by the longer horizontal line, spanning 50% of the distribution or the length of the box-and-whisker plot. The semi-IQR is represented by the shorter horizontal line, spanning 25% of the distribution or a half-width of the box-and-whisker plot.
...
- Bayesian Statistics
- Descriptive Statistics
- Central Tendency, Measures of
- Cohen’s d Statistic
- Cohen’s f Statistic
- Correspondence Analysis
- Descriptive Statistics
- Effect Size, Measures of
- Eta-Squared
- Factor Loadings
- Mean
- Median
- Mode
- Partial Eta-Squared
- Range
- Relative Measures of Dispersion
- Standard Deviation
- Statistic
- Trimmed Mean
- Variability, Measure of
- Variance
- Distributions
- z Distribution
- Bernoulli Distribution
- Beta Distribution
- Binomial Distribution
- Copula Functions
- Cumulative Frequency Distribution
- Distribution
- Frequency Distribution
- Kurtosis
- Law of Large Numbers
- Negative Hypergeometric Distribution
- Normal Distribution
- Normalizing Data
- Poisson Distribution
- Quetelet’s Index
- Sampling Distributions
- Weibull Distribution
- Winsorize
- Graphical Displays of Data
- Bar Chart
- Box-and-Whisker Plot
- Column Graph
- Data Visualization
- Exponential Random Graph Models
- Forest Plot
- Frequency Table
- Funnel Plot
- Graph Theory
- Graphical Display of Data
- Growth Curve
- Histogram
- L’Abbé Plot
- Line Graph
- Nomograms
- Ogive
- Pie Chart
- Radial Plot
- Residual Plot
- Scatterplot
- Spaghetti Plot
- U-Shaped Curve
- Visual Analysis
- Visual Display of Quantitative Information
- Hypothesis Testing
- p Value
- Alternative Hypotheses
- Beta
- Critical Value
- Decision Rule
- Equivalence Hypothesis Testing
- Hypothesis
- Nondirectional Hypotheses
- Nonsignificance
- Null Hypothesis
- One-Tailed Test
- Power
- Power Analysis
- Significance Level, Concept of
- Significance Level, Interpretation and Construction
- Significance, Statistical
- Two-Tailed Test
- Type I Error
- Type II Error
- Type III Error
- Important Publications
- “Coefficient Alpha and the Internal Structure of Tests”
- “Convergent and Discriminant Validation by the Multitrait–Multimethod Matrix”
- “Meta-Analysis of Psychotherapy Outcome Studies”
- “On the Theory of Scales of Measurement”
- “Probable Error of a Mean, The”
- “Psychometric Experiments”
- “Sequential Tests of Statistical Hypotheses”
- “Structural Holes: The Social Structure of Competition”
- “Technique for the Measurement of Attitudes, A”
- “Validity”
- Aptitudes and Instructional Methods
- Doctrine of Chances, The
- Logic of Scientific Discovery, The
- Nonparametric Statistics for the Behavioral Sciences
- Probabilistic Models for Some Intelligence and Attainment Tests
- Social Network Analysis Methodsand Applications
- Statistical Power Analysis for the Behavioral Sciences
- Strength of Weak Ties
- Structural Equivalence of Individuals in Social Networks
- Teoria Statistica Delle Classi e Calcolo Delle Probabilità
- Inferential Statistics
- Association, Measures of
- Coefficient of Concordance
- Coefficient of Variation
- Coefficients of Alienation and Determination
- Confidence Intervals
- Correlation Coefficient
- Margin of Error
- Nonparametric Statistics
- Odds Ratio
- Parameters
- Parametric Statistics
- Partial Correlation
- Pearson Product-Moment Correlation Coefficient
- Polychoric Correlation Coefficient
- Q-Statistic
- R2
- Randomization Tests
- Regression Coefficient
- Semipartial Correlation Coefficient
- Spearman Rank Order Correlation
- Standard Error of Estimate
- Standard Error of the Mean
- Student’s t Test
- Unbiased Estimator
- Weights
- Item Response Theory
- Mathematical Concepts
- Measurement Concepts
- z Score
- Categorizing Continuous Data
- Ceiling Effect
- Cut Scores
- False Positive
- Gain Scores, Analysis of
- Instrumentation
- Interval Recording
- Ipsative Data
- Item Analysis
- Item–Test Correlation
- Measurement Invariance
- Observations
- Partial Measurement Invariance
- Percentile Rank
- Psychometrics
- Random Error
- Raw Scores
- Response Bias
- Rubrics
- Sensitivity
- Social Desirability
- Sociograms
- Sociometric Tests
- Specificity
- Standardized Score
- Survey
- Tau Equivalence
- Test
- Then-Test
- True Positive
- Organizations
- Publishing
- Qualitative Research
- Case Study
- Content Analysis
- Conversation Analysis
- Critical Case
- Discourse Analysis
- Ethnography
- Field Notes
- Focus Group
- Instrumental Case Study
- Interval Recording
- Interviewing
- Member Checks
- Memos
- Multiple Case Study
- Narrative Research
- Naturalistic Inquiry
- Naturalistic Observation
- Qualitative Research
- Saturation
- Semi-Structured Interview
- Think-Aloud Methods
- Reliability of Scores
- Correction for Attenuation
- Cronbach’s Alpha
- Internal Consistency Reliability
- Interrater Reliability
- KR-20
- Krippendorff’s Alpha
- McDonald’s Omega Hierarchical
- Parallel Forms Reliability
- Reliability
- Spearman–Brown Prophecy Formula
- Split-Half Reliability
- Standard Error of Measurement
- Test–Retest Reliability
- True Score
- Research Design Concepts
- Aptitude–Treatment Interaction
- Cause and Effect
- Concomitant Variable
- Confounding
- Control Group
- Good Clinical Research Practice
- Interaction
- Internet-Based Research Methods
- Intervention
- Matching
- Mortality
- Multiple Case Study
- Natural Experiments
- Network Analysis
- Peer Effects
- Placebo
- Reciprocity
- Replication
- Research
- Research Design Principles
- Treatment(s)
- Triangulation
- Unit of Analysis
- Yoked Control Procedure
- Research Designs
- A Priori Monte Carlo Simulation
- Action Research
- Adaptive Designs in Clinical Trials
- Alternating Treatments Design
- Applied Research
- Balanced Incomplete Block Design
- Basket Trials Design
- Behavior Analysis Design
- Block Design
- Blockmodeling
- Case-Only Design
- Causal-Comparative Design
- Changing Criterion Design
- Cohort Design
- Completely Randomized Design
- Confirmatory Research
- Cross-Sectional Design
- Crossover Design
- Double-Blind Procedure
- Evaluation Research Design
- Ex Post Facto Study
- Experimental Design
- Exploratory Research
- Factorial Design
- Field Study
- Group-Sequential Designs in Clinical Trials
- Laboratory Experiments
- Latin Square Design
- Longitudinal Design
- Meta-Analysis
- Mixed Methods Design
- Mixed Model Design
- Mixture Models
- Monte Carlo Simulation
- Multiple Baseline Single Case Experimental Design
- Nested Factor Design
- Nonexperimental Designs
- Observational Research
- Panel Design
- Partially Randomized Preference Trial Design
- Pilot Study
- Pragmatic Study
- Pre-Experimental Designs
- Pretest–Posttest Design
- Propensity Score Matching
- Prospective Study
- Quadratic Assignment Procedure
- Quantitative Research
- Quasi-Experimental Design
- Randomized Block Design
- Repeated Measures Design
- Response Surface Design
- Retrospective Study
- Sequential Design
- Single-Blind Study
- Single-Case Research Design
- Split-Plot Factorial Design
- Stepped-Wedge Design
- Stepwise Model Selection
- Thought Experiments
- Time-Lag Study
- Time-Series Study
- Triple-Blind Study
- True Experimental Design
- Umbrella Trials Design
- Wennberg Design
- Within-Subjects Design
- Zelen’s Randomized Consent Design
- Research Ethics
- Adverse Event Reporting
- Animal Research
- Anonymity
- Assent
- Belmont Report
- Beneficence
- Confidentiality
- Cultural Competence
- Data and Safety Monitoring
- Debriefing
- Deception
- Declaration of Helsinki
- Ethics in the Research Process
- Informed Consent
- Justice and Social Science Research
- Multisite Research Studies
- Nuremberg Code
- Participants
- Recruitment
- Respect for Persons
- Risk in Human Subjects Research
- Transparency
- Research Process
- Biological and Technical Replicates
- Clinical Significance
- Clinical Trial
- Cognitive Laboratory
- Cross-Validation
- Data Cleaning
- Data Mining
- Data Snooping
- Delphi Technique
- Evidence-Based Decision Making
- Exploratory Data Analysis
- Follow-Up
- Inference: Deductive and Inductive
- Last Observation Carried Forward
- Masking
- Multisite Research Studies
- Operationalizing
- Primary Data Source
- Protocol
- Q Methodology
- Research Hypothesis
- Research Question
- Scientific Method
- Secondary Data Source
- SPIRIT 2013 Statement
- Standardization
- Statistical Control
- Type III Error
- Wave
- Research Validity Issues
- Bias
- Critical Thinking
- Ecological Validity
- Experimenter Expectancy Effect
- External Validity
- File Drawer Problem
- Hawthorne Effect
- Heisenberg Effect
- Instrumentation as a Threat to Internal Validity
- Internal Validity
- John Henry Effect
- Multiple Treatment Interference
- Multivalued Treatment Effects
- Nonclassical Experimenter Effects
- Order Effects
- Placebo Effect
- Pretest Sensitization
- Random Assignment
- Reactive Arrangements
- Regression to the Mean
- Selection Bias
- Sequence Effects
- Threats to Validity
- Validity of Research Conclusions
- Volunteer Bias
- White Noise
- Sampling
- Cluster Sampling
- Comparison-Focused Sampling
- Convenience Sampling
- Demographics
- Error
- Exclusion Criteria
- Experience Sampling Method
- Gibbs Sampler
- Nested Sampling
- Network Sampling
- Nonprobability Sampling
- Population
- Probability Sampling
- Proportional Sampling
- Quota Sampling
- Random Sampling
- Random Selection
- Sample
- Sample Size
- Sample Size Planning
- Sampling
- Sampling Error
- Sequential Sampling
- Stratified Sampling
- Survey Sampling
- Systematic Sampling
- Theoretical Sampling
- Underrepresented Groups
- Scaling
- Social Network Analysis
- Alters
- Connectivity
- Core-Periphery Structure
- Ego-Centric Networks
- International Network for Social Network Analysis
- Name Generator
- Network Boundaries
- Network Composition
- Network Density
- Network Distance
- Network Matrices
- Network Meta-Analysis
- Network Sampling
- Network Size
- Network Structure
- Network Visualization
- Node, Relationship, and Network Attributes
- Nodes and Relationships
- One-Mode Data
- Social Network Analysis
- Sociograms
- Structural Holes
- Two-Mode Data
- Whole Networks
- Software Applications
- Statistical Assumptions
- Statistical Concepts
- Akaike Information Criterion
- Autocorrelation
- Biased Estimator
- Centrality
- Cohen’s Kappa
- Collinearity
- Correlation
- Criterion Problem
- Critical Difference
- Data Mining
- Data Snooping
- Degrees of Freedom
- Directional Hypothesis
- Disturbance Terms
- Error Rates
- Expected Value
- Factorial Invariance
- Fixed-Effects Model
- Hedges’ g
- Heterogeneity
- Inclusion Criteria
- Influence Statistics
- Influential Data Points
- Intraclass Correlation
- Latent Change Score
- Latent Variable
- Likelihood Principle
- Likelihood Ratio Statistic
- Loglinear Models
- Machine Learning
- Main Effects
- Markov Chains
- McDonald’s Omega Hierarchical
- Method Variance
- Mixed- and Random-Effects Models
- Multilevel Modeling
- Multiplicity Problem
- Neural Networks
- Nuisance Parameters
- Odds
- Omega Squared
- Orthogonal Comparisons
- Outlier
- Overfitting
- Partial Factorial Invariance
- Pooled Variance
- Precision
- Quality Effects Model
- Random-Effects Models
- Regression Artifacts
- Regression Discontinuity
- Residuals
- Restriction of Range
- Robust
- Robust Maximum Likelihood
- Root Mean Square Error
- Rosenthal Effect
- Semi-Interquartile Range
- Serial Correlation
- Shrinkage
- Simple Main Effects
- Simpson’s Paradox
- Stochastic Processes
- Sums of Squares
- Statistical Procedures
- F Test
- t Test, Independent Samples
- t Test, One Sample
- t Test, Paired Samples
- Accuracy in Parameter Estimation
- Analysis of Covariance
- Analysis of Variance
- Bartlett’s Test
- Barycentric Discriminant Analysis
- Behrens–Fisher t’ Statistic
- Bivariate Regression
- Bonferroni Procedure
- Bootstrapping
- Canonical Correlation Analysis
- Categorical Data Analysis
- Chi-Square Test
- Cluster Analysis
- Confirmatory Factor Analysis
- Contingency Table Analysis
- Contrast Analysis
- Descriptive Discriminant Analysis
- Diagnostic Classification Modeling
- Dummy Coding
- Duncan’s Multiple Range Test
- Dunnett’s Test
- Effect Coding
- Estimation
- Exploratory Factor Analysis
- Fisher’s Least Significant Difference Test
- Friedman Test
- Greenhouse–Geisser Correction
- Hidden Markov Model
- Hierarchical Linear Modeling
- Holm’s Sequential Bonferroni Procedure
- Jackknife
- Kolmogorov–Smirnov Test
- Kruskal–Wallis Test
- Latent Class Analysis
- Latent Growth Modeling
- Latent Profile Analysis
- Least Squares, Methods of
- Logistic Regression
- Mann–Whitney U Test
- Mauchly Test
- Maximum Likelihood Estimation
- McNemar’s Test
- Mean Comparisons
- Missing Data, Imputation of
- Multidimensional Scaling
- Multiple Comparison Tests
- Multiple Comparisons With Modeling Techniques
- Multiple Regression
- Multivariate Analysis of Variance
- Newman–Keuls Test
- Omnibus Tests
- Pairwise Comparisons
- Path Analysis
- Post Hoc Analysis
- Post Hoc Comparisons
- Predictive Discriminant Analysis
- Principal Components Analysis
- Propensity Score Analysis
- Scheffé Test
- Sequential Analysis
- Sign Test
- Stepwise Model Selection
- Stepwise Regression
- Structural Equation Modeling
- Survival Analysis
- Trend Analysis
- Tukey’s Honestly Significant Difference
- Welch’s t Test
- Wilcoxon Rank Sum Test
- Yates’s Correction
- Statistical Tests
- F Test
- t Test, Independent Samples
- t Test, One Sample
- t Test, Paired Samples
- z Test
- Bartlett’s Test
- Behrens–Fisher t’ Statistic
- Chi-Square Test
- Cochran–Armitage Test for Trend
- Duncan’s Multiple Range Test
- Dunnett’s Test
- Fisher’s Least Significant Difference Test
- Friedman Test
- Hosmer-Lemeshow Test
- Kolmogorov–Smirnov Test
- Kruskal–Wallis Test
- Mann–Whitney U Test
- Mauchly Test
- McNemar’s Test
- Multiple Comparison Tests
- Newman–Keuls Test
- Omnibus Tests
- Scheffé Test
- Sign Test
- Tukey’s Honestly Significant Difference
- Welch’s t Test
- Wilcoxon Rank Sum Test
- Structural Equation Modeling
- Theories, Laws, and Principles
- Central Limit Theorem
- Classical Test Theory
- Correspondence Principle
- Critical Theory
- Diffusion of Innovation Theory
- Falsifiability
- Game Theory
- Gauss–Markov Theorem
- Generalizability Theory
- Graph Theory
- Grounded Theory
- Item Response Theory
- Likelihood Principle
- Machine Learning
- Models
- Neural Networks
- Occam’s Razor
- Paradigm
- Positivism
- Postmodernism
- Probability, Laws of
- Social Capital Theory
- Social Support Theory
- Structural Paradigm
- Theory
- Theory of Attitude Measurement
- Toulmin Method
- Weber–Fechner Law
- Types of Variables
- Validity of Scores
- Loading...
Get a 30 day FREE TRIAL
-
 Watch videos from a variety of sources bringing classroom topics to life
 -
Read modern, diverse business cases
-
Explore hundreds of books and reference titles

Read next

More like this
Sage Recommends
We found other relevant content for you on other Sage platforms.
Have you created a personal profile? Login or create a profile so that you can save clips, playlists and searches