
Entry
Reader's guide
Entries A-Z
Subject index
Structural Equation Modeling
Structural equation modeling (SEM) is a data analysis technique used to specify and test a theoretical model of relations among variables. SEMs use an elaborate system of terms and notation to define and document various parts of the model. There are several different types of SEMs, including confirmatory factor analysis, path analysis, and latent growth modeling, as well as variants of those types. For each type of SEM, the degree to which the specified model fits the observed data is tested using multiple statistics. SEM is a flexible method for modeling relations among variables in life-span human development. This entry introduces SEM, describes the three major types of SEMs, and describes the current practices for testing the fit of SEMs.
What Is SEM?
SEM is a family of statistical methods for analyzing data. SEMs are considered to be confirmatory, rather than exploratory because the researcher defines the model to be tested and SEMs confirm (or disconfirm) the researcher’s prespecified theoretical model. SEM is based on the analysis of the pattern of relations among the variables included in the analysis (i.e., covariance structures, or the variance–covariance matrix of the variables). In some models, mean structures (e.g., intercepts) are also analyzed. For all SEMs, the researcher defines a theoretical model consisting of relations between the variables of interest, and the implied variance–covariance matrix based on the specified model is compared to the observed variance–covariance matrix based on the data that were collected in the study. This comparison is used to assess the fit of the specified theoretical model to the collected data.
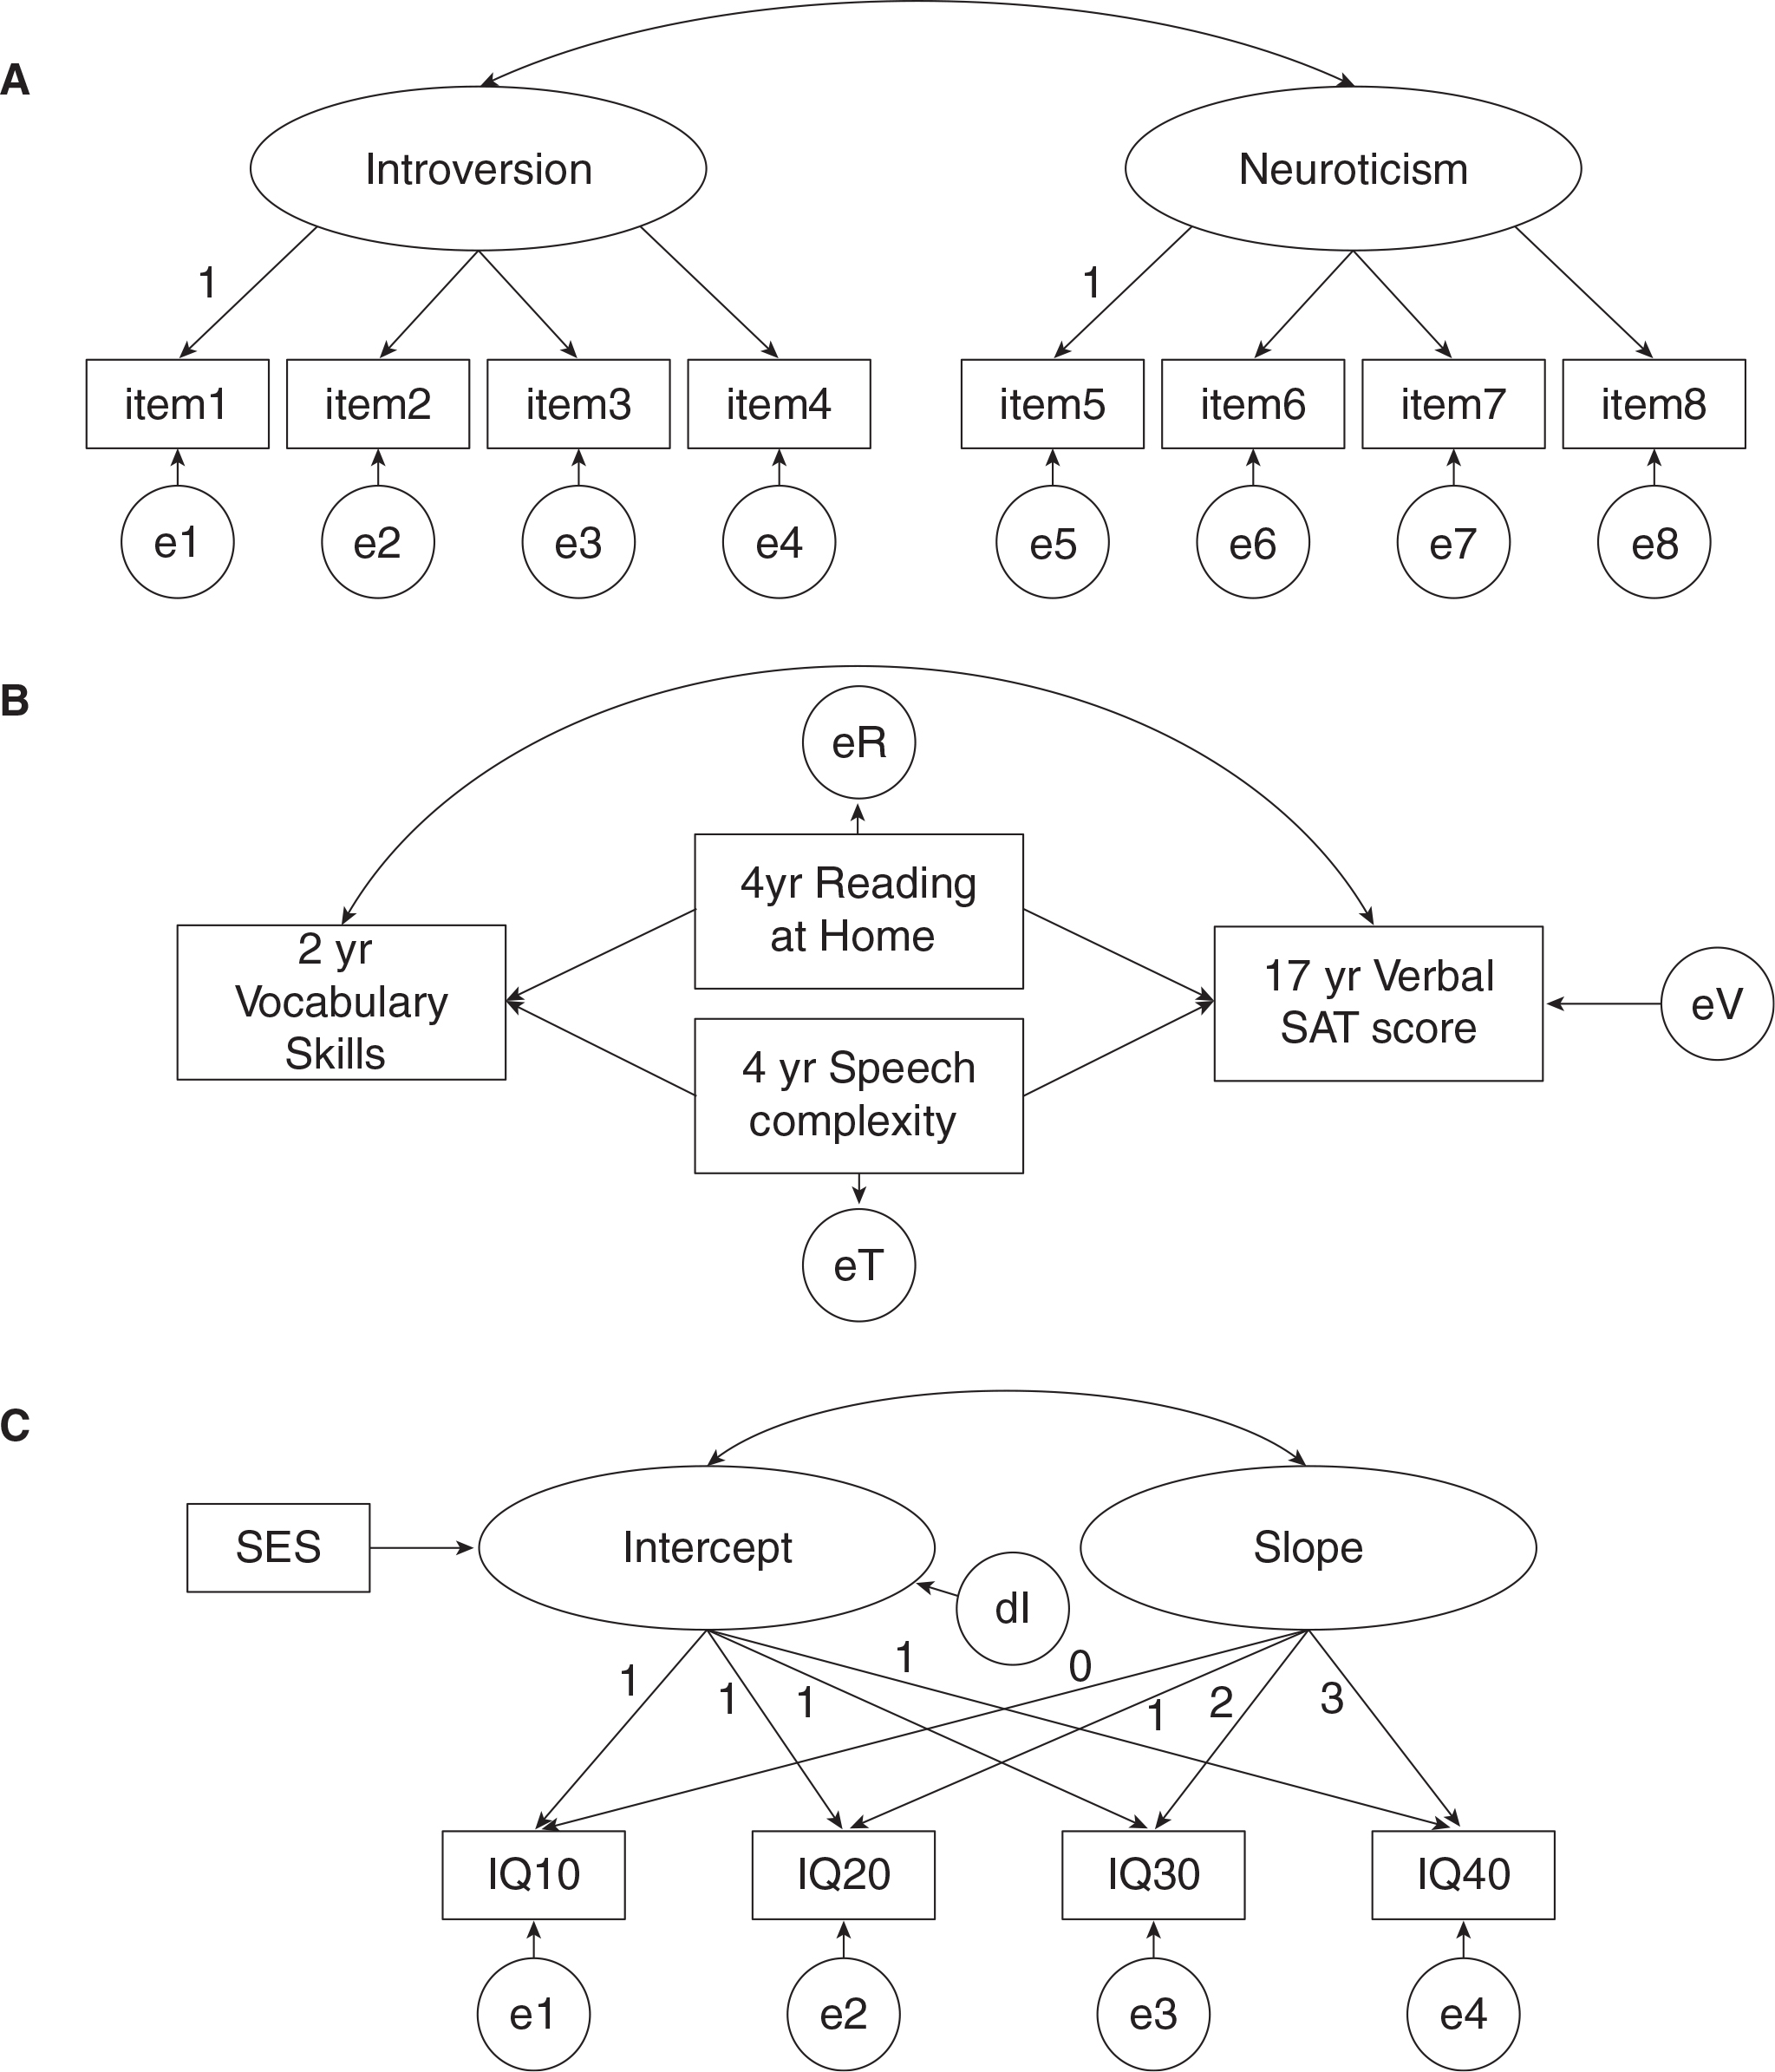
Figure 1 Three types of hypothetical structural equation models
Source: Author.
Note: A = confirmatory factor analysis; B = Path analysis; C = Latent growth analysis with a predictor of the intercept; SES = socioeconomic status.
SEM notation varies. Some researchers and computer programs use Greek letters and subscripts to identify the various parts of the model. Other researchers and programs use the Latin alphabet to identify model parts. Regardless of the notation system, all SEMs share some common components. Variables in an SEM can be observed or latent. An observed variable is one for which data were collected, and it is usually noted by a rectangle or square (Figure 1). A latent variable is one that is not observed (e.g., no data were collected) but instead is inferred from the model. Latent variables are usually noted by ovals or circles (Figure 1). A common example of a latent variable is a weighted combination of items that make up a factor (Figure 1A).
Relations between observed and/or latent variables are called paths. Paths are noted by arrows, which can be single-headed, suggesting that one variable predicts another variable, or double-headed, suggesting covariation among the variables that is not directional. The number associated with a path is called a parameter or path/structural coefficient, which is the strength of the association between the two variables. In Figure 1, paths with no associated values are being freely estimated or determined by the model. Paths with an associated value are fixed to that value and not estimated by the model.
...
- Aging
- Adult Capacity and Legal Guardianship
- Adult Children
- Adult Day Services
- Age Discrimination
- Age-Irrelevant Society
- Ageism
- Aging
- Alzheimer’s Disease
- Assisted Living
- Bereavement
- Bridge Employment
- Caregivers of Older Adults
- Centenarian
- Closure and Grief
- College Education, Long-Term Benefits of
- Death Rates, Leading Causes by Developmental Period
- Defined Benefit and Defined Contribution Pensions
- Do Not Resuscitate (DNR) Order
- Driving and Mobility in Late Life
- Elder Abuse
- Empty Nest
- End-of-Life Care
- Evolutionary Theories of Aging
- Frailty
- Generativity
- Gerontology
- Good Death
- Grandparents
- Grief
- Hospice Care
- Integrity Versus Despair
- Late Versus Early Parenthood
- Life Expectancy
- Life Narrative
- Life Review
- Life-Span Research Projects
- Living Will
- Longevity
- Mandatory Retirement
- Mastery Across Adulthood
- Menopausal Hormone Therapy
- Menopause
- Middle Age/Midlife
- Nursing Homes and Skilled Nursing Facilities
- Old Age
- Oldest Old
- Palliative Care
- Physician Orders for Life Sustaining Treatment (POLST)
- Pivot Generation
- Population Aging
- Positivity Effect
- Presbyopia and Diseases of the Eye in Late Life
- Programmed Theories of Aging
- Retirement
- Senescence
- Skill Attainment and Loss
- Stereotype Threat
- Stereotypes of Aging
- Successful Aging
- Supercentenarian
- Technology and Aging
- Terminal Decline
- Visual Disorders: Age-Related Macular Degeneration, Cataracts
- Widow, Widower
- Wisdom
- Behavior
- Activities
- Adaptive Functioning
- Agency
- Alcohol Use
- Alcohol Use Disorders
- Anger and Aggression
- Antisocial/Conduct Disorder, Externalizing Behaviors
- Attachment
- Attention
- Attention-Deficit/Hyperactivity Disorder
- Attributions
- Behavior Genetics
- Behavior Therapy
- Behavioral Inhibition (Shyness)
- Binge Drinking
- Bulimia
- Bullying
- Cliques and Social Groups
- Conformity
- Cooperation
- Creativity
- Cyberbullying
- Dating
- Deception
- Decision-Making
- Delinquency
- Eating Disorders
- Exercise
- Extracurricular Activities
- Gestures
- Goals
- Habit
- Habituation and Novelty
- Honesty and Lying
- Imitation
- Impulsivity
- Inhibition
- Intentionality
- Maltreatment
- Meditation
- Nonverbal Communication
- Perfectionism
- Phobias
- Play
- Praise
- Pretense
- Prosocial Behavior
- Reward Sensitivity
- Risk-Taking
- Ritual
- Role Taking
- Self-Deception
- Self-Regulation
- Sensation Seeking
- Sexual Behavior
- Sexual Risk Behaviors
- Social and Emotional Behavior
- Social Referencing
- Social Withdrawal/Solitude
- Speech
- Stranger Wariness
- Substance Use
- Suicidal Ideation and Behavior
- Trust
- Cognitive Development
- Academic Achievement
- Ages and Stages
- Analogical Reasoning
- Art
- Assisted Imitation
- Attention
- Attention-Deficit/Hyperactivity Disorder
- Attributions
- Autobiographical Memory
- Automaticity
- Awareness
- Beliefs
- Bilingual Education
- Bilingualism
- Categorization
- Classrooms
- Cognitive Atypicality
- Cognitive Development
- Cognitive Schemas
- Cognitive Training and Cognitive Intervention
- College Education, Long-Term Benefits of
- Competence Versus Performance
- Consciousness
- Creativity
- Critical Thinking
- Cross-Pollination in Cognitive Development
- Curriculum
- Decision-Making
- Developmental Plasticity
- Dreaming
- Educational Attainment
- Effortful Control
- Executive Control
- Executive Functioning
- Eyewitness Testimony
- Facial Expressions, Perception of
- Fantasy–Reality Distinction
- Flow
- Future Orientation (Time)
- Gender Identity Development
- Guided Participation
- Head Start
- Hearing
- Imagination
- Imitation
- Information Processing
- Intellectual Disabilities
- Intersensory Perception
- Joint Attention
- Knowledge
- Language
- Learning
- Learning Disabilities
- Literacy
- Logical Thinking
- Mathematical Thinking
- Meditation
- Memory
- Metacognition
- Mind-Mindedness
- Mind-Set
- Mindfulness
- Multiple Intelligences
- Neurocognitive Disorders
- Nonverbal Communication
- Numeracy
- Olfaction
- Perception
- Perspective Taking
- Planning Skills
- Poverty and Brain Development
- Praise
- Pretense
- Problem-Solving
- Prosocial Reasoning
- Psychological Control
- Reasoning
- Scaffolding
- School Dropout
- School Readiness
- Science, Technology, Engineering, and Mathematics
- Scientific Reasoning
- Scripts
- Social Cognition
- Social Information Processing
- Specificity Principle
- Speech
- Spirituality
- Storytelling
- Symbolic Representation
- Taste
- Teachers
- Technology Use
- Theory of Mind
- Thinking
- Touch
- Universal Education
- Vision
- Community and Culture
- Acculturation
- Advertising
- Age-Irrelevant Society
- Animism
- Art
- Beliefs
- Capacity Building
- Civic Engagement
- Civic Socialization
- Classrooms
- Climate and Environment
- Cliques and Social Groups
- Community
- Community Violence
- Computer Science
- Computers and the Internet
- Conflict-Affected Countries, Children and Adolescents in
- Conformity
- Conservation
- Conservatism
- Consumption
- Cooperation
- Corporal Punishment
- Cosleeping
- Crime
- Crisis
- Cults
- Cultural Socialization
- Culture
- Curriculum
- Dance
- Death Rates, Leading Causes by Developmental Period
- Demographic Transition
- Demography
- Differential Treatment
- Digital Divide
- Disasters, Civil and Natural
- Dissent
- Dual-Earner Family
- Ecology
- Entrepreneurship
- Ethnic-Racial Socialization
- Ethnicity
- Eyewitness Testimony
- Film
- Finances
- Foster Care
- Gang Involvement
- Gay, Lesbian, Bisexual, Transgender Issues
- Gender
- Gender Socialization
- Geography
- Global Developmental Science
- God
- Head Start
- History
- Homelessness
- Human Rights
- Human Trafficking
- Humor
- Immigration
- Incarceration, Parental
- Inequality
- Informal Labor Market
- Inheritance
- Institutions/Orphanages
- International Child Welfare
- Justice
- Language
- Liberalism
- Lifestyles
- Low- and Middle-Income Countries
- Magic
- Mattering
- Migration
- Military Families
- Museums
- Music
- Mysticism
- Neighborhoods
- Ostracism
- Political Violence
- Poverty
- Prevention Programs
- Prison
- Property
- Public Programs for Children and Families
- Refugees
- Religion and Faith
- Rites of Passage
- Ritual
- Second-Career Pattern
- Slavery
- Social Contagion
- Social Exclusion
- Social Justice
- Social Strife
- Socialization
- Sports
- Street Life
- Teachers
- Technology Use
- Television
- Toys and Games
- Unions
- Urban and Rural Living
- Violence
- Volunteerism
- Developmental Issues
- Accommodation and Assimilation
- Adolescence
- Adult Development
- Age Periods or Stages
- Bioecological Model
- Birth Order
- Birth, Biological Perspective
- Birth, Evolutionary Perspective
- Brain Development
- Cognitive Development
- Contexts of Development
- Continuity–Discontinuity Issue
- Cross-Pollination in Cognitive Development
- Cumulative Advantage and Risk
- Development
- Developmental Cascades
- Developmental Continuity and Stability
- Developmental Niche
- Developmental Origins
- Developmental Plasticity
- Developmental Psychopathology
- Developmental Science
- Developmental Tasks
- Developmental Theory
- Developmental Timetables
- Developmental Trajectories
- Early Childhood Development
- Early Deprivation
- Early Intervention
- Embodiment
- Emerging Adulthood
- Equifinality Versus Multifinality
- Experience-Dependent, Experience-Expectant Processes
- Fetal Origins Hypothesis
- Gender Development
- Gender Identity Development
- Gender Socialization
- Gene-Environment Interplay
- Guided Participation
- Identity Development
- Infancy
- Initiative Versus Guilt
- Integrity Versus Despair
- Intellectual Disabilities
- Interventions
- Intraindividual Variability Across the Life Span
- Late Versus Early Parenthood
- Life Span
- Maturation
- Maturity
- Microgenetic Analysis
- Middle Age/Midlife
- Nature–Nurture
- Newborn Assessment
- Norms
- Observational Data
- Plasticity
- Positive Adaptations in Development
- Positive Youth Development
- Poverty and Brain Development
- Prenatal Development
- Risk and Protective Factors
- Rites of Passage
- Sensitive Period
- Set Point
- Shared and Nonshared Environment
- Socialization
- Specificity Principle
- Transition to Adulthood
- Transition to Parenthood
- Genetics and Biology
- Appetite
- Autonomic Nervous System
- Behavior Genetics
- Brain
- Brain Development
- Cancer
- Cardiovascular System
- Central Nervous System
- Circadian Rhythms
- Connectome
- Cortisol
- Down Syndrome
- Epigenetics
- Evolution
- Fertility
- Fragile X Syndrome
- Gene–Environment Correlations
- Gene–Environment Interplay
- Genetic Anomalies
- Genetics
- Genomics
- Handedness
- Hearing
- Hemispheric Lateralization
- Heredity
- Hormones
- Hypothalamic–Pituitary–Adrenal (HPA) Axis
- Menopause
- Mirror Neurons
- Molecular Genetics
- Motor Development
- Multiple Partner Fertility
- Neural Connectivity
- Neuroendocrinology
- Neurogenesis
- Neuroimaging
- Olfaction
- Pregnancy
- Prenatal Development
- Pubertal Timing
- Reflexes
- Secondary Sex Characteristics
- Sensory Systems
- Set Point
- Sexual Reproduction
- Sleep
- Tanner Stages
- Taste
- Telomere
- Teratogens
- Testosterone
- Touch
- Twins
- Vision
- Health and Illness
- Adaptive Functioning
- Addiction
- Advance Directive
- Alcohol Use
- Alcohol Use Disorders
- Allergy
- Allostatic Load
- Alzheimer’s Disease
- Androgen Insensitivity Syndrome
- Anemia
- Anorexia Nervosa
- Assisted Reproductive Technologies
- Asthma
- Attention-Deficit/Hyperactivity Disorder
- Autism Spectrum Disorders
- Autoimmune Disease
- Binge Drinking
- Blindness
- Body Image
- Body Mass Index
- Bulimia
- Caloric Restriction
- Cancer
- Cardiovascular Disease
- Caregiver Stress
- Chronic Illnesses
- Chronic Stressors
- Cognitive Health
- Comorbidity/Multiple Diseases
- Compression of Morbidity
- Deafness
- Death and Dying, Children’s Understanding of
- Death With Dignity Acts
- Depression
- Developmental Origins of Health and Disease
- Developmental Psychopathology
- Diabetes
- Diet
- Disability
- Disease
- Do Not Resuscitate (DNR) Order
- Down Syndrome
- Dyslexia
- Eating Disorders
- Epidemiology
- Erectile Dysfunction
- Exercise
- Fertility
- Fetal Alcohol Syndrome
- Fragile X Syndrome
- Global Child and Maternal Health
- Health
- Health and Development in the Context of Family Relationships/Family Stress
- Health Care
- Health Literacy
- HIV/AIDS
- Hormones
- Hospice Care
- Hypertension
- Illness
- Immune System
- Immunization
- Individuals with Disabilities Education Act
- Infectious Diseases
- Injury
- Intellectual Disabilities
- Learning Disabilities
- Longevity
- Maltreatment
- Maturing Out
- Medical Settings
- Menopausal Hormone Therapy
- Mental Health
- Mental Illness
- Mood Disorders
- Mortality
- Neurocognitive Disorders
- Nutrition
- Obesity
- Pain
- Palliative Care
- Patienthood
- Physical Activity
- Physical Development and Growth
- Physical Disability
- Physical Environment
- Physical Health
- Physician Orders for Life Sustaining Treatment (POLST)
- Post-Traumatic Stress Disorder
- Poverty and Brain Development
- Prenatal Development
- Presbyopia and Diseases of the Eye in Late Life
- Preterm Birth
- Schizophrenia
- Self-Care
- Sexual Development
- Sexual Maturation
- Sexually Transmitted Infections
- Stress
- Substance Use
- Suicide
- Telehealth
- Teratogens
- Thriving
- Traumatic Stress
- Visual Disorders
- Methods
- Adoption Design
- Assessment and Testing
- Big Data
- Biometric Data
- Case Study
- Causality
- Causation
- Cohort
- Correlational Study
- Cross-Sequential Design
- Crowdsourcing
- Debriefing
- Diary Studies/Methods
- Dyadic Data
- Dynamic Systems Theory
- Ecological Validity
- Empirical Evidence
- Ethics in Research
- Ethnographic Study
- Ethology
- Field Experiments
- Focus Groups
- Goodness of Fit
- Growth Curve Modeling and Longitudinal Factor Analysis
- Hypothesis Testing
- Individual Differences in Life-Span Development
- Informed Consent
- Intensive Measurement Designs
- Interviewing Children
- Life-Span Research Projects
- Longitudinal Versus Cross-Sectional Design, Analysis
- Measurement
- Meta-Analysis
- Microgenetic Analysis
- Mixed Method Study
- Multilevel Modeling: Application for Life-Span Research
- Naturalistic Methods
- Norms
- Observational Data
- Panel Studies
- Participant Observation
- Qualitative Methods
- Quasi-Experimental Methods
- Questionnaires
- Randomized Controlled Trials
- Reliability
- Replication
- Representativeness
- Sampling
- Secondary Data Analysis
- Self-Report Assessments
- Sleeper Effect
- Sociometric Techniques
- Standardized Tests
- Structural Equation Modeling
- Structured Observation
- Survey Research
- Survival Analysis
- Telehealth
- Time Sampling
- Twin Studies
- Validity
- Personal Characteristics
- Ability
- Achievement
- Aptitude
- Attractiveness
- Behavioral Inhibition (Shyness)
- Big Five Personality Traits
- Career Choice
- Character Strengths and Virtues
- Competence Versus Performance
- Creativity
- Dismissive-Avoidant Individuals
- Ego Development
- Egocentrism
- Ethnicity
- Expertise
- Fearful-Avoidant Individuals
- Giftedness
- Grit
- Handedness
- Identity
- Insight
- Intelligence
- Jealousy and Envy
- Joviality
- Kindness
- Motivation (Intrinsic, Extrinsic)
- Narcissism
- Optimism
- Organization
- Perfectionism
- Personality
- Physical Appearance
- Planning Skills
- Playfulness
- Pride
- Purpose
- Resilience
- Security
- Self-Esteem
- Self-Worth
- Sensation Seeking
- Sexual Identity
- Sexuality
- Skill
- Social Identity
- Temperament
- Temperament and Personality
- Tolerance
- Trustworthiness
- Well-Being
- Wisdom
- Relationships and the Social World
- Adolescent–Parent Relationships
- Adoption
- Adult Attachment
- Aggression
- Attachment
- Attraction, Interpersonal
- Autonomy-Supportive Parenting
- Beanpole Family
- Blended Family
- Caregiver Stress
- Close Relationships
- Coaching
- Cohabitation
- Convoy Model
- Coparenting
- Dating
- Diverse Families/Stepfamilies
- Divorce
- Domestic Violence/Partner Violence
- Dyadic Regulation
- Ethnic-Racial Socialization
- Familism
- Family Chaos
- Family Contexts
- Family Life Cycle
- Family Rituals
- Family Synchrony
- Family Systems
- Fathering
- Filial Anxiety
- Filial Piety
- Friendships
- Gay, Lesbian, Bisexual, Transgender Issues
- Gender Socialization
- Glass Ceiling
- Grandchildren
- Grandparents
- Homophily
- Household Chaos
- Household Economics
- Indirect Aggression
- Indiscriminate Social Responsiveness
- Interactions, Interpersonal
- Intergenerational Programs
- Intergenerational Relationships
- Intergenerational Transmission
- Internal Working Model
- Interpersonal Relationships
- Intersubjectivity
- Kinship
- Marital Conflict
- Marital Relationships
- Marriage
- Mattering
- Mentoring
- Multigenerational Family
- Neurobiology of Affiliation
- Neurobiology of Mothering
- Nuclear Family
- Online Communication
- Organization of Relationships: Messiness and Reparation
- Ostracism
- Parent–Child Conflict
- Parent–Child Interactions
- Parent–Child Synchrony
- Parental Authority
- Parental Conditional Regard
- Parenting
- Parenting by Lesbians and Gay Men; Outcomes for Children and Youth
- Parenting Style
- Peer Rejection
- Peer Victimization
- Peers
- Pets
- Popularity
- Public Engagement
- Remarriage
- Romantic Relationships
- School–Family Links
- Siblings, Sibling Relationships
- Single Parenthood
- Social Capital
- Social Competence
- Social Exclusion
- Social Groups
- Social Information Processing
- Social Isolation
- Social Networks
- Social Relationships
- Social Support
- Stepfamilies
- Stepfamilies and Blended Families
- Street Life
- Teen Parenthood
- Transactions
- Victimization
- Work/Family Conflict
- Services
- Adult Day Services
- Assisted Living
- Child Care
- Continuing Care Retirement Communities
- Early Child Care
- End-of-Life Care
- Government
- Hospice Care
- Medicaid
- Medicare
- Nurse Home Visiting
- Nursing Homes and Skilled Nursing Facilities
- Palliative Care
- Prevention Programs
- Public Policy
- Public Programs for Children and Families
- Social Safety Net Programs
- Social Security
- Sociocultural Constructs
- Accidents
- Adaptation
- Adversity
- Aesthetics
- Altruism
- Art
- Asceticism
- Athletics
- Attitudes
- Authority
- Awe
- Beauty
- Causality
- Census
- Conformity
- Conscience
- Dance
- Deception
- Discipline
- Dissent
- Empathy
- Ethics
- Familism
- Forgiveness
- Free Will
- Gender
- Generosity
- Glass Ceiling
- Human Rights
- Identity Development
- Ideology
- Inequality
- Insurance
- Justice
- Law
- Leadership
- Leisure
- Liberalism
- Materialism
- Mattering
- Media
- Morality
- Negotiation
- Norms
- Organizations
- Ownership
- Paradox
- Philanthropy
- Politics
- Property
- Public Engagement
- Reciprocity
- Rejection Versus Acceptance
- Sin
- Social Capital
- Social Categorization
- Social Inequality
- Social Status
- Socioeconomic Status
- Specificity Principle
- Status Hierarchy
- Stereotype (Stereotyping)
- Symbolic Representation
- Time
- Universal Education
- Values
- War
- Work
- Socioemotional Development
- Affective Forecasting
- Aggression
- Anger
- Anxiety
- Bullying
- Character Strengths and Virtues
- Child Abuse and Neglect
- Child Maltreatment
- Closure and Grief
- Compassion
- Coping
- Crying
- Cyberbullying
- Difficult Children
- Discriminating Sociability
- Discrimination/Prejudice
- Disgust
- Doubt
- Emotion Regulation
- Emotion Socialization
- Emotion-Focused Coping
- Emotional Expression
- Emotional Intelligence
- Emotions
- Empathy
- Fear
- Gender Development
- Gender Identity Development
- Gratitude
- Grief
- Guilt
- Happiness
- Hope
- Jealousy and Envy
- Life Goals
- Life Satisfaction
- Loneliness
- Love
- Parent–Child Interaction
- Persuasion
- Phobias
- Prosociality
- Psychological Needs
- Psychosexual Stages of Development
- Psychosocial Development
- Psychosocial Moratorium
- Regret
- Sadness
- Self
- Self-Actualization
- Self-Deception
- Self-Esteem
- Self-Perceptions
- Self-Regulation
- Self-Worth
- Sensation Seeking
- Sex Differences
- Sex Education
- Sexual Assault
- Sexual Attitudes
- Sexual Identity
- Sexual Risk Behaviors
- Shame
- Smile
- Social and Emotional Behavior
- Social Anxiety
- Social Development
- Social Understanding
- Sympathy
- Theory of Mind
- Trust
- Theory
- Activity Theory
- Developmental Theory
- Diathesis–Stress Model
- Dynamic Systems Theory
- Eriksonian Theory
- Ethnotheories
- Evolutionary Theories of Aging
- Information Processing
- Life History Theory
- Piaget’s Theory
- Programmed Theories of Aging
- Psychoanalytic Theory
- Relational Developmental Systems
- Social Cognitive Theory
- Social Equity Theory
- Socioemotional Selectivity Theory
- Solidarity Theory
- Specificity Principle
- Universals
- Vygotsky’s Sociocultural Theory
- Loading...
Get a 30 day FREE TRIAL
-
 Watch videos from a variety of sources bringing classroom topics to life
 -
Read modern, diverse business cases
-
Explore hundreds of books and reference titles

Read next

More like this
Sage Recommends
We found other relevant content for you on other Sage platforms.
Have you created a personal profile? Login or create a profile so that you can save clips, playlists and searches