
Entry
Reader's guide
Entries A-Z
Subject index
Statistics: Descriptive
Descriptive statistics are numerical measures of a condition and often considered a snapshot of a point in time. As such, they are useful for understanding but not designed to predict. This entry discusses the use of statistics for reporting basic results.
In many cases, it is only necessary to produce an estimate of the number, proportion, or distribution of one variable at a time (univariate statistics). In other cases, it is more helpful to subdivide the data and look at the interaction between one variable and another (multivariate statistics), as when, for example, considering if a particular speech pattern is more likely in one region or another.
Normally, a small group (sample) is studied to infer or generalize the results to a much larger group (population). The generalizability of the statistics is dependent on the relationship between the sample and population. The ideal scientifically drawn sample is one where there is a known equal chance for each member of the population to be in the sample. Random selection is the most common method to create a representative sample. Convenience or purposive samples do not produce representative results because many in the population have no chance of being in the sample. The lack of generalizability results from the assumption that those in the sample are fundamentally different from the population so the results are equally inconsistent.
Data levels are broadly divided into two main categories: nonparametric and parametric. Nonparametric data use categories where there is no strong relationship between the data and an actual number, such as geographic area, gender, or diagnosis code. Parametric data include those measures where a number can accurately describe the condition, such as decibel, weight, or grade point average.
Nonparametric Data
Researchers usually describe nonparametric data in proportions or percentage, such as indicating one out of three, or 33%, individuals hold a certain opinion. Proportions from a single variable can be useful, but multivariate evaluations can more fully describe a condition. For example, if 20% of individuals from one city but 60% from a second city holds a certain opinion, then we have a better understanding of the distribution of the attitude.
Parametric Data
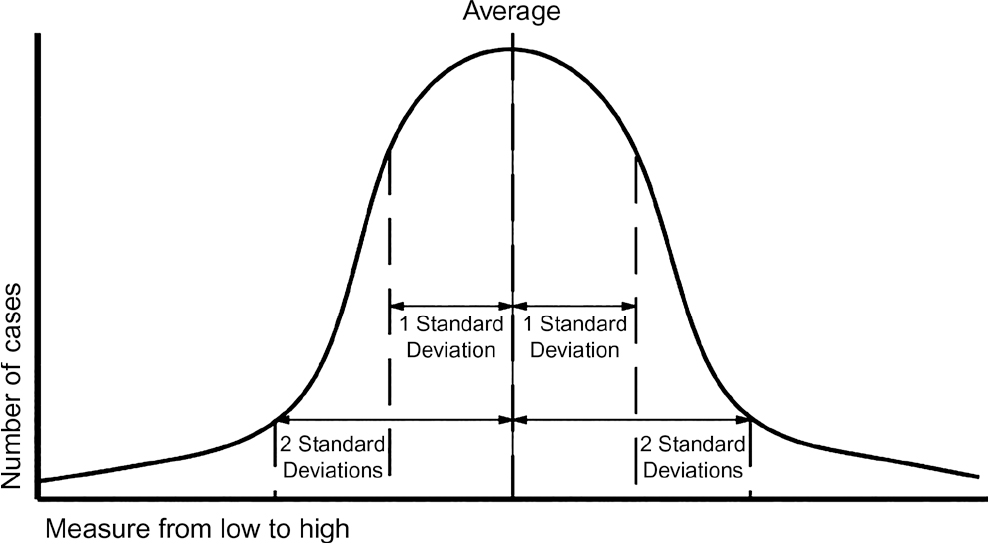
With parametric data, the major descriptive techniques include measures of central tendency and measures of dispersion. These two concepts are compared to the standard bell curve. Imagine if one were measuring the height of large group. Some people are tall and some are short, but most fall somewhere in the middle. Plotting height by the number of people at each height provides a curved line that starts low with the few very short people, progressively rises for the larger groups at average height, and drops for fewer people who are very tall.
Figure 1 Bell curve or normal distribution: The typical distribution where measures are plotted by the number of cases at each measurement level
Measures of Central Tendency
Measures of central tendency represent the variable at the height of that curve or the most common measure. Mean or average is the sum or all measures divided by the number of measures and the most common measure of central tendency. Mean is the appropriate descriptive measure where there is a normal distribution of scores (most representing the bell-shaped curve).
...
- Anatomy and Physiology
- Acoustic Reflex
- Anatomy of the Hearing Mechanism and Central Audiology Nervous System
- Anatomy of the Human Articulators
- Anatomy of the Human Larynx
- Anatomy of the Human Neurological System
- Aspiration: Swallowing
- Auditory Brainstem Response
- Binaural Hearing
- Laryngopharyngeal Reflux (LPR)
- Late Auditory Evoked Potentials
- Paradoxical Vocal Cord Dysfunction (PVCD)
- Pathophysiology of Stroke
- Pathophysiology of Traumatic Brain Injury
- Physiological Basis for Voice
- Physiological Basis of Hearing
- Physiological Basis of Swallowing
- Plasticity of the Brain
- Regional Cerebral Blood Flow (rCBF)
- Reinnervation of the Larynx
- Sound Localization and Auditory Spatial Perception
- Vestibular System
- Vocal Production System: Evolution
- Voice Production: Physics
- Assessment Issues
- Academic Impact of Communication Disorders
- Advocacy
- Allocation of Resources
- Ambulatory Phonation Monitoring
- Anchored Assessment
- Aphasia Assessment
- Articulation (Phonetic) Assessment
- Baselines
- Bias
- Brain Imaging
- Causation
- Ceiling Effect in Testing
- Cepstral Analysis of Voice
- Classification Systems
- Cognitive Processes and Operations
- Communicative Competence
- Compensatory Adaptation and Strategies
- Comprehension
- Context
- Conversation
- Conversation Analysis
- Cultural and Linguistic Informants
- Descriptive Assessment
- Diagnosis of Communication Disorders
- Diagnostic and Statistical Manual of Mental Disorders (DSM)
- Diagnostic Audiological Assessment
- Diagnostic Reasoning
- Dialects and Dialectology
- Discourse Analysis
- Dynamic Assessment
- Educational Audiology
- Epidemiology of Communication Disorders
- Etiology
- Eye-Tracking Technology
- Fiberoptic Endoscopic Evaluation of Swallowing (FEES)
- Forensic Speech–Language Pathology
- Frequency Response
- Functional Assessment
- Functional Communication Skills
- Gatekeeping
- Geriatric Audiology
- Hearing Screening
- Hearing Tests
- Incidence of Communication Disorders
- Individual Differences
- Instrumental Analysis of Speech
- Instrumental Assessment of Voice Disorders
- Intelligibility
- International Classification of Functioning, Disability and Health
- Interviewing
- Labeling of Communication Disorders
- Language Assessment
- Language Difference
- Language Sampling
- Linguistic Profiles
- Listening Effort
- Mean Length of Utterance (MLU)
- Miscue Analysis
- Multidimensional Scoring
- Nasalance and Nasometry
- Observation
- Operationalism
- Pediatric Audiological Assessment
- Phonetic Transcription
- Phonological Processes
- Play
- Poverty and Language
- Prescriptive and Descriptive Approaches
- Prevalence of Communication Disorders
- Prognosis
- Prompts
- Proxemics
- Readability
- Reading Fluency
- Referral Issues
- Reliability
- Residual Speech Sound Errors
- Resilience
- Response to Intervention (RtI)
- Sampling Rate
- Screening for Speech and Language Disorders
- Self-Assessment of Speech Disorders
- Self-Assessment, Audiology
- Skills Versus Strategies
- Sound Spectography
- Speech Audiometry
- Speech Intelligibility Index (SII)
- Speech Mechanism Examination
- Speech Sampling
- Standardized Testing
- Statistics: Descriptive
- Statistics: Inferential
- Stimulability
- Swallowing Assessment
- Systemic Functional Linguistics
- Teratogens
- Test–Retest Approach
- Threshold
- Transcranial Stimulation
- Type Versus Token
- Ultrasonography
- Validity
- Vestibular Assessment
- Videofluoroscopic Swallow Study
- Vocal Quality: Perceptual Evaluation
- Cognitive Aspects of Communication
- Abstraction
- Allocation of Resources
- Attention
- Attention Deficit Hyperactivity Disorder (ADHD)
- Autism Spectrum Disorder
- Categorical Perception
- Cognition
- Cognitive Behavioral Therapy
- Cognitive Development
- Cognitive Impairment
- Cognitive Linguistics
- Cognitive Neuropsychological Approach to Intervention
- Cognitive Processes and Operations
- Cognitivism
- Comprehension
- Dementia
- Dichotic Listening
- Distributed Cognition
- Executive Function and Communication
- Intellectual Disability
- Intelligence
- Listening Effort
- Memory
- Memory Disorders
- Memory Impairments in Aphasia
- Metacognitive
- Modularity
- Perception
- Priming
- Schemata
- Scripts
- Skills Versus Strategies
- Theory of Mind
- Traumatic Brain Injury
- Communication Modalities
- Affect
- American Sign Language
- Amusia
- Augmentative and Alternative Communication (AAC)
- Australian Sign Language (Auslan)
- British Sign Language (BSL)
- Captioning
- Comprehension
- Connected Speech
- Conversation
- Cued Speech and Language
- Fingerspelling
- Gaze
- Key Word Signing Systems
- Kinesics
- Modality
- Multimodal Communication
- Nonverbal Communication
- Oral Language
- Proxemics
- Semiotics
- Signed Languages
- Speechreading
- Writing Systems
- Development/Acquisition
- Adaptation Theory
- Attention
- Auditory Development
- Babbling
- Behaviorism
- Chronological Age
- Cognitive Development
- Constructivism
- Critical Period for Language Acquisition
- Delayed Language Development
- Delayed Phonological Development
- Early Literacy Development
- Emergentism
- Foundations for Language Learning in the Neonatal and Early Infant Period
- Genetics
- Grammatical Development
- Imitative Response
- Intentionality
- Joint Attention
- Language Acquisition
- Late Talkers
- Mapping Hypothesis
- Mean Length of Utterance (MLU)
- Motherese
- Naming
- Nativism
- Otitis Media
- Phonological Development
- Play
- Pragmatic Development
- Resilience
- Second-Language Acquisition
- Semantic Development
- Social Development
- Socialization
- Speech Sound Development and Disorders in Multilinguals
- Speech, Language, and Learning Difficulties Associated With Prenatal Drug Exposure
- Statistical Learning
- Theories of Language Acquisition
- Theory of Mind
- Usage-Based Approach to Language Acquisition
- Zone of Proximal Development
- Diversity
- Accent Modification
- African American English
- Australian Aboriginal Languages
- Bias
- Bilingual Aphasia
- Bilingual Children With Specific Language Impairment
- Bilingual Education
- Bilingualism
- Code Switching and Mixing
- Crosslinguistic Manifestations of Disordered Speech and Language
- Cultural and Linguistic Informants
- Culture
- Deaf Culture
- Dialects and Dialectology
- Diglossia
- Diversity
- Indigenous Languages
- Indigenous Languages of Central and South America
- Indigenous Languages of North America
- Indigenous Languages of the Pacific
- Intercultural Communication
- International Adoption: Impact on Speech and Language Abilities
- Language Difference
- Language Register
- Multilingualism
- Multilingualism and Speech Sound Disorders
- Pidgin and Creole Languages
- Poverty and Language
- Relevance Theory
- Second-Language Acquisition
- Signed Languages
- Sociolinguistics
- Sociolinguistics of Sign Languages
- Stigma
- Stylistics
- Tone Languages and Communication Disorders
- Translation
- Varieties of English
- Etiologies
- Age-Related Hearing Loss
- Alzheimer’s Disease
- Amyotrophic Lateral Sclerosis
- Arthritis: Laryngeal Involvement
- Auditory Neuropathy Spectrum Disorder
- Blindness, Impact on Communication
- Cancer of the Head and Neck
- Cerebral Palsy
- Chronic Cough
- Cleft Lip and Palate: Speech Effects
- Concussion
- Craniofacial Anomalies
- Dementia
- Down Syndrome
- Fetal Alcohol Spectrum Disorder
- Functional Communication Skills
- Functionalism
- Genetics
- Genetics and Stuttering
- Genetics of Hearing Loss
- Hydrocephalus
- Infectious Diseases and Communication Disorders
- Intellectual Disability
- Irritable Larynx Syndrome
- Laryngeal Disorders: Benign Vocal Fold Pathologies
- Laryngectomy
- Laryngopharyngeal Reflux (LPR)
- Learned Helplessness
- Muscle Tension Dysphonia (MTD)
- Myasthenia Gravis
- Noise-Induced Hearing Loss and Its Prevention
- Occupation-Related Dysphonia
- Otitis Media
- Ototoxicity
- Parkinson’s Disease
- Post-Polio Syndrome (PPS)
- Psychiatric Disorders With Communication Disorders
- Psychogenic Voice Disorders
- Psychological Stress and Speech Disorders
- Radiation Therapy and Communication Disorders
- Seizure Disorders
- Sleep: Effects on Language Learning
- Speech, Language, and Learning Difficulties Associated With Prenatal Drug Exposure
- Stroke
- Stuttering, Cause of
- Tardive Dyskinesia
- Teratogens
- Tongue Thrust
- Tourette Syndrome
- Trauma to Speech and Hearing Mechanisms
- Traumatic Brain Injury
- Velocardiofacial Syndrome (VCFS)
- Williams Syndrome
- Fluency and Fluency Disorders
- Altered Auditory Feedback and Stuttering
- Attitudes in Stuttering
- Circumlocution and Avoidance in Stuttering
- Cluttering
- Covert Stuttering
- Delayed Auditory Feedback
- Fluency and Disfluency, Typical
- Fluency and Fluency Disorders
- Intensive Stuttering Programs
- Neurogenic Stuttering
- Paralinguistic and Prosodic Impact on Stuttering
- PostTreatment Relapse in Stuttering
- Quality of Life and Stuttering
- Relaxation Therapy
- Stuttering and Adolescence
- Stuttering and Emotional Reactions
- Stuttering and Language Complexity
- Stuttering Treatment
- Stuttering, Cause of
- Stuttering, Effects of
- Stuttering, Motor Control in
- Stuttering, Motor Control in Stuttering
- Stuttering, Response to
- Temperament, Anxiety, and Stuttering
- Gerontology and Communication Disorders
- Hearing and Hearing Disorders
- Acclimatization to Hearing Aids
- Acoustic Admittance
- Acoustic Ecology
- Acoustic Reflex
- Acoustics
- Age-Related Hearing Loss
- Air and Bone Conduction
- Amplitude Compression
- Amplitude Envelope
- Amusia
- Anatomy of the Hearing Mechanism and Central Audiology Nervous System
- Assistive Listening Devices
- Audiology
- Audiovisual Integration
- Auditory Brainstem Implant
- Auditory Brainstem Response
- Auditory Development
- Auditory Neuropathy Spectrum Disorder
- Auditory Processing
- Auditory Processing Disorder
- Auditory Scene Analysis
- Auditory Steady-State Response
- Auditory Training
- Background Noise
- Binaural Hearing
- Captioning
- Classroom Acoustics
- Cochlear Hearing loss
- Cochlear Implant (Re)habilitation
- Cochlear Implants
- Conductive Hearing Loss and Its Treatment
- Decibel
- Diagnostic Audiological Assessment
- Dichotic Listening
- Digital Signal Processing
- Distortion
- Dual Sensory Impairment (DSI)
- Earphones and Other Transducers
- Educational Audiology
- Electrocochleography (ECochG)
- Electronsytagmography (ENG) and Videonystagmograhy (VNG)
- Frequency Compression and Transposition
- Frequency Resolution
- Frequency Response
- Functional Hearing Loss
- Genetics of Hearing Loss
- Geriatric Audiology
- Hard of Hearing
- Hearing Accessibility
- Hearing Aid Earmold
- Hearing Aid Fitting
- Hearing Aids
- Hearing Assistive Technology
- Hearing Disability and Disorders
- Hearing Screening
- Hearing Tests
- Hyperacusis
- Late Auditory Evoked Potentials
- Listening Effort
- Loudness
- Ménière’s Disease
- Masking
- Noise-Induced Hearing Loss and Its Prevention
- Otitis Media
- Otoacoustic Emissions (OAEs)
- Ototoxicity
- Pediatric Audiological Assessment
- Pediatric Audiological Rehabilitation
- Pharmacological Interventions in Hearing Disorders
- Physiological Basis of Hearing
- Pitch
- Prevention of Hearing Disorders
- Psychoacoustics
- Pure-Tone Audiometry
- Rehabilitative Audiology
- Retrocochlear Hearing Loss
- Room Acoustics
- Saturation Sound Pressure Level (SSPL)
- Self-Assessment, Audiology
- Signal Detection Theory
- Sound Localization and Auditory Spatial Perception
- Speech Audiometry
- Speech Intelligibility Index (SII)
- Speech Tracking
- Speechreading
- Temporal Fine Structure
- Temporal Processing
- Threshold
- Tinnitus
- Vestibular Assessment
- Vestibular Disorders
- Vestibular Rehabilitation
- Vestibular System
- Vocoding Techniques
- Word Deafness
- Intervention and Therapeutic Issues
- Accent Modification
- Acclimatization to Hearing Aids
- Accountability in Therapy for Communication Disorders
- Advocacy
- Allocation of Resources
- Altered Auditory Feedback and Stuttering
- Aphasia Intervention
- Articulation Therapy (Phonetic Intervention)
- Auditory Training
- Augmentative and Alternative Communication (AAC)
- Baselines
- Behaviorism
- Bibliotherapy
- Biofeedback
- Book Clubs, Communication-Adapted
- Breathing Exercises
- Bullying and Teasing
- Captioning
- Caseload
- Clinician
- Coaching
- Cochlear Implant (Re)habilitation
- Cognitive Behavioral Therapy
- Cognitive Neuropsychological Approach to Intervention
- Cognitive Processes and Operations
- Cognitivism
- Collaboration in Speech–Language Therapy
- Communication Partner Training
- Compensatory Adaptation and Strategies
- Compensatory Strategies: Swallowing
- Comprehension
- Computer-Aided Rehabilitation
- Conductive Hearing Loss and Its Treatment
- Constructivism
- Context
- Cooperative Learning
- Counseling in Speech–Language Pathology
- Cued Speech and Language
- Discharge From Therapy
- Educational Audiology
- Efficacy and Effectiveness in Treatment Studies
- Ethics in Communication Disorders Service Delivery
- Evidence-Based Practice
- Feedback in Therapy
- Functionalism
- Geriatric Audiology
- Group Therapy
- Hearing Accessibility
- Hearing Aid Fitting
- Hearing Assistive Technology
- Inclusion Models in Special Education
- Individual Differences
- Intelligibility Enhancement
- Intensive Stuttering Programs
- Journaling
- Key Word Signing System
- Language Difference
- Language Therapy and Intervention
- Manual Circumlaryngeal Techniques in Voice Disorders
- Mediation in Therapy
- Medical Management of Voice Disorders
- Modified Diet
- Motivation
- Outcome Measurement
- Pediatric Audiological Rehabilitation
- Person-Centered Care
- Pharmacological Interventions in Hearing Disorders
- Pharmacological Interventions in Speech and Language Disorders
- Phonological Treatment
- Placebo Effect
- Plasticity of Brain
- Play Therapy
- Positive Psychology and Wellness
- Preschool Language Intervention
- Prevention of Speech and Language Disorders
- Priming
- Prompts
- Prosthetics for Structural Deficits
- Recovery From Aphasia
- Rehabilitation
- Rehabilitative Audiology
- Relaxation Therapy
- Response to Intervention (RtI)
- Revaluing Reading
- Self-Advocacy
- Self-Correction
- Self-Management
- Semi-occluded Vocal Tract Techniques
- Service Delivery Models
- Skills Versus Strategies
- Social Stories
- Speech Tracking
- Speechreading
- Spontaneous Recovery
- Stuttering Treatment
- Support Groups
- Swallowing Disorders: Prophylactic Therapy
- Swallowing Rehabilitation in Adults
- Telepractice
- Tissue Engineering
- Treatment Research
- Ultrasonography
- Ventilator-Assisted Speech Production
- Vestibular Rehabilitation
- Vocal Hygiene
- Voice Therapy
- Voice Therapy for the Professional Singer
- Yawn-Sigh Technique
- Zone of Proximal Development
- Language and Language Disorders
- Academic Impact of Communication Disorders
- Adolescent Language Disorders
- Attention Deficit Hyperactivity Disorder (ADHD)
- Autism Spectrum Disorders
- Bilingual Children With Specific Language Impairment
- Clinical Linguistics
- Delayed Language Development
- Descriptive Assessment
- Discourse Impairments
- Dynamic Assessment
- Echolalia
- Expressive and Receptive Language
- Formulaic Language
- Language
- Language Acquisition
- Language Assessment
- Language Delay
- Language Difference
- Language Disorders in Children
- Language Disorders of People With Hearing Impairment
- Language Sampling
- Language Therapy and Intervention
- Late Talkers
- Learning Disabilities
- Miscue Analysis
- Narratives
- Nonverbal Communication
- Oral Language
- Pragmatic Impairment
- Preschool Language Intervention
- Prevention of Speech and Language Disorders
- Readability
- Reading and Reading Disorders
- Reading Fluency
- Response to Intervention (RtI)
- Revaluing Reading
- Selective Mutism
- Semantic Disorders
- Speech Sampling
- Standardized Testing
- Statistical Learning
- Syntactic Disorders
- Tone Languages and Communication Disorders
- Writing and Writing Disorders
- Linguistics
- Abstraction
- Acoustic Phonetics
- Adjectives and Adverbs
- Adpositions and Conjunctions
- African American English
- Allophone
- American Sign Language
- Applied Linguistics
- Articulatory Phonetics
- Auditory Phonetics
- Australian Aboriginal Languages
- Australian Sign Language (Auslan)
- Babbling
- Bilingualism
- British Sign Language (BSL)
- Cascade Effect
- Causation
- Clauses and Phrases
- Clinical Linguistics
- Clinical Phonetics
- Clinical Phonology
- Code Switching and Mixing
- Cognitive Linguistics
- Cohesion and Coherence
- Communicative Competence
- Competence and Performance
- Comprehension
- Consonants
- Context
- Conversation
- Conversation Analysis
- Cooperative Principle
- Corpus Linguistics
- Critical Discourse Analysis
- Deixis
- Descriptive Linguistics
- Determiners
- Dialects and Dialectology
- Diglossia
- Discourse
- Discourse Analysis
- Emergence and Human Communication
- Expressive and Receptive Language
- Felicity Conditions
- Functionalism
- Generative Linguistics
- Grammatical Development
- Implicature
- Indigenous Languages
- Indigenous Languages of Central and South America
- Indigenous Languages of North America
- Indigenous Languages of the Pacific
- Information Structure
- Intentionality
- Intonation
- Key Word Signing Systems
- Language
- Language Acquisition
- Language Difference
- Language Families
- Language Register
- Language Sampling
- Languages of Africa
- Languages of Central, South, and West Asia: Urdu and Persian
- Languages of East Asia
- Languages of Europe
- Languages of Mainland South East Asia
- Languages of North Asia
- Languages of South Asia
- Languages of the Caucasus
- Languages of the Middle East and North Africa
- Languages of West and Central Asia: Turkic
- Lenition and Fortition
- Lexicon
- Linear Phonology
- Linguistic Profiles
- Linguistic Typology
- Linguistics
- Markedness
- Mean Length of Utterance (MLU)
- Meaning
- Metalinguistics
- Metaphonology
- Metaphor
- Modularity
- Morphology
- Motherese
- Multilingualism
- Naming
- Narratives
- Neurolinguistics
- Neurophonetics
- Neuropragmatics
- Nonlinear Phonology
- Nouns and Pronouns
- Optimality Theory
- Oral Language
- Origins of Language
- Phoneme
- Phonetic Transcription
- Phonetics
- Phonological Development
- Phonological Processes
- Phonology
- Pidgin and Creole Languages
- Pitch
- Pragmatic Development
- Pragmatics
- Prescription and Descriptive Approaches
- Priming
- Prosody
- Psycholinguistics
- Recursion
- Reference
- Relational Analysis
- Relevance Theory
- Rule-Governed Alternations
- Second-Language Acquisition
- Semantic Field
- Semantics
- Semiotics
- Sense
- Sociolinguistics
- Sonority
- Speech Act Theory
- Stylistics
- Syllable
- Syntax and Grammar
- Systemic Functional Linguistics
- Texts
- Universal Grammar
- Verbs
- Vocabulary
- Vowels
- Writing Systems
- Xenophone
- Neurogenics and Neurological Disorders
- Agnosia
- Alzheimer’s Disease
- Amusia
- Amyotrophic Lateral Sclerosis
- Anatomy of the Hearing Mechanism and Central Audiology Nervous System
- Anatomy of the Human Neurological System
- Anomia
- Aphasia
- Aphasia Assessment
- Aphasia Intervention
- Apraxia of Speech
- Auditory Neuropathy Spectrum Disorder
- Bilingual Aphasia
- Brain Imaging
- Cerebral Palsy
- Childhood Apraxia of Speech
- Communication Partner Training
- Compensatory Adaptation and Strategies
- Concussion
- Concussive Injury
- Coping Hypothesis
- Dementia
- Dysarthria
- Dysphonia
- Electroencephalography (EEG)
- Epilepsy
- Foreign Accent Syndrome
- Hemiplegia
- Hydrocephalus
- Jargon and Jargon Aphasia
- Memory Impairments in Aphasia
- Motor Speech Disorders
- Multidimensional Scoring
- Myasthenia Gravis
- Neuroconstructivism
- Neurogenic Communication Disorders
- Neurogenic Stuttering
- Neurolinguistics
- Paraphasia
- Parkinson’s Disease
- Pathophysiology of Stroke
- Pathophysiology of Traumatic Brain Injury
- Premorbid Level
- Primary Progressive Aphasia
- Prognosis
- Psychosocial Impact of Aphasia
- Quality of Life and Neurogenic Communication Disorders
- Recovery From Aphasia
- Regional Cerebral Blood Flow (rCBF)
- Right Hemisphere Cognitive-Communication Disorders
- Seizure Disorders
- Spontaneous Recovery
- Stereotypy
- Stroke
- Supported Conversation for Adults With Aphasia (SCA)
- Swallowing Disorders
- Tardive Dyskinesia
- Tourette Syndrome
- Transcranial Stimulation
- Traumatic Brain Injury
- Vestibular Disorders
- Physics of Hearing and Speech
- Acoustics
- Air and Bone Conduction
- Airflow Measurement
- Amplitude Compression
- Amplitude Envelope
- Bernoulli Effect
- Boyle’s Law
- Categorical Perception
- Decibel
- Digital Signal Processing
- Distortion
- Frequency Resolution
- Frequency Response
- Jitter and Shimmer
- Loudness
- Pitch
- Sampling Rate
- Temporal Fine Structure
- Timbre
- Voice Acoustics
- Voice Production: Physics
- Professional Matters
- Advocacy
- Bias
- Classification Systems
- Clinician
- Communicative Competence
- Cultural and Linguistic Informants
- Databases in Communication Disorders
- Diagnostic and Statistical Manual of Mental Disorders (DSM)
- Diversity
- Educational Audiology
- Efficacy and Effectiveness of Treatment Studies
- Emotional Impact of Communicative Disorders
- Enculturation Into the Profession
- Epidemiology of Communication Disorders
- Ethics in Communication Disorders Research
- Ethics in Communication Disorders Service Delivery
- Evidence-Based Practice
- Forensic Speech–Language Pathology
- Functional Communication Skills
- Gatekeeping
- Incidence of Communication Disorders
- Intercultural Communication
- International Classification of Functioning, Disability and Health
- Internet Resources
- Labeling of Communication Disorders
- Learned Helplessness
- Locus of Control
- Motivation
- Nonverbal Communication
- Outcome Measurement
- Person-Centered Care
- Placebo Effect
- Positive Psychology and Wellness
- Power Relations in Service Delivery
- Prevalence of Communication Disorders
- Prevention of Hearing Disorders
- Prevention of Speech and Language Disorders
- Professional Associations
- Prognosis
- Psychological Stress and Speech Disorders
- Psychosocial Issues Associated With Communication Disorders
- Referral Issues
- Reliability
- Research
- Self-Correction
- Self-Help Groups
- Skills Versus Strategies
- Socialization
- Special Education
- Speech–Language Pathology
- Stigma
- Support Groups
- Technology and Communication Disorders
- Telehealth
- Temporal Imperative
- Treatment Research
- Validity
- Vocal Hygiene
- Research
- Case Studies
- Conversation Analysis
- Ethics in Communication Disorders Research
- Ethnographic Approaches in Research
- Experimental Research
- Eye-Tracking Technology
- Focus Groups
- Grounded Theory
- Instrumental Analysis of Speech
- Interviewing
- Meta-Analysis
- Observation
- Phenomenology
- Placebo Effect
- Qualitative Research
- Quantitative Research
- Reliability
- Research
- Statistical Learning
- Statistics: Descriptive
- Statistics: Inferential
- Treatment Research
- Ultrasonography
- Validity
- Virtual Reality
- Service Delivery General Issues
- Accountability in Therapy for Communication Disorders
- Advocacy
- Baselines
- Biofeedback
- Bullying and Teasing
- Caseload
- Compensatory Adaptation and Strategies
- Computer-Aided Rehabilitation
- Context
- Cooperative Learning
- Counseling in Speech–Language Pathology
- Diagnosis of Communication Disorders
- Diagnostic Reasoning
- Discharge From Therapy
- Efficacy and Effectiveness of Treatment Studies
- Ethics in Communication Disorders Research
- Ethics in Communication Disorders Service Delivery
- Evidence-Based Practice
- Feedback in Therapy
- Geriatric Audiology
- Group Therapy
- Inclusion Models in Special Education
- Mediation in Therapy
- Premorbid Level
- Rehabilitation
- Response to Intervention (RtI)
- Screening for Speech and Language Disorders
- Self-Advocacy
- Self-Management
- Service Delivery Models
- Sleep: Effects on Language Learning
- Telepractice
- Speech Sound Disorders
- Accent Modification
- Acoustic Phonetics
- Airflow Measurement
- Anatomy of the Human Articulators
- Articulation (Phonetic) Assessment
- Articulation Therapy (Phonetic Intervention)
- Articulatory Phonetics
- Atypical Speech Sounds
- Auditory Phonetics
- Babbling
- Cascade Effect
- Categorical Perception
- Childhood Apraxia of Speech
- Cleft Lip and Palate: Speech Effects
- Clinical Phonetics
- Clinical Phonology
- Coarticulation
- Comprehensibility
- Connected Speech
- Consonant Clusters
- Consonants
- Covert Contrast
- Craniofacial Anomalies
- Delayed Phonological Development
- Dialects and Dialectology
- Glossectomy
- Instrumental Assessment of Speech Sound Disorders
- Intelligibility
- Intelligibility Enhancement
- Intonation
- Lenition and Fortition
- Linear Phonology
- Markedness
- Metaphonology
- Multilingualism and Speech Sound Disorders
- Neurophonetics
- Nonlinear Phonology
- Nonpulmonic Consonants
- Optimality Theory
- Orofacial Myofunctional Disorders
- Phoneme
- Phonetic Transcription
- Phonetics
- Phonological and Phonemic Awareness
- Phonological Development
- Phonological Disorders
- Phonological Processes
- Phonological Treatment
- Phonology
- Prompts
- Prosodic Disorders
- Prosody
- Pulmonic Ingressive Speech
- Residual Speech Sound Errors
- Segmentation of Speech
- Self-Assessment of Speech Disorders
- Self-Correction
- Sonority
- Sound Spectrography
- Speech Mechanism Examination
- Speech Naturalness
- Speech Perception, Theories of
- Speech Production, Theories of
- Speech Sampling
- Speech Sound Development and Disorders in Multilinguals
- Speech Sound Disorders
- Speech Synthesis
- Stimulability
- Suprasegmental Aspects of Speech
- Syllable
- Tongue Thrust
- Ultrasonography
- Variable Speech Production
- Vocoding Techniques
- Vowels
- X-radiography
- Swallowing and Dysphagia
- Anatomy of the Human Larynx
- Aspiration: Swallowing
- Compensatory Strategies: Swallowing
- Endoscopy
- Fiberoptic Endoscopic Evaluation of Swallowing (FEES)
- Modified Diet
- Physiological Basis of Swallowing
- Radiation Therapy and Communication Disorders
- Swallowing Assessment
- Swallowing Disorders
- Swallowing Disorders: Prophylactic Therapy
- Swallowing Rehabilitation in Adults
- Thickened Liquids
- Videofluoroscopic Swallow Study
- Theoretical Formulations
- Adaptation Theory
- Behaviorism
- Cognitivism
- Connectionist Models
- Constructivism
- Cooperative Principle
- Critical Period for Language Acquisition
- Distributed Cognition
- Emergence and Human Communication
- Emergentism
- Functionalism
- Generative Linguistics
- Locus of Control
- Mapping Hypothesis
- Modularity
- Nativism
- Neuroconstructivism
- Optimality Theory
- Origins of Language
- Plasticity of the Brain
- Relevance Theory
- Scientific Realism
- Signal Detection Theory
- Speech Act Theory
- Speech Perception, Theories of
- Speech Production, Theories of
- Statistical Learning
- Theories of Language Acquisition
- Universal Grammar
- Zone of Proximal Development
- Voice and Resonance
- Alaryngeal Voice
- Ambulatory Phonation Monitoring
- Anatomy of the Human Larynx
- Arthritis: Laryngeal Involvement
- Biofeedback
- Breathing Exercises
- Cancer of the Head and Neck
- Cepstral Analysis of Voice
- Chronic Cough
- Cleft Lip and Palate: Speech Effects
- Craniofacial Anomalies
- Dysphonia
- Electroglottography (EGG)/ Electrolaryngography (ELG)
- Electrolarynx
- Electropalatography (EPG)
- Endoscopy
- Esophageal and Tracheoesophageal Speech
- Essential Vocal Tremor
- Frequency Response
- Instrumental Analysis of Speech
- Instrumental Assessment of Voice Disorders
- Irritable Larynx Syndrome
- Jitter and Shimmer
- Laryngeal Disorders: Benign Vocal Fold Pathologies
- Laryngectomy
- Laryngopharyngeal Reflux (LPR)
- Manual Circumlaryngeal Techniques in Voice Disorders
- Medical Management of Voice Disorders
- Motor Speech Disorders
- Muscle Tension Dysphonia (MTD)
- Nasalance and Nasometry
- Nasality
- Occupational-Related Dysphonia
- Orofacial Myofunctional Disorders
- Paradoxical Vocal Cord Dysfunction (PVCD)
- Physiological Basis for Voice
- Pitch
- Prosthetics for Structural Deficits
- Psychiatric Disorders With Communication Disorders
- Psychogenic Voice Disorders
- Psychological Stress and Speech Disorders
- Puberphonia
- Reinnervation of the Larynx
- Relaxation Therapy
- Resonance Disorders
- Semi-occluded Vocal Tract Techniques
- Singing and Performing Voice
- Sound Spectrography
- Speech Mechanism Examination
- Speech Synthesis
- Tissue Engineering
- Tracheostomy
- Transgender Voice and Communication
- Trauma to Speech and Hearing Mechanisms
- Ultrasonography
- Velocardiofacial Syndrome (VCFS)
- Ventilator-Assisted Speech Production
- Vocal Hygiene
- Vocal Production System: Evolution
- Vocal Quality: Perceptual Evaluation
- Vocalization
- Voice Acoustics
- Voice Disorders
- Voice Production: Physics
- Voice Quality
- Voice Therapy
- Voice Therapy for the Professional Singer
- Yawn–Sigh Technique
- Loading...
Get a 30 day FREE TRIAL
-
 Watch videos from a variety of sources bringing classroom topics to life
 -
Read modern, diverse business cases
-
Explore hundreds of books and reference titles

Read next

More like this
Sage Recommends
We found other relevant content for you on other Sage platforms.
Have you created a personal profile? Login or create a profile so that you can save clips, playlists and searches