Entry
Reader's guide
Entries A-Z
Subject index
YULE’S Q
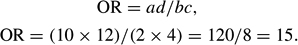
A measure of association used to indicate the strength of relationship between dichotomous variables at nominal or higher level. Yule’s Q is also a function of the odds ratio standardized to fall between – 1 and +1. To obtain Yule’s Q from the odds ratio (OR) (Walsh & Ollenburger, 2001):

Table 1 illustrates using Q with hypothetical social science data. In this example, the independent variable is gender and the dependent variable is political party. A working hypothesis from these data is that males are more likely to be Republicans than are females. Q is calculated from the cell frequencies in Table 1 using the odds ratio in the following manner:
Q is then calculated as follows:

Q is also calculated by finding the difference between concordant (P) and discordant (Q) pairs of data and dividing by the total of the concordant and discordant pairs. Tied pairs of data are excluded from the calculation. The number calculated from this method is the overall percentage of the concordant/discordant pairs and is also equal to the result calculated by the odds ratio method. The concordant/discordant formula for Q (Garson, 2002) is the following:

Data pairs are concordant when moving from the first datum to the second involves a shift in the values of the independent variable and a shift in the values of the dependent variable consistent with the hypothesis being considered. Discordant pairs also involve shifts in value but ones inconsistent with the hypothesis. Tied data pairs share the same value of the dependent variable and are not part of the calculation.
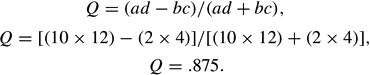
The results from these data indicate that there is a strong association between the variables in the data set. Because the variables in this case are nominal, the sign of .875 is the result of the ordering of the variables. Reversing the order reverses the sign, but the magnitude of association remains the same. Q is a symmetric measure; it makes no difference which variable is chosen as the independent variable.
| Table1 The Relationship of Gender to Choice of Political Party | ||
|---|---|---|
| Male | Female | |
| Republican | a = 10 | b = 2 |
| Democrat | c = 4 | d = 12 |
Q is interpreted as a proportionate reduction of error (PRE); for example, knowing someone’s gender reduces our error in predicting the rank of the dependent variable by 87.5%. In other words, by knowing that a subject is male, one may guess the party affiliation is Republican and have a strong chance of being correct and supporting the working hypothesis. In the event Q equals 0, the relationship is statistically independent, so knowledge of the second variable is not helpful.
There is a note of caution in using Q. It is important to understand the distribution of the data and not rely totally on the measure itself. If any one of the frequency cells is 0, then calculating Q indicates there is a perfect relationship (White, 1999). Calculating Q from Table 2 in the same manner as before,
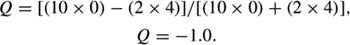
A perfect association of −1.0 is misleading in this particular case with only two female respondents in the data set.
Q is usually reported as gamma because there is a special application of it for 2 × 2 contingency tables. However, the value of Q is usually lower than gamma because dichotomized data contribute to data loss and attenuation of the strength of association.
...
- Analysis of Variance
- Association and Correlation
- Association
- Association Model
- Asymmetric Measures
- Biserial Correlation
- Canonical Correlation Analysis
- Correlation
- Correspondence Analysis
- Intraclass Correlation
- Multiple Correlation
- Part Correlation
- Partial Correlation
- Pearson's Correlation Coefficient
- Semipartial Correlation
- Simple Correlation (Regression)
- Spearman Correlation Coefficient
- Strength of Association
- Symmetric Measures
- Basic Qualitative Research
- Basic Statistics
- F Ratio
- N(n)
- t-Test
- X¯
- Y Variable
- z-Test
- Alternative Hypothesis
- Average
- Bar Graph
- Bell-Shaped Curve
- Bimodal
- Case
- Causal Modeling
- Cell
- Covariance
- Cumulative Frequency Polygon
- Data
- Dependent Variable
- Dispersion
- Exploratory Data Analysis
- Frequency Distribution
- Histogram
- Hypothesis
- Independent Variable
- Measures of Central Tendency
- Median
- Null Hypothesis
- Pie Chart
- Regression
- Standard Deviation
- Statistic
- Causal Modeling
- Discourse/Conversation Analysis
- Econometrics
- Epistemology
- Ethnography
- Evaluation
- Event History Analysis
- Experimental Design
- Factor Analysis and Related Techniques
- Feminist Methodology
- Generalized Linear Models
- Historical/Comparative
- Interviewing in Qualitative Research
- Latent Variable Model
- Life History/Biography
- Log-Linear Models (Categorical Dependent Variables)
- Longitudinal Analysis
- Mathematics and Formal Models
- Measurement Level
- Measurement Testing and Classification
- Multilevel Analysis
- Multiple Regression
- Qualitative Data Analysis
- Sampling in Qualitative Research
- Sampling in Surveys
- Scaling
- Significance Testing
- Simple Regression
- Survey Design
- Time Series
- ARIMA
- Box-Jenkins Modeling
- Cointegration
- Detrending
- Durbin-Watson Statistic
- Error Correction Models
- Forecasting
- Granger Causality
- Interrupted Time-Series Design
- Intervention Analysis
- Lag Structure
- Moving Average
- Periodicity
- Serial Correlation
- Spectral Analysis
- Time-Series Cross-Section (TSCS) Models
- Time-Series Data (Analysis/Design)
- Trend Analysis
- Loading...
Get a 30 day FREE TRIAL
-
 Watch videos from a variety of sources bringing classroom topics to life
 -
Read modern, diverse business cases
-
Explore hundreds of books and reference titles

Read next

More like this
Sage Recommends
We found other relevant content for you on other Sage platforms.
Have you created a personal profile? Login or create a profile so that you can save clips, playlists and searches