Entry
Reader's guide
Entries A-Z
Subject index
Unobserved Heterogeneity
Unobserved heterogeneity refers to latent or hidden characteristics of observations. These characteristics are properties of individuals or subgroups that cannot be measured or are left unmeasured in a study. Ordinarily, individual or group characteristics are incorporated into statistical models as COVARIATES (or INDEPENDENT VARIABLES). When unmeasured characteristics affect the process under investigation, unobserved heterogeneity among observations is said to exist.
For some statistical models, failure to account for heterogeneity among individuals or groups can lead to BIASED PARAMETER ESTIMATES, misinterpretation of results, or SPURIOUS time-covariate interactions. Consequently, statistical techniques have been developed that explicitly incorporate unmeasured heterogeneity as the component of a model. The result is one or more additional parameters that describe how the unmeasured characteristics are distributed in the population from which the sample was drawn.
An Example
Consider the ages at marriage in a rural area of Bangladesh (Figure 1). The heavy line shows the distribution that arises when gender is not considered (or left unmeasured). Suppose a lognormal distribution is believed to be a proper model for age at marriage. Fitting the observations to a lognormal distribution (without reference to sex) yields parameters that give a MEAN age (STANDARD DEVIATION) of 23.3 (5.9) years. Failure to consider gender masks substantial subgroup differences. In fact, a gender-specific analysis yields a mean age of marriage of 27.3 (5.5) years for males and 19.5 (3.4) years for females. The subgroup differences are so large that parameter estimates for any other measured covariate (say, the effect of education on age at marriage) are likely to be BIASED by the lack of information on gender.
Figure 1 Ages at Marriage in Matlab, Bangladesh, in 1985
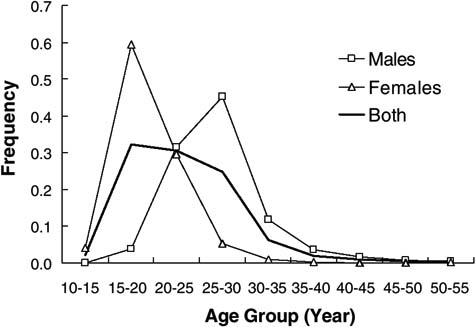
With no information on gender, one solution is to estimate parameters for a finite mixture model. A four-parameter mixture model can be estimated assuming equal numbers of males and females and yields estimates of 25.4 (7.1) years for one subgroup and 21.4 (4.0) years for a second subgroup. The subgroups correspond to males and females, respectively.
“Devious Dynamics” in Hazards Models
Failure to account for unobserved heterogeneity can lead to serious problems of interpretation for survival analysis and related methods that deal with durations to events (hazards models or EVENT HISTORY models). For these models, unobserved heterogeneity refers to unmeasured differences among the units of observation in their risk of “failure” (i.e., risk of experiencing the event under investigation). Ignoring unmeasured heterogeneity in risk of failure leads to a downward bias in risk with time.
Consider mortality risk in infants, which is initially very high and declines rapidly over the first years of life. Taken literally, this observation implies that infants undergo reverse senescence: Individuals “get better” with age. In part, this pattern reflects known biological processes such as maturation of the immune system. On the other hand, the same “infant mortality” pattern is seen for other complex systems such as computers and automobiles—it is less plausible to believe that individual computers experience a decline in risk of failure during early service. The apparent reverse senescence is an artifact of the changing composition of the sample over time, a product of the “devious dynamics of aging cohorts” (Vaupel & Yashin, 1985a, 1985b).
...
- Analysis of Variance
- Association and Correlation
- Association
- Association Model
- Asymmetric Measures
- Biserial Correlation
- Canonical Correlation Analysis
- Correlation
- Correspondence Analysis
- Intraclass Correlation
- Multiple Correlation
- Part Correlation
- Partial Correlation
- Pearson's Correlation Coefficient
- Semipartial Correlation
- Simple Correlation (Regression)
- Spearman Correlation Coefficient
- Strength of Association
- Symmetric Measures
- Basic Qualitative Research
- Basic Statistics
- F Ratio
- N(n)
- t-Test
- X¯
- Y Variable
- z-Test
- Alternative Hypothesis
- Average
- Bar Graph
- Bell-Shaped Curve
- Bimodal
- Case
- Causal Modeling
- Cell
- Covariance
- Cumulative Frequency Polygon
- Data
- Dependent Variable
- Dispersion
- Exploratory Data Analysis
- Frequency Distribution
- Histogram
- Hypothesis
- Independent Variable
- Measures of Central Tendency
- Median
- Null Hypothesis
- Pie Chart
- Regression
- Standard Deviation
- Statistic
- Causal Modeling
- Discourse/Conversation Analysis
- Econometrics
- Epistemology
- Ethnography
- Evaluation
- Event History Analysis
- Experimental Design
- Factor Analysis and Related Techniques
- Feminist Methodology
- Generalized Linear Models
- Historical/Comparative
- Interviewing in Qualitative Research
- Latent Variable Model
- Life History/Biography
- Log-Linear Models (Categorical Dependent Variables)
- Longitudinal Analysis
- Mathematics and Formal Models
- Measurement Level
- Measurement Testing and Classification
- Multilevel Analysis
- Multiple Regression
- Qualitative Data Analysis
- Sampling in Qualitative Research
- Sampling in Surveys
- Scaling
- Significance Testing
- Simple Regression
- Survey Design
- Time Series
- ARIMA
- Box-Jenkins Modeling
- Cointegration
- Detrending
- Durbin-Watson Statistic
- Error Correction Models
- Forecasting
- Granger Causality
- Interrupted Time-Series Design
- Intervention Analysis
- Lag Structure
- Moving Average
- Periodicity
- Serial Correlation
- Spectral Analysis
- Time-Series Cross-Section (TSCS) Models
- Time-Series Data (Analysis/Design)
- Trend Analysis
- Loading...
Get a 30 day FREE TRIAL
-
 Watch videos from a variety of sources bringing classroom topics to life
 -
Read modern, diverse business cases
-
Explore hundreds of books and reference titles

Read next

More like this
Sage Recommends
We found other relevant content for you on other Sage platforms.
Have you created a personal profile? Login or create a profile so that you can save clips, playlists and searches