Entry
Reader's guide
Entries A-Z
Subject index
Unimodal Distribution
This is a DISTRIBUTION of values for a single VARIABLE that only has one mode and a single “peak.” The mode is one of three common measures that are used to determine a variable's “typical score” and is the most frequently occurring value of any given variable (Lewis-Beck, 1995, p. 8).
An example of a unimodal distribution is the standard NORMAL DISTRIBUTION. This distribution has a MEAN of zero and a STANDARD DEVIATION of 1. In this particular case, the mean is equal to the MEDIAN and mode. Moreover, the standard normal distribution only has a single, equal mean, median, and mode. Therefore, it is a unimodal distribution because it only has one mode.
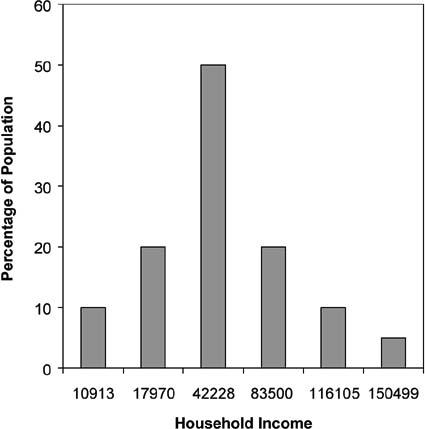
Figure 1 Histogram for Household Income at Selected Percentiles
However, a unimodal distribution does not have to have SYMMETRY like the standard normal distribution. A unimodal distribution can also be SKEWED to the left or right. An example of such a distribution is that of income in the United States.
Figure 1 illustrates the annual income of the U.S. population by different categories (DeNavas-Walt & Cleveland, 2002, p. 20). The MEDIAN income, in which half of the values are greater and half are smaller, falls in the $42,228 category. This figure suggests that the distribution of American household income is somewhat skewed to the left because the median is closer to the bottom 10% (at $10,913) than to the top 10% of all households (at $150,499). Furthermore, the modal category is $42,228. There is a much larger percentage of households (about 50%) in this income category than in the other income categories, indicating the distribution is clearly unimodal.
Regardless of whether a unimodal distribution is skewed or symmetric, it must have a single “peak.” A distribution with a single “peak” is one in which there is a single most frequently occurring value of any given variable, as illustrated by its FREQUENCY DISTRIBUTION. If a distribution has two “peaks,” then it is a BIMODAL DISTRIBUTION. Finally, if a distribution has more than two “peaks,” then it is a MULTIMODAL DISTRIBUTION.
References
- Analysis of Variance
- Association and Correlation
- Association
- Association Model
- Asymmetric Measures
- Biserial Correlation
- Canonical Correlation Analysis
- Correlation
- Correspondence Analysis
- Intraclass Correlation
- Multiple Correlation
- Part Correlation
- Partial Correlation
- Pearson's Correlation Coefficient
- Semipartial Correlation
- Simple Correlation (Regression)
- Spearman Correlation Coefficient
- Strength of Association
- Symmetric Measures
- Basic Qualitative Research
- Basic Statistics
- F Ratio
- N(n)
- t-Test
- X¯
- Y Variable
- z-Test
- Alternative Hypothesis
- Average
- Bar Graph
- Bell-Shaped Curve
- Bimodal
- Case
- Causal Modeling
- Cell
- Covariance
- Cumulative Frequency Polygon
- Data
- Dependent Variable
- Dispersion
- Exploratory Data Analysis
- Frequency Distribution
- Histogram
- Hypothesis
- Independent Variable
- Measures of Central Tendency
- Median
- Null Hypothesis
- Pie Chart
- Regression
- Standard Deviation
- Statistic
- Causal Modeling
- Discourse/Conversation Analysis
- Econometrics
- Epistemology
- Ethnography
- Evaluation
- Event History Analysis
- Experimental Design
- Factor Analysis and Related Techniques
- Feminist Methodology
- Generalized Linear Models
- Historical/Comparative
- Interviewing in Qualitative Research
- Latent Variable Model
- Life History/Biography
- Log-Linear Models (Categorical Dependent Variables)
- Longitudinal Analysis
- Mathematics and Formal Models
- Measurement Level
- Measurement Testing and Classification
- Multilevel Analysis
- Multiple Regression
- Qualitative Data Analysis
- Sampling in Qualitative Research
- Sampling in Surveys
- Scaling
- Significance Testing
- Simple Regression
- Survey Design
- Time Series
- ARIMA
- Box-Jenkins Modeling
- Cointegration
- Detrending
- Durbin-Watson Statistic
- Error Correction Models
- Forecasting
- Granger Causality
- Interrupted Time-Series Design
- Intervention Analysis
- Lag Structure
- Moving Average
- Periodicity
- Serial Correlation
- Spectral Analysis
- Time-Series Cross-Section (TSCS) Models
- Time-Series Data (Analysis/Design)
- Trend Analysis
- Loading...
Get a 30 day FREE TRIAL
-
 Watch videos from a variety of sources bringing classroom topics to life
 -
Read modern, diverse business cases
-
Explore hundreds of books and reference titles

Read next

More like this
Sage Recommends
We found other relevant content for you on other Sage platforms.
Have you created a personal profile? Login or create a profile so that you can save clips, playlists and searches