Entry
Reader's guide
Entries A-Z
Subject index
Transition Rate
A transition rate, also known as a “transition intensity” and as an “instantaneous rate of transition,” is a concept that primarily arises when researchers want to distinguish COMPETING RISKS while conducting SURVIVAL ANALYSIS or EVENT HISTORY ANALYSIS. Interest in differentiating among competing risks originally came about in studies of the causes of death and failure. Not surprisingly, equivalent older names for a transition rate are the “cause-specific force of mortality (failure)” and the “cause-specific mortality (failure) rate.” Because the mathematical definition of a transition rate is closely related to the definition of a HAZARD RATE, some authors do not distinguish between the two terms.
Formally, a transition rate to a certain destination state k from a given origin state j at a particular time t is defined as
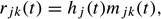
where hj(t) is the hazard rate of any transition from state j at time t and mjk(t) is the conditional probability that the transition (i.e., the event) consists of a change or move from state j to state k at time t. Like a hazard rate, a transition rate is measured as the inverse of time (e.g., per month or per year). Also like a hazard rate, a transition rate cannot be negative, but it may exceed one.
To give a few examples, if j denotes being married, k signifies being divorced, and time t refers to a person's age in years, then rjk(t) would indicate the instantaneous rate per year at which a currently married person who is age t becomes divorced. As another example, if j denotes being unemployed, k represents having a job as a skilled worker, and t indicates the duration of a person's unemployment in months, then rjk(t) would stand for the instantaneous rate per month at which a person who has been unemployed for a length of time t enters a job as a skilled worker.
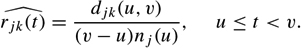
ESTIMATION of a transition rate involves relatively minor modifications of the formulas for estimating the hazard rate of the occurrence of any event. A traditional demographic estimator of the transition rate associated with a specified discrete time interval [u, v) is called the life table or actuarial ESTIMATOR; it is defined as

where djk(u, v) is the number of transitions from j to k in the interval [u, v); nj(u) is the number that have survived in state j until time u; and cj (u, v) is the number in state j at time u who are censored on the right before time v. The multiplier of one-half in the denominator on the right-hand side of this equation comes from assuming that the transitions and censored observations are spread uniformly over the interval [u, v). A common, modern estimator is based on the Nelson-Aalen estimator of the integrated hazard rate:
For a mathematical introduction to these and other estimators of a transition rate, see Cox and Oakes (1984, Chap. 9). For a longer and less technical discussion addressed to social scientists, see Tuma and Hannan (1984, Chap. 3).
Typically, transition rates are modeled using a variant of a proportional hazard rate model (see Tuma & Hannan, 1984, Chaps.
...
- Analysis of Variance
- Association and Correlation
- Association
- Association Model
- Asymmetric Measures
- Biserial Correlation
- Canonical Correlation Analysis
- Correlation
- Correspondence Analysis
- Intraclass Correlation
- Multiple Correlation
- Part Correlation
- Partial Correlation
- Pearson's Correlation Coefficient
- Semipartial Correlation
- Simple Correlation (Regression)
- Spearman Correlation Coefficient
- Strength of Association
- Symmetric Measures
- Basic Qualitative Research
- Basic Statistics
- F Ratio
- N(n)
- t-Test
- X¯
- Y Variable
- z-Test
- Alternative Hypothesis
- Average
- Bar Graph
- Bell-Shaped Curve
- Bimodal
- Case
- Causal Modeling
- Cell
- Covariance
- Cumulative Frequency Polygon
- Data
- Dependent Variable
- Dispersion
- Exploratory Data Analysis
- Frequency Distribution
- Histogram
- Hypothesis
- Independent Variable
- Measures of Central Tendency
- Median
- Null Hypothesis
- Pie Chart
- Regression
- Standard Deviation
- Statistic
- Causal Modeling
- Discourse/Conversation Analysis
- Econometrics
- Epistemology
- Ethnography
- Evaluation
- Event History Analysis
- Experimental Design
- Factor Analysis and Related Techniques
- Feminist Methodology
- Generalized Linear Models
- Historical/Comparative
- Interviewing in Qualitative Research
- Latent Variable Model
- Life History/Biography
- Log-Linear Models (Categorical Dependent Variables)
- Longitudinal Analysis
- Mathematics and Formal Models
- Measurement Level
- Measurement Testing and Classification
- Multilevel Analysis
- Multiple Regression
- Qualitative Data Analysis
- Sampling in Qualitative Research
- Sampling in Surveys
- Scaling
- Significance Testing
- Simple Regression
- Survey Design
- Time Series
- ARIMA
- Box-Jenkins Modeling
- Cointegration
- Detrending
- Durbin-Watson Statistic
- Error Correction Models
- Forecasting
- Granger Causality
- Interrupted Time-Series Design
- Intervention Analysis
- Lag Structure
- Moving Average
- Periodicity
- Serial Correlation
- Spectral Analysis
- Time-Series Cross-Section (TSCS) Models
- Time-Series Data (Analysis/Design)
- Trend Analysis
- Loading...
Get a 30 day FREE TRIAL
-
 Watch videos from a variety of sources bringing classroom topics to life
 -
Read modern, diverse business cases
-
Explore hundreds of books and reference titles

Read next

More like this
Sage Recommends
We found other relevant content for you on other Sage platforms.
Have you created a personal profile? Login or create a profile so that you can save clips, playlists and searches