Entry
Reader's guide
Entries A-Z
Subject index
Time-Series Cross-Section (Tscs) Models
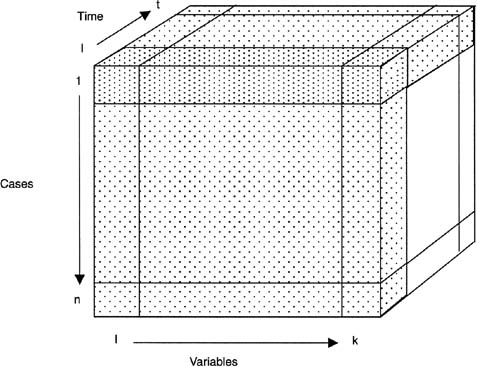
TSCS models aim to detect the causal processes underlying TSCS data (often called PANEL data). One can represent such data as a three-dimensional “data cube” in which cases, variables, and time points are the dimensions (see Figure 1). TSCS data sets contain more information than either (a) CROSS-SECTIONAL DATA sets comprising data on variables for cases at a single time (e.g., the front slice of the cube in Figure 1), or (b) time-series data sets comprising data on variables at times for a single case (e.g., the top slice of the cube in Figure 1).
Researchers sometimes compile TSCS data sets because a target population has a small number of cases. For example, any crosssectional study of European nation states will be limited by the fact that it will have fewer than 30 cases, severely restricting one's ability to carry out multivariate statistical analyses. By collecting data for those cases at several time points rather than just one, a researcher may be able to obtain enough additional observations to facilitate better analyses.
TSCS data sets are also attractive because of their analytic potential. For example, using TSCS data, one may be able to assess whether an independent variable's effect on a dependent variable changes over time (not possible with cross-sectional data), or whether an independent variable's effect differs across cases (not possible with simple time-series data). Finally, researchers frequently use TSCS data in order to control for case-stable unmeasured variables, an important type of unmeasured HETEROGENEITY, in multivariate analyses.
The analytic flexibility that TSCS data affords is not unlimited, however. To gain an advantage from pooling time-series and cross-sectional data, there must be reason to assume some kind of invariance in the effects, including nonlinear and nonadditive effects, of the independent variables. These effects need to be constant across cases, across time, or both (in practice, most researchers assume both kinds of invariance). In addition, in TSCS analyses, both HETEROSKEDASTICITY, primarily seen as a potential problem for cross-sectional STATISTICAL INFERENCE, and AUTOCORRELATION, primarily seen as a potential problem for time-series statistical inference, are possible threats to statistical inference.
Large-N, Small-T TSCS Models
Given the many analytic opportunities afforded by TSCS data, there are many possible TSCS models. Two general classes of models exist, however, corresponding to whether the number of cases (n) substantially exceeds the number of time points (t), or vice versa. Large n panel studies, such as the National Longitudinal Study of Youth and the Panel Study of Income Dynamics in the United States, have thousands of cases and relatively few (i.e., < 15) time points. Studies using such data typically view unmeasured heterogeneity among the cases as the most important potential source of estimator bias and inconsistency, and address this problem using either fixed effects (FE) or random effects (RE) estimation procedures. Both sets of estimation procedures stem from the analytic model:
Figure 1 A Data Cube Representation of a Time Series Cross-Section Data Set
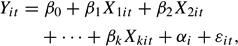
where i indexes cases, t indexes times, and numerical subscripts index the measured independent variables (X), with β0 standing for the equation's intercept term. As usual, ∊it represents a DISTURBANCE TERM with a mean of zero, constant VARIANCE, and no ASSOCIATION with the independent variables in the equation. The αi represent the effects of unmeasured variables that are stable across time for each case, but vary across cases. In studies where individuals are cases, for example, this term would represent stable but unmeasured variables, such as innate ability or physical attractiveness, that affect cases' values on the dependent variable.
...
- Analysis of Variance
- Association and Correlation
- Association
- Association Model
- Asymmetric Measures
- Biserial Correlation
- Canonical Correlation Analysis
- Correlation
- Correspondence Analysis
- Intraclass Correlation
- Multiple Correlation
- Part Correlation
- Partial Correlation
- Pearson's Correlation Coefficient
- Semipartial Correlation
- Simple Correlation (Regression)
- Spearman Correlation Coefficient
- Strength of Association
- Symmetric Measures
- Basic Qualitative Research
- Basic Statistics
- F Ratio
- N(n)
- t-Test
- X¯
- Y Variable
- z-Test
- Alternative Hypothesis
- Average
- Bar Graph
- Bell-Shaped Curve
- Bimodal
- Case
- Causal Modeling
- Cell
- Covariance
- Cumulative Frequency Polygon
- Data
- Dependent Variable
- Dispersion
- Exploratory Data Analysis
- Frequency Distribution
- Histogram
- Hypothesis
- Independent Variable
- Measures of Central Tendency
- Median
- Null Hypothesis
- Pie Chart
- Regression
- Standard Deviation
- Statistic
- Causal Modeling
- Discourse/Conversation Analysis
- Econometrics
- Epistemology
- Ethnography
- Evaluation
- Event History Analysis
- Experimental Design
- Factor Analysis and Related Techniques
- Feminist Methodology
- Generalized Linear Models
- Historical/Comparative
- Interviewing in Qualitative Research
- Latent Variable Model
- Life History/Biography
- Log-Linear Models (Categorical Dependent Variables)
- Longitudinal Analysis
- Mathematics and Formal Models
- Measurement Level
- Measurement Testing and Classification
- Multilevel Analysis
- Multiple Regression
- Qualitative Data Analysis
- Sampling in Qualitative Research
- Sampling in Surveys
- Scaling
- Significance Testing
- Simple Regression
- Survey Design
- Time Series
- ARIMA
- Box-Jenkins Modeling
- Cointegration
- Detrending
- Durbin-Watson Statistic
- Error Correction Models
- Forecasting
- Granger Causality
- Interrupted Time-Series Design
- Intervention Analysis
- Lag Structure
- Moving Average
- Periodicity
- Serial Correlation
- Spectral Analysis
- Time-Series Cross-Section (TSCS) Models
- Time-Series Data (Analysis/Design)
- Trend Analysis
- Loading...
Get a 30 day FREE TRIAL
-
 Watch videos from a variety of sources bringing classroom topics to life
 -
Read modern, diverse business cases
-
Explore hundreds of books and reference titles

Read next

More like this
Sage Recommends
We found other relevant content for you on other Sage platforms.
Have you created a personal profile? Login or create a profile so that you can save clips, playlists and searches