Entry
Reader's guide
Entries A-Z
Subject index
Symmetric Measures
Symmetric measures of ASSOCIATION describe the relationship between two variables X and Y without differentiating if either variable is an antecedent (or independent variable) or a consequent (or dependent variable). Examples of symmetric measures include PEARSON CORRELATION COEFFICIENT, SPEARMAN CORRELATION, Goodman and Kruskal's GAMMA COEFFICIENT, and point biserial correlation coefficient, in addition to the five measures to be presented below.
PHI Coefficient
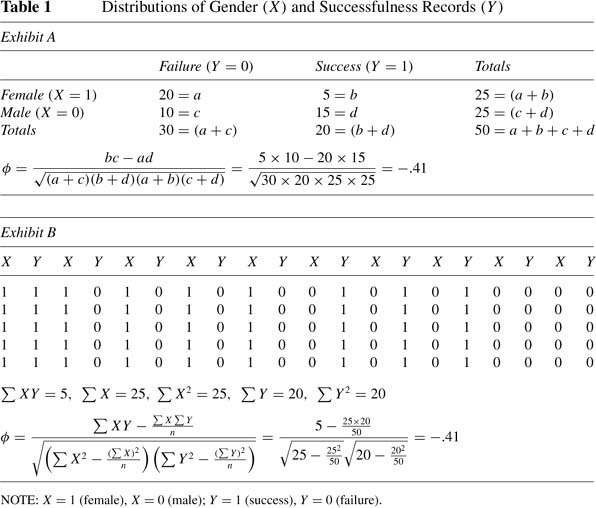
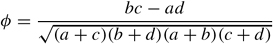
Phi coefficient (φ) is a special case of the Pearson correlation coefficient. When both variables, X and Y, are naturally dichotomous (e.g., male/female, success/failure, survival/death), the Pearson correlation is conventionally labeled as the phi coefficient. Because of its direct relationship with the Pearson correlation coefficient, the null hypothesis test and computation formula for the Pearson correlation coefficient can be applied to the phi coefficient.
Given the dichotomous nature of both variables (e.g., gender and successfulness), the distribution of gender and successfulness can be arranged in a table with four cells, often referred to as a CONTINGENCY TABLE, as shown in Exhibit A of Table 1. As seen, there are 20 successful females, 5 females who fail, 10 successful males, and 15 males who fail. Based on a simplified Pearson correlation formula,
[assuming (a + c)(b + d)(a + b)(c + d) =/ 0], the correlation between gender (X) and successfulness (Y) is –.41, if females are coded as 1 and males are coded as 0 for variable X, and success is coded as 1 and failure is coded as 0 for variable Y. Alphabetical letters a, b, c, and d represent the frequencies in each cell of the contingency table. We can also calculate the phi coefficient based on the conventional Pearson correlation formula. As demonstrated in Exhibit B of Table 1, the correlation between gender and successfulness is –.41. This negative correlation suggests that the higher the “gender” (from 0 to 1), the lower the “successfulness” (from 1 to 0). In other words, fewer females succeed than do males.
Tetrachoric Correlation
If the phi coefficient is calculated based on two artificially dichotomized variables, actually CONTINUOUS VARIABLES with bivariate NORMAL DISTRIBUTIONS, the phi coefficient will underestimate the relationship between the variables. To estimate what the actual relationship would be if both variables were not artificially dichotomized, we could apply the tetrachoric correlation formula. For example, two variables, sleep(X) and school performance (Y), are artificially dichotomized so that sleep is classified as either short sleep (if a person sleeps less than 7 hours) or long sleep (if a person sleeps equal to or more than 7 hours), and school performance is classified as either poor (if a grade point average is lower than 2.5) or good (if a grade point average is equal to or greater than 2.5). The frequencies for these two variables are summarized in the contingency table depicted in Table 2.
| Table 2 Distributions of Sleep (X) and School Performance (Y) | |||
|---|---|---|---|
| Poor Performance (Y=0) | Good Performance (Y=1) | Totals | |
| Long Sleep (X = 1) | 60 = a | 40 = b | 100 = (a + b) |
| Short Sleep (X = 0) | 40 = c | 60 = d | 100 = (c + d) |
| Totals | 100 = (a + c) | 100 = (b + d) | 200 = a + b + c + d |
The tetrachoric correlation formula is defined
...
- Analysis of Variance
- Association and Correlation
- Association
- Association Model
- Asymmetric Measures
- Biserial Correlation
- Canonical Correlation Analysis
- Correlation
- Correspondence Analysis
- Intraclass Correlation
- Multiple Correlation
- Part Correlation
- Partial Correlation
- Pearson's Correlation Coefficient
- Semipartial Correlation
- Simple Correlation (Regression)
- Spearman Correlation Coefficient
- Strength of Association
- Symmetric Measures
- Basic Qualitative Research
- Basic Statistics
- F Ratio
- N(n)
- t-Test
- X¯
- Y Variable
- z-Test
- Alternative Hypothesis
- Average
- Bar Graph
- Bell-Shaped Curve
- Bimodal
- Case
- Causal Modeling
- Cell
- Covariance
- Cumulative Frequency Polygon
- Data
- Dependent Variable
- Dispersion
- Exploratory Data Analysis
- Frequency Distribution
- Histogram
- Hypothesis
- Independent Variable
- Measures of Central Tendency
- Median
- Null Hypothesis
- Pie Chart
- Regression
- Standard Deviation
- Statistic
- Causal Modeling
- Discourse/Conversation Analysis
- Econometrics
- Epistemology
- Ethnography
- Evaluation
- Event History Analysis
- Experimental Design
- Factor Analysis and Related Techniques
- Feminist Methodology
- Generalized Linear Models
- Historical/Comparative
- Interviewing in Qualitative Research
- Latent Variable Model
- Life History/Biography
- Log-Linear Models (Categorical Dependent Variables)
- Longitudinal Analysis
- Mathematics and Formal Models
- Measurement Level
- Measurement Testing and Classification
- Multilevel Analysis
- Multiple Regression
- Qualitative Data Analysis
- Sampling in Qualitative Research
- Sampling in Surveys
- Scaling
- Significance Testing
- Simple Regression
- Survey Design
- Time Series
- ARIMA
- Box-Jenkins Modeling
- Cointegration
- Detrending
- Durbin-Watson Statistic
- Error Correction Models
- Forecasting
- Granger Causality
- Interrupted Time-Series Design
- Intervention Analysis
- Lag Structure
- Moving Average
- Periodicity
- Serial Correlation
- Spectral Analysis
- Time-Series Cross-Section (TSCS) Models
- Time-Series Data (Analysis/Design)
- Trend Analysis
- Loading...
Get a 30 day FREE TRIAL
-
 Watch videos from a variety of sources bringing classroom topics to life
 -
Read modern, diverse business cases
-
Explore hundreds of books and reference titles

Read next

More like this
Sage Recommends
We found other relevant content for you on other Sage platforms.
Have you created a personal profile? Login or create a profile so that you can save clips, playlists and searches