Entry
Reader's guide
Entries A-Z
Subject index
Spearman-Brown Formula
Developed independently by Charles Spearman (1910) and William Brown (1910), this formula estimates the reliability of multi-item measures or indexes, and provides an important foundation for the statistical theory of measurement. The Spearman-Brown formula also calculates expected increases in reliability if more indicators of the same trait are available. In both capacities, the Spearman-Brown formula is used frequently in the social sciences, especially in sociology, psychology, and education, where multi-item indexes are commonly employed.
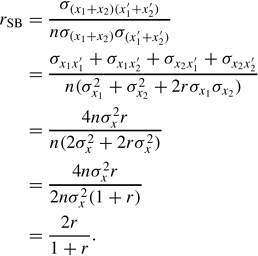
To illustrate, following Brown (1910), let x1 and x2 be two measurements of a particular characteristic x, together comprising a “test” in which x1 and x2 are given equal weight. x′1 and x′2 are two other measurements of the same trait and, in combination, provide a parallel test of characteristic x. Suppose that all of the measurements are equally reliable, or that

where σx1 is the standard deviation of x1, and that their relationships to each other are comparable,

where σx1x′1 is the covariance of x1 and x′1, r is a measure of reliability of each test, and n is the number of tests (in this case, n = 2). In practice, as Nunnally and Bernstein (1994) suggest, r might be the average correlation across the group of observed measures (in this example, between x1 and x2) comprising a test. Then, the reliability of the indicator is estimated using an adjusted correlation coefficient, following Brown (1910):
More generally, the Spearman-Brown coefficient may be calculated
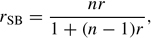
where, as above, r is a measure of reliability (or average correlation among parallel tests) and n is the number of parallel tests.
To demonstrate, consider the following example: William H. Sewell (1942) was interested in developing a measure of the socioeconomic status of farm families. From an initial list of 123 items, Sewell constructed an index of 36 indicators he believed to measure a family's status. Then, dividing the items according to their numbering (even and odd) to construct two “halftests,” Sewell estimated the correlation between them to be 0.83. Using the Spearman-Brown formula, Sewell adjusted this estimate of the correlation between the half-tests to generate an estimate of the reliability of his measure that takes the full test length into account:
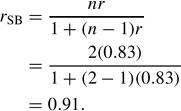
Because the Spearman-Brown coefficient is bounded by 0 and 1, where 1 indicates the highest possible level of reliability, Sewell was well satisfied by this result. If, however, Sewell was interested in increasing the reliability of his measure, the Spearman-Brown formula predicts gains in reliability that result from doubling the number of indicators, such that each half-test would now comprise one of four parallel tests (provided the original assumptions hold):

Similarly, the Spearman-Brown “prophecy” formula can be used to estimate the number of indicators needed to achieve a desired level of reliability in a measure.
Analysts should note two assumptions made in the derivation of the Spearman-Brown formula: First, the expected values and variances of each measure are assumed to be equal across measures. Second, as stated above, covariances among all pairs of measures are assumed to be equivalent. In other words, the measures, on average, should generate the same mean scores, should be equally precise, and should be equally related to each other. These assumptions, describing “classical parallelism” or an “exchangeable covariance structure” (Li, Rosenthal, & Rubin, 1996), are important because they allow analysts to estimate the reliability of an index with an adjusted measure of the correlation among its components. It seems, however, that these conditions rarely occur in the social sciences. Recognizing this, some researchers have provided generalized versions of the Spearman-Brown formula that readily incorporate measures with different levels of precision: In particular, Lee Cronbach, and G. Frederick Kuder and Marion Richardson, have built upon the important foundation laid by Spearman and Brown in the statistical theory of measurement; see Cronbach's alpha in this volume.
...
- Analysis of Variance
- Association and Correlation
- Association
- Association Model
- Asymmetric Measures
- Biserial Correlation
- Canonical Correlation Analysis
- Correlation
- Correspondence Analysis
- Intraclass Correlation
- Multiple Correlation
- Part Correlation
- Partial Correlation
- Pearson's Correlation Coefficient
- Semipartial Correlation
- Simple Correlation (Regression)
- Spearman Correlation Coefficient
- Strength of Association
- Symmetric Measures
- Basic Qualitative Research
- Basic Statistics
- F Ratio
- N(n)
- t-Test
- X¯
- Y Variable
- z-Test
- Alternative Hypothesis
- Average
- Bar Graph
- Bell-Shaped Curve
- Bimodal
- Case
- Causal Modeling
- Cell
- Covariance
- Cumulative Frequency Polygon
- Data
- Dependent Variable
- Dispersion
- Exploratory Data Analysis
- Frequency Distribution
- Histogram
- Hypothesis
- Independent Variable
- Measures of Central Tendency
- Median
- Null Hypothesis
- Pie Chart
- Regression
- Standard Deviation
- Statistic
- Causal Modeling
- Discourse/Conversation Analysis
- Econometrics
- Epistemology
- Ethnography
- Evaluation
- Event History Analysis
- Experimental Design
- Factor Analysis and Related Techniques
- Feminist Methodology
- Generalized Linear Models
- Historical/Comparative
- Interviewing in Qualitative Research
- Latent Variable Model
- Life History/Biography
- Log-Linear Models (Categorical Dependent Variables)
- Longitudinal Analysis
- Mathematics and Formal Models
- Measurement Level
- Measurement Testing and Classification
- Multilevel Analysis
- Multiple Regression
- Qualitative Data Analysis
- Sampling in Qualitative Research
- Sampling in Surveys
- Scaling
- Significance Testing
- Simple Regression
- Survey Design
- Time Series
- ARIMA
- Box-Jenkins Modeling
- Cointegration
- Detrending
- Durbin-Watson Statistic
- Error Correction Models
- Forecasting
- Granger Causality
- Interrupted Time-Series Design
- Intervention Analysis
- Lag Structure
- Moving Average
- Periodicity
- Serial Correlation
- Spectral Analysis
- Time-Series Cross-Section (TSCS) Models
- Time-Series Data (Analysis/Design)
- Trend Analysis
- Loading...
Get a 30 day FREE TRIAL
-
 Watch videos from a variety of sources bringing classroom topics to life
 -
Read modern, diverse business cases
-
Explore hundreds of books and reference titles

Read next

More like this
Sage Recommends
We found other relevant content for you on other Sage platforms.
Have you created a personal profile? Login or create a profile so that you can save clips, playlists and searches