Entry
Reader's guide
Entries A-Z
Subject index
Semipartial Correlation
A semipartial correlation is a statistic measuring the relationship between a dependent variable (or criterion) with an adjusted independent variable (or predictor) controlling for the effect of other predictors in the analysis. Like partial correlation, the semipartial correlation is computed in the process of multiple regression analysis.
Figure 1 Diagrams Illustrating Conceptual Differences Between Semipartial, Partial, and Pearson's Correlations
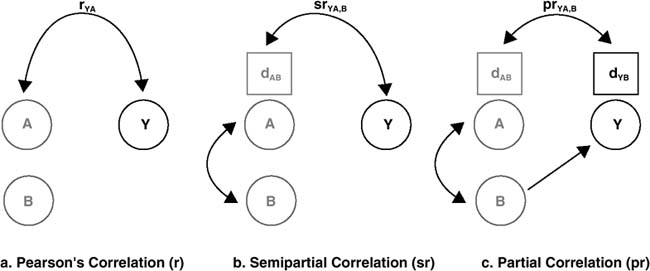
The diagrams illustrate how the semipartial correlation differs conceptually from both partial and Pearson's correlations. Grey circles (As and Bs) in the diagrams represent predictor variables, whereas the black circles, Y s, represent criterion variables. Boxes represent residuals of As and Y s after subtracting the effects that the Bs exert on them. Curved arrows represent correlation (or covariance) between pairs of variables in the diagrams, whereas the straight arrow represents a regression path connecting B to Y.
In Figure 1a, the curved arrow rYA represents a zero-order Pearson's correlation coefficient, which measures the extent to which A and Y are correlated with each other, not taking into account the effect of the third variable B. In Figure 1b, the curved arrow srYA,B represents a semipartial correlation coefficient. It measures the extent to which the criterion, Y, and the residual of A (i.e., dA,B), obtained by subtracting from A its covariance with B, are correlated with each other. In Figure 1c, the curved arrow prYA,B represents a partial correlation coefficient. It measures the extent to which the residual of Y (i.e., dY,B) and the residual of A (i.e., dA,B) are correlated with each other.
Illustratively, in a multiple regression analysis in which Y is the criterion variable that is predicted by A and B (two predictors), both the semipartial correlation and the partial correlation obtained from A and B would be related to specific (or unique) contributions of A and B, respectively. In particular, the squared semipartial correlation for A is the proportion of the total variance of Y uniquely accounted for by A, after removing the shared variance between A and B from A but not from Y. Alternatively, the squared partial correlation for A is the proportion of the residual variance of Y uniquely accounted for by A after removing the effect of B on both A and Y.
Both the partial and semipartial correlations for any given pair of variables can be calculated on the basis of the zero-order Pearson's correlation between a pair of variables according to the following algebraic rules:
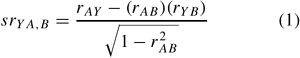
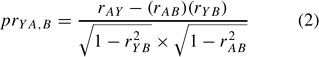
Comparing equations (1) and (2), the computation of a semipartial correlation (i.e., srYA,B) differs from that of a partial correlation (i.e., prYA,B) in the composition of their denominators. The partial correlation equation has a smaller denominator than does the semipartial correlation equation (i.e., for the partial correlation, the denominator is a product of two terms each smaller than 1.00, whereas the semipartial correlation includes only one of those terms). These differences make a semipartial correlation always lower than a partial correlation, except for the cases where A and B are independent or uncorrelated.
References
...
- Analysis of Variance
- Association and Correlation
- Association
- Association Model
- Asymmetric Measures
- Biserial Correlation
- Canonical Correlation Analysis
- Correlation
- Correspondence Analysis
- Intraclass Correlation
- Multiple Correlation
- Part Correlation
- Partial Correlation
- Pearson's Correlation Coefficient
- Semipartial Correlation
- Simple Correlation (Regression)
- Spearman Correlation Coefficient
- Strength of Association
- Symmetric Measures
- Basic Qualitative Research
- Basic Statistics
- F Ratio
- N(n)
- t-Test
- X¯
- Y Variable
- z-Test
- Alternative Hypothesis
- Average
- Bar Graph
- Bell-Shaped Curve
- Bimodal
- Case
- Causal Modeling
- Cell
- Covariance
- Cumulative Frequency Polygon
- Data
- Dependent Variable
- Dispersion
- Exploratory Data Analysis
- Frequency Distribution
- Histogram
- Hypothesis
- Independent Variable
- Measures of Central Tendency
- Median
- Null Hypothesis
- Pie Chart
- Regression
- Standard Deviation
- Statistic
- Causal Modeling
- Discourse/Conversation Analysis
- Econometrics
- Epistemology
- Ethnography
- Evaluation
- Event History Analysis
- Experimental Design
- Factor Analysis and Related Techniques
- Feminist Methodology
- Generalized Linear Models
- Historical/Comparative
- Interviewing in Qualitative Research
- Latent Variable Model
- Life History/Biography
- Log-Linear Models (Categorical Dependent Variables)
- Longitudinal Analysis
- Mathematics and Formal Models
- Measurement Level
- Measurement Testing and Classification
- Multilevel Analysis
- Multiple Regression
- Qualitative Data Analysis
- Sampling in Qualitative Research
- Sampling in Surveys
- Scaling
- Significance Testing
- Simple Regression
- Survey Design
- Time Series
- ARIMA
- Box-Jenkins Modeling
- Cointegration
- Detrending
- Durbin-Watson Statistic
- Error Correction Models
- Forecasting
- Granger Causality
- Interrupted Time-Series Design
- Intervention Analysis
- Lag Structure
- Moving Average
- Periodicity
- Serial Correlation
- Spectral Analysis
- Time-Series Cross-Section (TSCS) Models
- Time-Series Data (Analysis/Design)
- Trend Analysis
- Loading...
Get a 30 day FREE TRIAL
-
 Watch videos from a variety of sources bringing classroom topics to life
 -
Read modern, diverse business cases
-
Explore hundreds of books and reference titles

Read next

More like this
Sage Recommends
We found other relevant content for you on other Sage platforms.
Have you created a personal profile? Login or create a profile so that you can save clips, playlists and searches