Entry
Reader's guide
Entries A-Z
Subject index
Poisson Regression
A Poisson regression is a regression model in which a dependent variable that consists of counts is modeled with a Poisson distribution. Countdependent variables, which can take on only nonnegative integer values, appear in many social science contexts. For example, a sociologist might be interested in studying the factors that affect the number of times that an individual commits criminal behaviors. In this case, each individual in a data set would be associated with a number that specifies how many criminal behaviors he or she committed in a given time frame. Individuals who committed no such behaviors would receive a count value of 0, individuals who committed one crime would receive a count value of 1, and so forth. The sociologist in question could use a Poisson regression to determine which of a set of specified independent variables (e.g., an individual's level of educational attainment) has a significant relationship with an individual's criminal activity as measured by counts of criminal acts.
Poisson regressions are, as noted above, based on the Poisson distribution. This one-parameter univariate distribution has positive support over the nonnegative integers, and hence it is appropriate to use such a distribution when studying a dependent variable that consists of counts.
Model Specification
The model specification for a Poisson regression is based on assuming that a count-dependent variable yihas, conditional on a vector of independent variables xi, a Poisson distribution independent across other observations i with mean μi and the following probability distribution function:
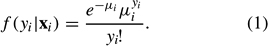
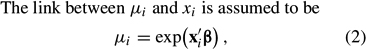
where β is a parameter vector (with the same dimension as xi) to be estimated. Note that the exponential link function between μi and xi ensures that μi is strictly positive; this is essential because the mean of the Poisson distribution cannot be nonpositive. Based on a set of n observations (yi, xi), equations (1) and (2) together generate a log-likelihood function of
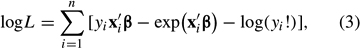
where log (·) denotes natural logarithm. The first-order conditions from this log-likelihood function—there is one such condition per each element of β—are nonlinear in β and cannot be solved in closed form. Therefore, numerical methods must be used to solve for the value of β^ that maximizes equation (3).
Interpretation of Poisson regression output is similar to interpretation of other nonlinear regression models. If a given element of β^ is positive, then it follows that increases in the corresponding element of xi are associated with relatively large count values in yi. However, comparative statics in a Poisson regression model are complicated by the fact that the derivative of μi with respect to an element of xi in equation (2) depends on all the elements of xi (cross-partial derivatives of μiwith respect to different elements of xi are not zero, as they are in an ordinary least squares regression). Hence, with a vector estimate β^, one can vary an element of xi and, substituting β^ for β in equation (2), generate a sequence of estimated μi values based on a modified xi vector. It is then straightforward to generate a probability distribution over the nonnegative integers—an estimated distribution for yi—using the link function in equation (2). This distribution, it is important to point out, will be conditional on the elements of xi that are not varied.
...
- Analysis of Variance
- Association and Correlation
- Association
- Association Model
- Asymmetric Measures
- Biserial Correlation
- Canonical Correlation Analysis
- Correlation
- Correspondence Analysis
- Intraclass Correlation
- Multiple Correlation
- Part Correlation
- Partial Correlation
- Pearson's Correlation Coefficient
- Semipartial Correlation
- Simple Correlation (Regression)
- Spearman Correlation Coefficient
- Strength of Association
- Symmetric Measures
- Basic Qualitative Research
- Basic Statistics
- F Ratio
- N(n)
- t-Test
- X¯
- Y Variable
- z-Test
- Alternative Hypothesis
- Average
- Bar Graph
- Bell-Shaped Curve
- Bimodal
- Case
- Causal Modeling
- Cell
- Covariance
- Cumulative Frequency Polygon
- Data
- Dependent Variable
- Dispersion
- Exploratory Data Analysis
- Frequency Distribution
- Histogram
- Hypothesis
- Independent Variable
- Measures of Central Tendency
- Median
- Null Hypothesis
- Pie Chart
- Regression
- Standard Deviation
- Statistic
- Causal Modeling
- Discourse/Conversation Analysis
- Econometrics
- Epistemology
- Ethnography
- Evaluation
- Event History Analysis
- Experimental Design
- Factor Analysis and Related Techniques
- Feminist Methodology
- Generalized Linear Models
- Historical/Comparative
- Interviewing in Qualitative Research
- Latent Variable Model
- Life History/Biography
- Log-Linear Models (Categorical Dependent Variables)
- Longitudinal Analysis
- Mathematics and Formal Models
- Measurement Level
- Measurement Testing and Classification
- Multilevel Analysis
- Multiple Regression
- Qualitative Data Analysis
- Sampling in Qualitative Research
- Sampling in Surveys
- Scaling
- Significance Testing
- Simple Regression
- Survey Design
- Time Series
- ARIMA
- Box-Jenkins Modeling
- Cointegration
- Detrending
- Durbin-Watson Statistic
- Error Correction Models
- Forecasting
- Granger Causality
- Interrupted Time-Series Design
- Intervention Analysis
- Lag Structure
- Moving Average
- Periodicity
- Serial Correlation
- Spectral Analysis
- Time-Series Cross-Section (TSCS) Models
- Time-Series Data (Analysis/Design)
- Trend Analysis
- Loading...
Get a 30 day FREE TRIAL
-
 Watch videos from a variety of sources bringing classroom topics to life
 -
Read modern, diverse business cases
-
Explore hundreds of books and reference titles

Read next

More like this
Sage Recommends
We found other relevant content for you on other Sage platforms.
Have you created a personal profile? Login or create a profile so that you can save clips, playlists and searches