Entry
Reader's guide
Entries A-Z
Subject index
Odds Ratio
An odds ratio is the division of two odds. An odds is formed by two numbers representing two different events (most often event vs. nonevent), such as the odds of winning versus losing, or the odds of voting for the Democratic candidate versus voting for the Republican candidate (or a non-Democratic candidate). As such, it is different from a rate, which gives the number of events occurring in a population standardized to a base, such as per hundred or per thousand. Odds ratios are useful statistical tools in categorical data analysis for studying association or concordance in the data.
G. Udny Yule was notably the first statistician to apply odds ratios to measure the association in contingency tables. Odds ratios and log-odds ratios are common tools for log-linear modeling. To demonstrate the application of odds ratios, let us examine in Table 1 some classic data presented by M. Greenwood and G. U. Yule in their classic 1915 study of the effect of antityphoid inoculations.
This is a typical 2 × 2 table with the columns recording the two outcomes and the rows representing the two categories in the exposure variable. More generally, the columns may contain any response or dependent variable and the rows, any explanatory or independent variable; indeed, the rows and columns can simply contain two variables whose association is under investigation. The cells can be indicated by A,B,C, and D (see Table 2).
| Table 1 Data on Antityphoid Inoculations | |||
|---|---|---|---|
| Typhoid: No | Typhoid: Yes | Total | |
| Inoculation: Yes | 6,759 | 56 | 6,815 |
| Inoculation: No | 11,396 | 272 | 11,668 |
| Total | 18,155 | 328 | 18,483 |
| SOURCE: Data are from Greenwood and Yule (1915). | |||
| Table 2 A Two-by-Two Table Layout | |||
|---|---|---|---|
| Variable 1, Category 1 | Variable 1, Category 2 | Total | |
| Variable 2, Category 1 | A | B | A + B |
| Variable 2, Category 2 | C | D | C + D |
| Total | A + C | B + D | A + B + C + D |
There are three nonredundant ways of forming odds ratios (OR) in a 2 × 2 table:
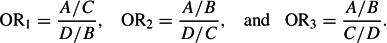
For studying association between two categorical variables, OR3 typically is used. This odds ratio is also known as the cross-product ratio because
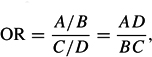
where hereafter we ignore the subscript because it is the only odds ratio we examine. Returning to the data on antityphoid inoculations, we find the odds ratio or cross-product ratio to be
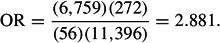
The ratio suggests that there is an association between inoculations and typhoid occurrences. The odds of having typhoid prevented are close to three times greater for those who had received inoculations than for those who had not. Statistics like these may give some evidence to government agencies for policy making such as implementing vaccination programs.
Note that Yule's Q is simply a function of the odds ratio that has been normed to fall between −1 and +1:
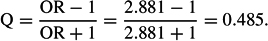
Because the Q statistic is close to 0.5 (with zero indicating no relationship), it suggests some moderate positive association between inoculations and typhoid prevention.
Often, it is convenient to work with (natural-) log-odds ratios, which have two useful properties. Log-odds ratios have zero as the value for indicating no relation between the two variables, whereas the value for odds ratios is one. Zero for no relationship may be intuitively appealing for some researchers. One also can compute asymptotic standard errors for log-odds
...
- Analysis of Variance
- Association and Correlation
- Association
- Association Model
- Asymmetric Measures
- Biserial Correlation
- Canonical Correlation Analysis
- Correlation
- Correspondence Analysis
- Intraclass Correlation
- Multiple Correlation
- Part Correlation
- Partial Correlation
- Pearson's Correlation Coefficient
- Semipartial Correlation
- Simple Correlation (Regression)
- Spearman Correlation Coefficient
- Strength of Association
- Symmetric Measures
- Basic Qualitative Research
- Basic Statistics
- F Ratio
- N(n)
- t-Test
- X¯
- Y Variable
- z-Test
- Alternative Hypothesis
- Average
- Bar Graph
- Bell-Shaped Curve
- Bimodal
- Case
- Causal Modeling
- Cell
- Covariance
- Cumulative Frequency Polygon
- Data
- Dependent Variable
- Dispersion
- Exploratory Data Analysis
- Frequency Distribution
- Histogram
- Hypothesis
- Independent Variable
- Measures of Central Tendency
- Median
- Null Hypothesis
- Pie Chart
- Regression
- Standard Deviation
- Statistic
- Causal Modeling
- Discourse/Conversation Analysis
- Econometrics
- Epistemology
- Ethnography
- Evaluation
- Event History Analysis
- Experimental Design
- Factor Analysis and Related Techniques
- Feminist Methodology
- Generalized Linear Models
- Historical/Comparative
- Interviewing in Qualitative Research
- Latent Variable Model
- Life History/Biography
- Log-Linear Models (Categorical Dependent Variables)
- Longitudinal Analysis
- Mathematics and Formal Models
- Measurement Level
- Measurement Testing and Classification
- Multilevel Analysis
- Multiple Regression
- Qualitative Data Analysis
- Sampling in Qualitative Research
- Sampling in Surveys
- Scaling
- Significance Testing
- Simple Regression
- Survey Design
- Time Series
- ARIMA
- Box-Jenkins Modeling
- Cointegration
- Detrending
- Durbin-Watson Statistic
- Error Correction Models
- Forecasting
- Granger Causality
- Interrupted Time-Series Design
- Intervention Analysis
- Lag Structure
- Moving Average
- Periodicity
- Serial Correlation
- Spectral Analysis
- Time-Series Cross-Section (TSCS) Models
- Time-Series Data (Analysis/Design)
- Trend Analysis
- Loading...
Get a 30 day FREE TRIAL
-
 Watch videos from a variety of sources bringing classroom topics to life
 -
Read modern, diverse business cases
-
Explore hundreds of books and reference titles

Read next

More like this
Sage Recommends
We found other relevant content for you on other Sage platforms.
Have you created a personal profile? Login or create a profile so that you can save clips, playlists and searches