Entry
Reader's guide
Entries A-Z
Subject index
MULTIDIMENSIONAL SCALING (MDS)
Multidimensional scaling (MDS) refers to a family of models in which the structure in a set of data is represented graphically by the relationships between a set of points in a space. MDS can be used on a wide variety of data, using different models and allowing different assumptions about the level of measurement.
In the simplest case, a data matrix giving information about the similarity (or dissimilarity) between a set of objects is represented by the proximity (or distance) between corresponding points in a low-dimensional space. Given a set of data, interpreted as “distances,” it finds the map locations that generated them.
For example, in a study of how people categorize drugs, a list of drugs was elicited from a sample of users and nonusers; 28 drugs were retained for a free-sorting experiment, and the co-occurrence frequency was used as the measure of similarity. The data were scaled in two dimensions, producing Figure 1.
Figure 1
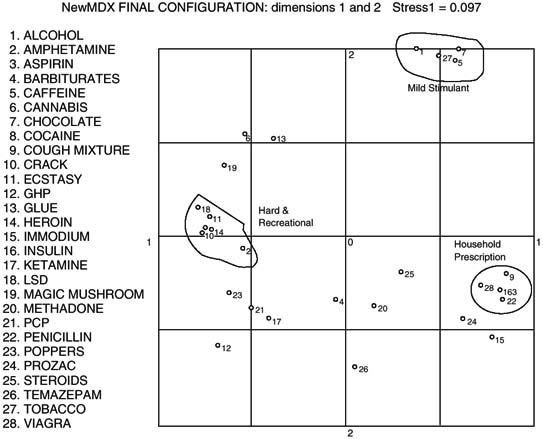
In the case of perfect data, the correspondence between the dissimilarity data and the distances of the solution will be total, but with imperfect data, the degree of fit is given by the size of the normalized stress (residual sum of squares) value, which is a measure of badness of fit. In this case, the fit is excellent (stress1 = 0.097), and it is three times smaller than random expectation. The solution configuration yields three highly distinct clusters (confirmed by independent hierarchical clustering) of mild stimulant drugs (core prototypes: tobacco, caffeine), hard recreational (core: cocaine, heroin), and household prescription (core: aspirin, penicillin).
MDS can be either exploratory (simply providing a useful and easily assimilable visualization of a data set) or explanatory (giving a geometric representation of the structure in a data set, in which the assumptions of the model are taken to represent the way in which the data were produced). Compared to other multivariate methods, MDS models are usually distribution free, make conservative demands on the structure of the data, are unaffected by nonsystematic missing data, and can be used with a wide variety of measures; the solutions are also usually readily interpretable. The chief weaknesses are relative ignorance of the sampling properties of stress, proneness to local minima solutions, and inability to represent the asymmetry of causal models.
The Basic MDS Model
The basic type of MDS is the analysis of twoway, one-mode data (e.g., a matrix of correlations or other dissimilarity/similarity measures), using the Euclidean distance model. The original metric version, “classical” MDS converted the “distances” into scalar products and then factored or decomposed them into a set of locations in a low-dimensional space (hence “smallest space analysis”). The first nonmetric model was developed by Roger N. Shepard in 1962, who showed that the merely ordinal constraints of the data, if imposed in sufficient number, guarantee metric recovery, and he provided the first iterative computer program that implemented the claim. Kruskal (1964) gave ordinary least squares (OLS) statistical substance to it; Takane, Young, and DeLeeuw (1977) developed a frequently used Alternating Least Squares program (ALSCAL); and probabilistic maximum likelihood versions of MDS have also subsequently been developed (e.g., MULTISCALE) (Ramsay, 1977).
...
- Analysis of Variance
- Association and Correlation
- Association
- Association Model
- Asymmetric Measures
- Biserial Correlation
- Canonical Correlation Analysis
- Correlation
- Correspondence Analysis
- Intraclass Correlation
- Multiple Correlation
- Part Correlation
- Partial Correlation
- Pearson's Correlation Coefficient
- Semipartial Correlation
- Simple Correlation (Regression)
- Spearman Correlation Coefficient
- Strength of Association
- Symmetric Measures
- Basic Qualitative Research
- Basic Statistics
- F Ratio
- N(n)
- t-Test
- X¯
- Y Variable
- z-Test
- Alternative Hypothesis
- Average
- Bar Graph
- Bell-Shaped Curve
- Bimodal
- Case
- Causal Modeling
- Cell
- Covariance
- Cumulative Frequency Polygon
- Data
- Dependent Variable
- Dispersion
- Exploratory Data Analysis
- Frequency Distribution
- Histogram
- Hypothesis
- Independent Variable
- Measures of Central Tendency
- Median
- Null Hypothesis
- Pie Chart
- Regression
- Standard Deviation
- Statistic
- Causal Modeling
- Discourse/Conversation Analysis
- Econometrics
- Epistemology
- Ethnography
- Evaluation
- Event History Analysis
- Experimental Design
- Factor Analysis and Related Techniques
- Feminist Methodology
- Generalized Linear Models
- Historical/Comparative
- Interviewing in Qualitative Research
- Latent Variable Model
- Life History/Biography
- Log-Linear Models (Categorical Dependent Variables)
- Longitudinal Analysis
- Mathematics and Formal Models
- Measurement Level
- Measurement Testing and Classification
- Multilevel Analysis
- Multiple Regression
- Qualitative Data Analysis
- Sampling in Qualitative Research
- Sampling in Surveys
- Scaling
- Significance Testing
- Simple Regression
- Survey Design
- Time Series
- ARIMA
- Box-Jenkins Modeling
- Cointegration
- Detrending
- Durbin-Watson Statistic
- Error Correction Models
- Forecasting
- Granger Causality
- Interrupted Time-Series Design
- Intervention Analysis
- Lag Structure
- Moving Average
- Periodicity
- Serial Correlation
- Spectral Analysis
- Time-Series Cross-Section (TSCS) Models
- Time-Series Data (Analysis/Design)
- Trend Analysis
- Loading...
Get a 30 day FREE TRIAL
-
 Watch videos from a variety of sources bringing classroom topics to life
 -
Read modern, diverse business cases
-
Explore hundreds of books and reference titles

Read next

More like this
Sage Recommends
We found other relevant content for you on other Sage platforms.
Have you created a personal profile? Login or create a profile so that you can save clips, playlists and searches