Entry
Reader's guide
Entries A-Z
Subject index
Median
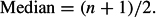
The median is the midpoint of the distribution of a variable such that half the distribution falls above the median and half falls below it. That is,
If the distribution has an even number of cases, then the median is deemed to fall precisely between the two middle cases and is calculated as the arithmetic MEAN of those two cases. For example, in the set of cases

the median value is 8. In the set of cases
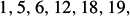
however, the median is (6 + 12)/2 = 9.
When the data do not have discrete values but are grouped either in ranges or with a continuous variable (e.g., age is given whereby each year actually represents the continuous possible ages across that period), a different approach is used to calculate the median. For example, Table 1 shows the frequencies of children in a small specialist school who fall into particular age bands.
| Table 1 Distribution of Children by Age Ranges in a Small Specialist School (constructed data) | ||
|---|---|---|
| Age Range (Years)FrequencyCumulative Frequency | ||
| 3 to 5.9 | 16 | 16 |
| 6 to 8.9 | 35 | 51 |
| 9 to 11.9 | 62 | 113 |
| 12 to 14.9 | 63 | 176 |
| 15 to 17.9 | 21 | 197 |
There are 197 children, so the median value will be the age of the 99th child. The 99th child falls in the 9 to 11.9-year age bracket. In fact, it falls 48 observations into that bracket and so can be counted as the 48/62 share of that bracket of 3 years added on to the age of 8.9 that it has already passed. That is, the median can be calculated as

The median is, therefore, one of several MEASURES OF CENTRAL TENDENCY, or location, that can be used to understand aspects of the distribution. It is also a form of the AVERAGE, even if that term is normally reserved in common parlance for the arithmetic mean. Although the median does not have as many applications as the mean, it has certain advantages in giving an understanding of a distribution. The principal advantage is that it is not as susceptible to OUTLIERS—that is, extreme, potentially erroneous and potentially distorting cases—that will influence the mean value but not the median (see MEAN). For example, in the first example above, the value of 45 would appear to be such an outlier. Similarly, the median may form a valuable average when the final value of a distribution is unknown, rendering the mean impossible to calculate. The median can also be used for ordinal data, that is, data for which there is a hierarchical order to categories but the distances between the categories are not equal. An example is measures of educational achievement, ranked 1 for no qualifications, 2 for midlevel qualifications, 3 for higher qualifications, and so on. In such cases, it is meaningless to calculate the mean as the values do not represent numeric quantities. However, the median may be of interest in such instances.
The median can also be considered the 50th percentile and, as such, is a special instance of percentiles as measures of distribution. Percentiles are the values at which the named proportion of cases falls below the value and the remainder fall above it. Thus, the 25th percentile (or lower quartile) represents the value at which 25% of cases are of smaller value and the remaining 75% are larger. The median is thus part of a general system of describing a distribution by the values that break it into specified divisions. There are 99 percentiles in a distribution that divide it into 100 parts, 9 deciles (of which the median is the 5th) that divide it into 10 parts, and 3 quartiles (of which the median is the central one) that divide it into 4 parts.
...
- Analysis of Variance
- Association and Correlation
- Association
- Association Model
- Asymmetric Measures
- Biserial Correlation
- Canonical Correlation Analysis
- Correlation
- Correspondence Analysis
- Intraclass Correlation
- Multiple Correlation
- Part Correlation
- Partial Correlation
- Pearson's Correlation Coefficient
- Semipartial Correlation
- Simple Correlation (Regression)
- Spearman Correlation Coefficient
- Strength of Association
- Symmetric Measures
- Basic Qualitative Research
- Basic Statistics
- F Ratio
- N(n)
- t-Test
- X¯
- Y Variable
- z-Test
- Alternative Hypothesis
- Average
- Bar Graph
- Bell-Shaped Curve
- Bimodal
- Case
- Causal Modeling
- Cell
- Covariance
- Cumulative Frequency Polygon
- Data
- Dependent Variable
- Dispersion
- Exploratory Data Analysis
- Frequency Distribution
- Histogram
- Hypothesis
- Independent Variable
- Measures of Central Tendency
- Median
- Null Hypothesis
- Pie Chart
- Regression
- Standard Deviation
- Statistic
- Causal Modeling
- Discourse/Conversation Analysis
- Econometrics
- Epistemology
- Ethnography
- Evaluation
- Event History Analysis
- Experimental Design
- Factor Analysis and Related Techniques
- Feminist Methodology
- Generalized Linear Models
- Historical/Comparative
- Interviewing in Qualitative Research
- Latent Variable Model
- Life History/Biography
- Log-Linear Models (Categorical Dependent Variables)
- Longitudinal Analysis
- Mathematics and Formal Models
- Measurement Level
- Measurement Testing and Classification
- Multilevel Analysis
- Multiple Regression
- Qualitative Data Analysis
- Sampling in Qualitative Research
- Sampling in Surveys
- Scaling
- Significance Testing
- Simple Regression
- Survey Design
- Time Series
- ARIMA
- Box-Jenkins Modeling
- Cointegration
- Detrending
- Durbin-Watson Statistic
- Error Correction Models
- Forecasting
- Granger Causality
- Interrupted Time-Series Design
- Intervention Analysis
- Lag Structure
- Moving Average
- Periodicity
- Serial Correlation
- Spectral Analysis
- Time-Series Cross-Section (TSCS) Models
- Time-Series Data (Analysis/Design)
- Trend Analysis
- Loading...
Get a 30 day FREE TRIAL
-
 Watch videos from a variety of sources bringing classroom topics to life
 -
Read modern, diverse business cases
-
Explore hundreds of books and reference titles

Read next

More like this
Sage Recommends
We found other relevant content for you on other Sage platforms.
Have you created a personal profile? Login or create a profile so that you can save clips, playlists and searches