Entry
Reader's guide
Entries A-Z
Subject index
Laboratory Experiment
All EXPERIMENTS involve random assignment of participants to the conditions of the study, an INDEPENDENT VARIABLE (IV) and a dependent variable (DV). Experiments may be conducted in highly constrained laboratory settings or in field contexts, which generally are characterized by somewhat less control. Both venues offer advantages and disadvantages. In the laboratory, the researcher typically has control over all external forces that might affect the participant—the degree of control over the setting is extreme. In field experiments, this often is not so; hence, conclusions are sometimes more tentative in such contexts, owing to the possibility of the effect of uncontrolled variations.
Random assignment in experimentation means that from a predefined pool, all participants have an equal chance of being assigned to one or another condition of the study. After random assignment, participants assigned to different conditions receive different levels of the IV. In some designs, participants will have been pretested (i.e., assessed on a measure that theoretically is sensitive to variations caused by different levels of the IV). In other designs, only a posttreatment DV is used (see Crano & Brewer, 2002). After the treatment application, they are assessed again, as indicated in Figure 1, which shows two groups, a treated group and a control group (which did not receive the experimental treatment).
In developing an experiment, the theoretical construct that is the central focus of the study, as well as the measures of this CONCEPTUALIZATION, must be defined in terms of observable behavior sorevents. This process is termed operationalization. Then, participants are assigned randomly to conditions of the experiment, which are defined by different levels of the IV. Sometimes, more than one IV is employed; typically in such cases, each level of one IV is combined with each level of the other(s), resulting in a factorial design. Ideally, equal numbers of participants are assigned to each condition formed by the factorial combination. After assignment, participants are exposed to the particular treatment (IV) or combination of treatments (if multiple IVs are used), and the effects of this exposure are observed on the DV.
The laboratory experiment is a highly constrained research technique. Through randomization, participants theoretically are equivalent in all respects, except that some have been exposed to the IV and others have not (or they were systematically exposed
Figure 1 Example of a Pretest/Posttest/Control Group Experimental Design
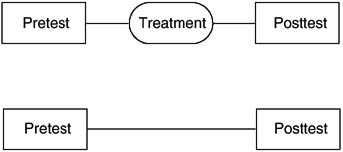
NOTE: Removing the pretest from treatment and control groups results in a posttest-only/control group design. Random assignment of participants to conditions is assumed in either case.
to different values or levels of the IV). As such, they should not differ on the DV unless the IV has had an effect. The high degree of constraint characteristic of laboratory experimental research has caused some to question the generalizability of findings generated in these contexts. Conversely, the randomization and constraint that characterize the laboratory experiment help shield the research from extraneous variables that may affect the DV but that have not been accounted for. The trade-off of generalizability versus control helps define the most appropriate occasion for laboratory experimentation.
The laboratory experiment is the ideal method to determine cause-effect relationships. It is most profitably employed when considerable knowledge of the phenomenon under study already exists. It is not a particularly efficient method to develop hypotheses. However, if the theory surrounding a phenomenon is relatively well developed, and fine-grained hypotheses can be developed on the basis of theory, the laboratory experiment can materially assist understanding the precise nature of the construct in question. It is an ideal method to test alternative explanations of specific predicted causal relationship, facilitating identification of factors that amplify or impede a given outcome.
...
- Analysis of Variance
- Association and Correlation
- Association
- Association Model
- Asymmetric Measures
- Biserial Correlation
- Canonical Correlation Analysis
- Correlation
- Correspondence Analysis
- Intraclass Correlation
- Multiple Correlation
- Part Correlation
- Partial Correlation
- Pearson's Correlation Coefficient
- Semipartial Correlation
- Simple Correlation (Regression)
- Spearman Correlation Coefficient
- Strength of Association
- Symmetric Measures
- Basic Qualitative Research
- Basic Statistics
- F Ratio
- N(n)
- t-Test
- X¯
- Y Variable
- z-Test
- Alternative Hypothesis
- Average
- Bar Graph
- Bell-Shaped Curve
- Bimodal
- Case
- Causal Modeling
- Cell
- Covariance
- Cumulative Frequency Polygon
- Data
- Dependent Variable
- Dispersion
- Exploratory Data Analysis
- Frequency Distribution
- Histogram
- Hypothesis
- Independent Variable
- Measures of Central Tendency
- Median
- Null Hypothesis
- Pie Chart
- Regression
- Standard Deviation
- Statistic
- Causal Modeling
- Discourse/Conversation Analysis
- Econometrics
- Epistemology
- Ethnography
- Evaluation
- Event History Analysis
- Experimental Design
- Factor Analysis and Related Techniques
- Feminist Methodology
- Generalized Linear Models
- Historical/Comparative
- Interviewing in Qualitative Research
- Latent Variable Model
- Life History/Biography
- Log-Linear Models (Categorical Dependent Variables)
- Longitudinal Analysis
- Mathematics and Formal Models
- Measurement Level
- Measurement Testing and Classification
- Multilevel Analysis
- Multiple Regression
- Qualitative Data Analysis
- Sampling in Qualitative Research
- Sampling in Surveys
- Scaling
- Significance Testing
- Simple Regression
- Survey Design
- Time Series
- ARIMA
- Box-Jenkins Modeling
- Cointegration
- Detrending
- Durbin-Watson Statistic
- Error Correction Models
- Forecasting
- Granger Causality
- Interrupted Time-Series Design
- Intervention Analysis
- Lag Structure
- Moving Average
- Periodicity
- Serial Correlation
- Spectral Analysis
- Time-Series Cross-Section (TSCS) Models
- Time-Series Data (Analysis/Design)
- Trend Analysis
- Loading...
Get a 30 day FREE TRIAL
-
 Watch videos from a variety of sources bringing classroom topics to life
 -
Read modern, diverse business cases
-
Explore hundreds of books and reference titles

Read next

More like this
Sage Recommends
We found other relevant content for you on other Sage platforms.
Have you created a personal profile? Login or create a profile so that you can save clips, playlists and searches