Entry
Reader's guide
Entries A-Z
Subject index
Interrupted Time-Series Design
The interrupted time-series design provides an estimate of the causal effect of a discrete intervention. In its simplest form, the design begins from a long series of repeated measurements on a DEPENDENT VARIABLE. The INTERVENTION breaks this TIME SERIES into preintervention and postintervention segments, and a data analysis compares the means of the dependent variable in the two periods. Rejecting the NULL HYPOTHESIS of no difference between the means is taken as evidence that the intervention influenced the series.
Figure1 illustrates an unusually clear example of the design's logic. The data come from a 1978 study by A. John McSweeny and consist of 180 months of local directory assistance calls in Cincinnati, Ohio. During March 1974, the Cincinnati telephone company began to charge a small fee for answering these calls, which it had previously handled for free. Call volume plummeted, supporting the idea that the fee successfully reduced demands on the service.
In this example, the causal impact of the intervention seems obvious. The number of calls fell immediately and dramatically, and no ready explanation exists for why the drop might otherwise have occurred. More typically, any change in a series will be visually ambiguous, and alternative explanations will be easier to construct. Therefore, applications of the timeseries design must address statistical analysis issues, and researchers must entertain rival explanations for an apparent causal effect.
Much of the design's popularity stems from the work of Donald T. Campbell, in collaborations with Julian C. Stanley and Thomas D. Cook. Campbell and his coworkers developed a list of threats to the INTERNAL VALIDITY of causal inferences, where variables besides the one under study might account for the results. Using their list to evaluate common nonexperimental designs, Campbell and coworkers concluded that the interrupted time series had stronger internal validity than did most alternatives.
Its relative strengths notwithstanding, the timeseries design is still vulnerable to several important validity threats. One of these is history, or the possibility that other events around the time of the intervention were responsible for an observed effect. To make historical threats less plausible, researchers often analyze control series that were not subject to the intervention.
Figure 1 Average Daily Calls (in Thousands) to Cincinnati Local Directory Assistance, January 1962–December 1976
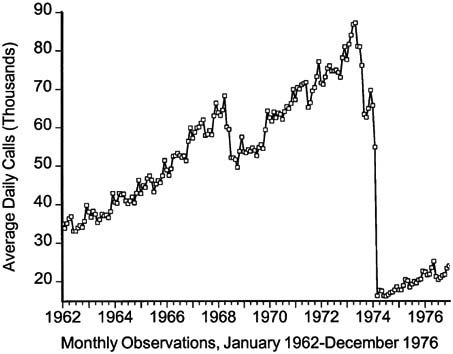
Lack of change in these series increases confidence that the intervention was the causal agent. In Cincinnati, for example, the telephone company continued to provide free long-distance directory assistance, and this series did not drop after the local assistance fee began.
Statistical analyses of interrupted time-series data often rely on BOX-JENKINS MODELING. Although not absolutely required, Box-Jenkins methods help solve two major analytic problems: nonstationarity and SERIAL CORRELATION. Nonstationarity occurs when a series lacks a constant mean (e.g., when it trends), and serial correlation occurs when later observations are predictable from earlier ones. If not addressed, these features can invalidate tests of the difference between the preintervention and postintervention means.
References
...
- Analysis of Variance
- Association and Correlation
- Association
- Association Model
- Asymmetric Measures
- Biserial Correlation
- Canonical Correlation Analysis
- Correlation
- Correspondence Analysis
- Intraclass Correlation
- Multiple Correlation
- Part Correlation
- Partial Correlation
- Pearson's Correlation Coefficient
- Semipartial Correlation
- Simple Correlation (Regression)
- Spearman Correlation Coefficient
- Strength of Association
- Symmetric Measures
- Basic Qualitative Research
- Basic Statistics
- F Ratio
- N(n)
- t-Test
- X¯
- Y Variable
- z-Test
- Alternative Hypothesis
- Average
- Bar Graph
- Bell-Shaped Curve
- Bimodal
- Case
- Causal Modeling
- Cell
- Covariance
- Cumulative Frequency Polygon
- Data
- Dependent Variable
- Dispersion
- Exploratory Data Analysis
- Frequency Distribution
- Histogram
- Hypothesis
- Independent Variable
- Measures of Central Tendency
- Median
- Null Hypothesis
- Pie Chart
- Regression
- Standard Deviation
- Statistic
- Causal Modeling
- Discourse/Conversation Analysis
- Econometrics
- Epistemology
- Ethnography
- Evaluation
- Event History Analysis
- Experimental Design
- Factor Analysis and Related Techniques
- Feminist Methodology
- Generalized Linear Models
- Historical/Comparative
- Interviewing in Qualitative Research
- Latent Variable Model
- Life History/Biography
- Log-Linear Models (Categorical Dependent Variables)
- Longitudinal Analysis
- Mathematics and Formal Models
- Measurement Level
- Measurement Testing and Classification
- Multilevel Analysis
- Multiple Regression
- Qualitative Data Analysis
- Sampling in Qualitative Research
- Sampling in Surveys
- Scaling
- Significance Testing
- Simple Regression
- Survey Design
- Time Series
- ARIMA
- Box-Jenkins Modeling
- Cointegration
- Detrending
- Durbin-Watson Statistic
- Error Correction Models
- Forecasting
- Granger Causality
- Interrupted Time-Series Design
- Intervention Analysis
- Lag Structure
- Moving Average
- Periodicity
- Serial Correlation
- Spectral Analysis
- Time-Series Cross-Section (TSCS) Models
- Time-Series Data (Analysis/Design)
- Trend Analysis
- Loading...
Get a 30 day FREE TRIAL
-
 Watch videos from a variety of sources bringing classroom topics to life
 -
Read modern, diverse business cases
-
Explore hundreds of books and reference titles

Read next

More like this
Sage Recommends
We found other relevant content for you on other Sage platforms.
Have you created a personal profile? Login or create a profile so that you can save clips, playlists and searches