Entry
Reader's guide
Entries A-Z
Subject index
Hazard Rate
A hazard rate, also known as a hazard function or hazard ratio, is a concept that arises largely in the literatures on SURVIVAL ANALYSIS and EVENT HISTORYANALYSIS, and this entry focuses on its usage and estimation in these literatures. However, the estimator of the hazard ratio also plays a key role in the MULTIVARIATE modeling approach to correcting for sample SELECTION BIAS proposed by Heckman (1979).
The mathematical definition of a hazard rate starts with the assumption that a continuous RANDOM VARIABLET defined over a range tmin ≤ T ≤ tmax has a cumulative distribution function (CDF), F(t), and a corresponding PROBABILITY DENSITY FUNCTION, f(t) ≡ dF(t)/dt. Frequently, the random variable T is assumed to be some measure of time. The complement of the cumulative probability function, called the survivor function, is defined as S(t) ≡ 1 − F(t). Because it gives the probability that T ≥ t (i.e., “survives” from tmin to t), it is also known as the survivor probability. The hazard rate (or hazard ratio), h(t), is then defined as
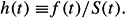
Speaking roughly and not rigorously, the hazard rate tells the chance or probability that the random variable T falls in an infinitesimally small range, t ≤ T < t + Δt, divided by Δt, given that T ≥ t, when Δt is allowed to shrink to 0. (Mathematically, one takes the limit as Δt approaches 0.)
Because both the probability density function and the survivor function cannot be negative, the hazard rate cannot be negative. The hazard rate is often regarded as analogous to a probability, and some authors even refer to a “discrete [time] hazard rate” (rather than to a probability) when T is taken to be a discrete random variable. However, for a continuous random variable T, the hazard rate can exceed 1, and, unlike a probability, it is not a unit-free number. Rather, its scale is the inverse of the scale of T. For example, in event history analysis, T might denote the age at which a person experiences some event (marriage, death) or the duration at which someone enters or leaves some status (starts or ends a job). In such instances, the hazard rate might be expressed in units “per year” or “per month.”
Because the survivor function equals 1 at tmin, the hazard rate equals the probability density function at tmin. In addition, because the survivor function is a monotonically nonincreasing function and equals 0 at tmax (unless T has a “defective” probability distribution), the hazard rate tends to become an increasingly larger multiple of the probability density function as t increases.
The LIFE TABLE or actuarial ESTIMATOR of the hazard rate in a specified discrete interval [u, v) has a very long history of usage in demography and is still utilized in many practical applications. Its definition is
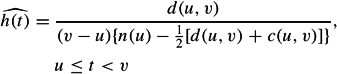
where d(u, v) is the number of observations of t falling in the interval [u, v); n(u) is the number of observations that survived until u (i.e., for which T ≥ u); and c(u, v) is the number of observations censored in the interval [u, v). (See CENSORING AND TRUNCATION for a definition and discussion of censored observations.) One-half appears in the divisor on the right-hand side of the equation because observations within the interval [u, v) are assumed to occur uniformly over the interval.
...
- Analysis of Variance
- Association and Correlation
- Association
- Association Model
- Asymmetric Measures
- Biserial Correlation
- Canonical Correlation Analysis
- Correlation
- Correspondence Analysis
- Intraclass Correlation
- Multiple Correlation
- Part Correlation
- Partial Correlation
- Pearson's Correlation Coefficient
- Semipartial Correlation
- Simple Correlation (Regression)
- Spearman Correlation Coefficient
- Strength of Association
- Symmetric Measures
- Basic Qualitative Research
- Basic Statistics
- F Ratio
- N(n)
- t-Test
- X¯
- Y Variable
- z-Test
- Alternative Hypothesis
- Average
- Bar Graph
- Bell-Shaped Curve
- Bimodal
- Case
- Causal Modeling
- Cell
- Covariance
- Cumulative Frequency Polygon
- Data
- Dependent Variable
- Dispersion
- Exploratory Data Analysis
- Frequency Distribution
- Histogram
- Hypothesis
- Independent Variable
- Measures of Central Tendency
- Median
- Null Hypothesis
- Pie Chart
- Regression
- Standard Deviation
- Statistic
- Causal Modeling
- Discourse/Conversation Analysis
- Econometrics
- Epistemology
- Ethnography
- Evaluation
- Event History Analysis
- Experimental Design
- Factor Analysis and Related Techniques
- Feminist Methodology
- Generalized Linear Models
- Historical/Comparative
- Interviewing in Qualitative Research
- Latent Variable Model
- Life History/Biography
- Log-Linear Models (Categorical Dependent Variables)
- Longitudinal Analysis
- Mathematics and Formal Models
- Measurement Level
- Measurement Testing and Classification
- Multilevel Analysis
- Multiple Regression
- Qualitative Data Analysis
- Sampling in Qualitative Research
- Sampling in Surveys
- Scaling
- Significance Testing
- Simple Regression
- Survey Design
- Time Series
- ARIMA
- Box-Jenkins Modeling
- Cointegration
- Detrending
- Durbin-Watson Statistic
- Error Correction Models
- Forecasting
- Granger Causality
- Interrupted Time-Series Design
- Intervention Analysis
- Lag Structure
- Moving Average
- Periodicity
- Serial Correlation
- Spectral Analysis
- Time-Series Cross-Section (TSCS) Models
- Time-Series Data (Analysis/Design)
- Trend Analysis
- Loading...
Get a 30 day FREE TRIAL
-
 Watch videos from a variety of sources bringing classroom topics to life
 -
Read modern, diverse business cases
-
Explore hundreds of books and reference titles

Read next

More like this
Sage Recommends
We found other relevant content for you on other Sage platforms.
Have you created a personal profile? Login or create a profile so that you can save clips, playlists and searches