Entry
Reader's guide
Entries A-Z
Subject index
Fuzzy Set Theory
Fuzzy set theory deals with sets or categories whose boundaries are blurry or “fuzzy.” For instance, an object is not necessarily just red or not red, it can be “reddish” or even a “warm green” (green with a tinge of red in it). Likewise, a political scientist may rate one government as more or less democratic than another. Fuzzy set theory permits membership in the set of red objects or democratic governments to be a matter of degree. It offers an analytic framework for handling concepts that are simultaneously categorical and dimensional. Below, the basic ideas behind fuzzy set theory and fuzzy logic are introduced and, where possible, illustrated with examples from the social sciences.
Concept of a Fuzzy Set
Membership in a set may be represented by values in the [0,1] interval. A classical crisp set permits only the values 0 (nonmembership) and 1 (full membership). Treating the set of males as a crisp set would entail assigning each persona1ifthe criteria for being a male were satisfied and a 0 otherwise. A fuzzy set, on the other hand, permits values in between 0 and 1. Thus, a 21-year-old might be accorded full membership in the set of “young adults,” but a 28-year-old might be given a degree of membership somewhere between 0 and 1. Conventionally, 1/2 denotes an element that is neither completely in nor out of the set. A membership function maps values or states from one or more support variables onto the [0,1] interval. Figure 1 shows two hypothetical membership functions using age as the support: “young adult” and “adolescent.” Although adolescents are generally younger than young adults, these two sets overlap and permit nonzero degrees of membership in each.
Although there is no universally accepted interpretation of what degree of membership in a fuzzy set means, consensus exists about several points. First, a degree of membership is not a probability and, indeed, may be assigned with complete certainty. Moreover, unlike probabilities, degrees of membership need not sum to 1 across an exhaustive set of alternatives. Membership in some contexts is defined in terms of similarity to a prototype, but in others, it may connote a degree of compatibility or possibility in relation to a concept. An example of the latter is “several,” considered to be a fuzzy verbal number. The integer 6 might be considered completely compatible with “several,” whereas 3 would be less so and therefore assigned a lower membership value.
The concept of possibility also has been used to characterize degree of membership. Possibility provides an upper envelope on probability. For example, if 45% of the people in a community own a bicycle, then in a random survey of that community, the maximum probability of finding a person who has used his or her bicycle on a given day will be 0.45, but
Figure 1 Membership Functions for “Young Adult” and “Adolescent”
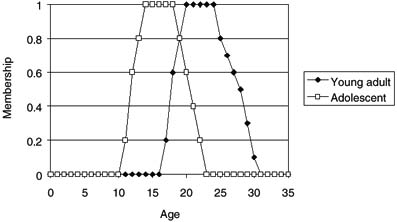
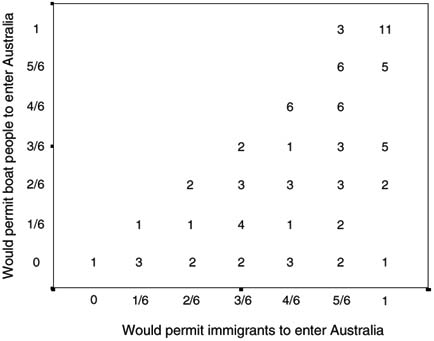
Figure 2 Example of Fuzzy Set Inclusion
of course, the actual probability may well be lower. Possibility theory is a framework based on fuzzy set theory and closely related to theories of imprecise probabilities (e.g., lower and upper probabilities and belief functions).
...
- Analysis of Variance
- Association and Correlation
- Association
- Association Model
- Asymmetric Measures
- Biserial Correlation
- Canonical Correlation Analysis
- Correlation
- Correspondence Analysis
- Intraclass Correlation
- Multiple Correlation
- Part Correlation
- Partial Correlation
- Pearson's Correlation Coefficient
- Semipartial Correlation
- Simple Correlation (Regression)
- Spearman Correlation Coefficient
- Strength of Association
- Symmetric Measures
- Basic Qualitative Research
- Basic Statistics
- F Ratio
- N(n)
- t-Test
- X¯
- Y Variable
- z-Test
- Alternative Hypothesis
- Average
- Bar Graph
- Bell-Shaped Curve
- Bimodal
- Case
- Causal Modeling
- Cell
- Covariance
- Cumulative Frequency Polygon
- Data
- Dependent Variable
- Dispersion
- Exploratory Data Analysis
- Frequency Distribution
- Histogram
- Hypothesis
- Independent Variable
- Measures of Central Tendency
- Median
- Null Hypothesis
- Pie Chart
- Regression
- Standard Deviation
- Statistic
- Causal Modeling
- Discourse/Conversation Analysis
- Econometrics
- Epistemology
- Ethnography
- Evaluation
- Event History Analysis
- Experimental Design
- Factor Analysis and Related Techniques
- Feminist Methodology
- Generalized Linear Models
- Historical/Comparative
- Interviewing in Qualitative Research
- Latent Variable Model
- Life History/Biography
- Log-Linear Models (Categorical Dependent Variables)
- Longitudinal Analysis
- Mathematics and Formal Models
- Measurement Level
- Measurement Testing and Classification
- Multilevel Analysis
- Multiple Regression
- Qualitative Data Analysis
- Sampling in Qualitative Research
- Sampling in Surveys
- Scaling
- Significance Testing
- Simple Regression
- Survey Design
- Time Series
- ARIMA
- Box-Jenkins Modeling
- Cointegration
- Detrending
- Durbin-Watson Statistic
- Error Correction Models
- Forecasting
- Granger Causality
- Interrupted Time-Series Design
- Intervention Analysis
- Lag Structure
- Moving Average
- Periodicity
- Serial Correlation
- Spectral Analysis
- Time-Series Cross-Section (TSCS) Models
- Time-Series Data (Analysis/Design)
- Trend Analysis
- Loading...
Get a 30 day FREE TRIAL
-
 Watch videos from a variety of sources bringing classroom topics to life
 -
Read modern, diverse business cases
-
Explore hundreds of books and reference titles

Read next

More like this
Sage Recommends
We found other relevant content for you on other Sage platforms.
Have you created a personal profile? Login or create a profile so that you can save clips, playlists and searches