Entry
Reader's guide
Entries A-Z
Subject index
Covariance
Covariance represents the fundamental measure of association between two random variables. Here we will discuss the concept of covariance in terms of the bivariate NORMAL DISTRIBUTION.
To begin, consider two random variables X and Y, representing, for example, a measure of reading proficiency and a measure of mathematics proficiency. Assume also that the two variables follow a bivariate normal distribution. Define E(X) and E(Y) to be the expectations of the random variables X and Y. Then, the covariance of X and Y, denoted as Cov(X, Y) is

where μx = E(X) and μy = E(Y). A computation formula for the unbiased estimator of the population covariance can be written as
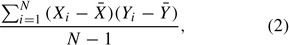
where N is the sample size, X¯ is the sample mean of X, and Y¯ is the sample mean of Y.
Returning to equation (1), the means of the bivariate normal distribution are contained in the mean vector μ, and the covariance of X and Y is contained in the covariance matrix Σ. The covariance matrix is a symmetric matrix, with the variances of X and Y on the diagonal and the covariance of X and Y on the off-diagonal.
The covariance represents the linear relationship between the random variables X and Y; positive values of the covariance are likely to occur when X − μx and Y − μY are of the same sign, and negative values of the covariance are likely to occur when X − μx and Y −μY are of opposite sign. However, regardless of the sign of the covariance, its value is meaningless because it depends on the variances and hence on the metrics of the random variables themselves. To mitigate this problem, the CORRELATION coefficient standardizes the covariance to a mean of zero and a variance of 1 and hence puts the random variables on a common metric. This yields a measure of linear association that ranges from –1 to +1, with zero representing the absence of a linear relationship.
The covariance is a statistic and hence has a SAMPLING DISTRIBUTION. Imagine repeated draws of the two random variables from a population characterized by a bivariate normal distribution. For each draw, we can calculate the means, variances, and the covariance of the two variables. The sampling distribution of the means is known to be normally distributed, and the sampling distributions of the variances are known to be CHI-SQUARE distributed. Concentrating on the covariance matrix, the sampling distribution of the covariance matrix is referred to as the Wishart distribution. The Wishart distribution is the multivariate analog of the chi-square distribution (see, e.g., Timm, 1975). It is interesting to note that the MAXIMUM LIKELIHOOD fitting function used for procedures such as FACTOR ANALYSIS and STRUCTURAL EQUATION MODELING can be derived from the Wishart distribution.
Having defined the covariance between two random variables and its sampling distribution, it is instructive to consider its use in applied settings. As noted earlier, the covariance provides a measure of linear association between two random variables. Alsoasnoted, itismore common to transform the covariance into a correlation coefficient for ease of interpretation. Nevertheless, the covariance—particularly the covariance matrix—is a very important measure for other procedures. A large number of multivariate statistical procedures have been defined based on expressing the covariances in terms of more fundamental parameters. Such procedures as regression analysis, PATH ANALYSIS, factor analysis, and structural equation modeling can be considered as models for the covariances of the variables.
...
- Analysis of Variance
- Association and Correlation
- Association
- Association Model
- Asymmetric Measures
- Biserial Correlation
- Canonical Correlation Analysis
- Correlation
- Correspondence Analysis
- Intraclass Correlation
- Multiple Correlation
- Part Correlation
- Partial Correlation
- Pearson's Correlation Coefficient
- Semipartial Correlation
- Simple Correlation (Regression)
- Spearman Correlation Coefficient
- Strength of Association
- Symmetric Measures
- Basic Qualitative Research
- Basic Statistics
- F Ratio
- N(n)
- t-Test
- X¯
- Y Variable
- z-Test
- Alternative Hypothesis
- Average
- Bar Graph
- Bell-Shaped Curve
- Bimodal
- Case
- Causal Modeling
- Cell
- Covariance
- Cumulative Frequency Polygon
- Data
- Dependent Variable
- Dispersion
- Exploratory Data Analysis
- Frequency Distribution
- Histogram
- Hypothesis
- Independent Variable
- Measures of Central Tendency
- Median
- Null Hypothesis
- Pie Chart
- Regression
- Standard Deviation
- Statistic
- Causal Modeling
- Discourse/Conversation Analysis
- Econometrics
- Epistemology
- Ethnography
- Evaluation
- Event History Analysis
- Experimental Design
- Factor Analysis and Related Techniques
- Feminist Methodology
- Generalized Linear Models
- Historical/Comparative
- Interviewing in Qualitative Research
- Latent Variable Model
- Life History/Biography
- Log-Linear Models (Categorical Dependent Variables)
- Longitudinal Analysis
- Mathematics and Formal Models
- Measurement Level
- Measurement Testing and Classification
- Multilevel Analysis
- Multiple Regression
- Qualitative Data Analysis
- Sampling in Qualitative Research
- Sampling in Surveys
- Scaling
- Significance Testing
- Simple Regression
- Survey Design
- Time Series
- ARIMA
- Box-Jenkins Modeling
- Cointegration
- Detrending
- Durbin-Watson Statistic
- Error Correction Models
- Forecasting
- Granger Causality
- Interrupted Time-Series Design
- Intervention Analysis
- Lag Structure
- Moving Average
- Periodicity
- Serial Correlation
- Spectral Analysis
- Time-Series Cross-Section (TSCS) Models
- Time-Series Data (Analysis/Design)
- Trend Analysis
- Loading...
Get a 30 day FREE TRIAL
-
 Watch videos from a variety of sources bringing classroom topics to life
 -
Read modern, diverse business cases
-
Explore hundreds of books and reference titles

Read next

More like this
Sage Recommends
We found other relevant content for you on other Sage platforms.
Have you created a personal profile? Login or create a profile so that you can save clips, playlists and searches