Entry
Reader's guide
Entries A-Z
Subject index
Confirmatory Factor Analysis
Confirmatory factor analysis is a statistical procedure for testing HYPOTHESES about the commonality among VARIABLES. As a MULTIVARIATE procedure, confirmatory factor analysis is used to simultaneously test multiple hypotheses that collectively constitute a measurement model. All such models comprise four components. At least two variables, or indicators, are necessary for the most rudimentary measurement model. Variability in scores on the indicators is allocated to two sources—LATENT VARIABLES and measurement error. Latent variables are not observed; they are inferred from the commonality among indicators. Measurement error is variability in the indicators not attributable to the latent variables. Finally, the degree to which variability in scores on the indicators can be attributed to the latent variables is indexed by loadings, coefficients that are estimated in measurement equations in which the indicators are regressed on the latent variable(s) hypothesized to influence them.
Sources of Variability
Confirmatory factor analysis partitions variability in scores on indicators according to sources specified in a measurement model. The basis for this partitioning is illustrated in Figure 1. On the left is a Venn diagram that shows six possible sources of variability in three indicators—V1, V2, and V3—that could be specified in a measurement model. In this informal depiction, the indicators are represented by circles, each comprising three parts. The shaded area, labeled F1, is variability in each indicator shared with the other two indicators. The crosshatched area is variability shared with only one of the remaining indicators, and the unshaded area is variability shared with neither of the remaining indicators.
Figure 1 Venn and Path Diagram Depictions of the Partitioning of Variability in the Score on Three Variables Into Shared and Unique Components
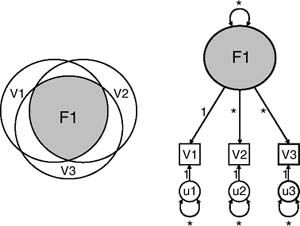
On the right in Figure 1 is a more formal depiction of this partitioning of variability. In this path diagram, the indicators are represented by squares. The large shaded circle, labeled F1, corresponds to the shaded area in the Venn diagram. It is the latent variable the three indicators are purported to measure and reflects the variability they share. The directional paths between the latent variable and the squares represent the assumption that the latent variable is a cause of variability in the indicators. The small circles represent variability unique to each indicator and correspond to the unshaded areas in theVenn diagram. They represent measurement error because they are unintended causes of variability on the indicators. The crosshatched areas from the Venn diagram are not represented in the path diagram. This is because the typical specification of a measurement model assumes unrelated errors of measurement. If the strength of these relations is statistically nontrivial, a satisfactory measurement model will need to include covariances between the errors of measurement.
Two additional features of the path diagram warrant mention. First, notice that attached to each circle is a sharply curved two-headed arrow. This path indicates a variance and illustrates the fact that variability in each indicator has been allocated either to the latent variable or to measurement error. Second, notice that every path is accompanied by either a 1 or an asterisk. These represent parameters, numeric values that reflect the strength of the paths. Parameters indicated by a value such as 1 reflect a fixed assumption about the association between two variables or a variance. Parameters indicated by an asterisk reflect a parameter whose value is not assumed but will be estimated from the observed data. A subset of these parameters of particular interest in confirmatory factor analysis is associated with paths between the latent variable and the indicators—the loadings. The larger these values, the greater the portion of variability in the indicators that can be attributed to the latent variable(s) as opposed to measurement error.
...
- Analysis of Variance
- Association and Correlation
- Association
- Association Model
- Asymmetric Measures
- Biserial Correlation
- Canonical Correlation Analysis
- Correlation
- Correspondence Analysis
- Intraclass Correlation
- Multiple Correlation
- Part Correlation
- Partial Correlation
- Pearson's Correlation Coefficient
- Semipartial Correlation
- Simple Correlation (Regression)
- Spearman Correlation Coefficient
- Strength of Association
- Symmetric Measures
- Basic Qualitative Research
- Basic Statistics
- F Ratio
- N(n)
- t-Test
- X¯
- Y Variable
- z-Test
- Alternative Hypothesis
- Average
- Bar Graph
- Bell-Shaped Curve
- Bimodal
- Case
- Causal Modeling
- Cell
- Covariance
- Cumulative Frequency Polygon
- Data
- Dependent Variable
- Dispersion
- Exploratory Data Analysis
- Frequency Distribution
- Histogram
- Hypothesis
- Independent Variable
- Measures of Central Tendency
- Median
- Null Hypothesis
- Pie Chart
- Regression
- Standard Deviation
- Statistic
- Causal Modeling
- Discourse/Conversation Analysis
- Econometrics
- Epistemology
- Ethnography
- Evaluation
- Event History Analysis
- Experimental Design
- Factor Analysis and Related Techniques
- Feminist Methodology
- Generalized Linear Models
- Historical/Comparative
- Interviewing in Qualitative Research
- Latent Variable Model
- Life History/Biography
- Log-Linear Models (Categorical Dependent Variables)
- Longitudinal Analysis
- Mathematics and Formal Models
- Measurement Level
- Measurement Testing and Classification
- Multilevel Analysis
- Multiple Regression
- Qualitative Data Analysis
- Sampling in Qualitative Research
- Sampling in Surveys
- Scaling
- Significance Testing
- Simple Regression
- Survey Design
- Time Series
- ARIMA
- Box-Jenkins Modeling
- Cointegration
- Detrending
- Durbin-Watson Statistic
- Error Correction Models
- Forecasting
- Granger Causality
- Interrupted Time-Series Design
- Intervention Analysis
- Lag Structure
- Moving Average
- Periodicity
- Serial Correlation
- Spectral Analysis
- Time-Series Cross-Section (TSCS) Models
- Time-Series Data (Analysis/Design)
- Trend Analysis
- Loading...
Get a 30 day FREE TRIAL
-
 Watch videos from a variety of sources bringing classroom topics to life
 -
Read modern, diverse business cases
-
Explore hundreds of books and reference titles

Read next

More like this
Sage Recommends
We found other relevant content for you on other Sage platforms.
Have you created a personal profile? Login or create a profile so that you can save clips, playlists and searches