Entry
Reader's guide
Entries A-Z
Subject index
CHI-Square Distribution
The chi-square distribution is a distribution that results from the sums of squared standard normal variables. Even though the sums of normally distributed variables have a NORMAL DISTRIBUTION (with the shape of a BELL-SHAPED curve), the sums of their squares do not. The commonly used chi-square distribution refers to one type known as the central chisquare distribution. The following discussion focuses on this type. As both negative and positive values square to a positive number, the curve only covers nonnegative numbers, with its left-hand tail starting from near zero and with a skew to the right. The curve is specified by its DEGREES OF FREEDOM (df), which is the number of unconstrained variables whose squares are being summed. The curve has its mean as the df, and the square root of twice the df forms its standard deviation. The highest point of the curve occurs at df – 1. As the number of df increases, the distribution takes on a more humpbacked shape with less skew but with a broader spread, given that its STANDARD DEVIATION will be increasing and that its furthest left point will remain at 0. Thus, a distribution with 5 df will have a mean of 5 and a standard deviation of 3.1, whereas a distribution with 10 df will have a mean of 10 and a standard deviation of 4.5. At high values of df, the curve tends toward a normal distribution, and in such (uncommon) cases, it is possible to revert to normal probabilities rather than calculating those for the chi-square distribution. The right tail probability of a chi-square distribution, which is the area in the right tail above a certain value, divided by the total area under the curve represents the likelihood that the chi-square value is randomly distributed. If the area in the tail beyond the given chi-square value represented, say, 5% of the area under the curve, then that chi-square value would be that at which we could be 95% confident that the association being tested held.
Application
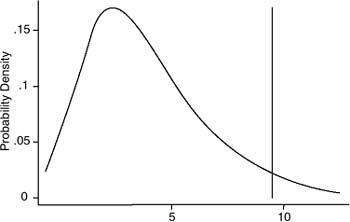
These probabilities have been calculated and tabulated for certain ranges of chi-square values and df. Conversely, tables are commonly produced that provide the chi-square values that will produce certain probability levels at certain df. For example, such tables tell us that we can be 95% confident at a chi-square value of 9.49 for 4 df. Figure 1 shows the chi-square distribution for 4 df (with mean = 4 and standard deviation = 2.83). The right tail probability is 5% at the point where the illustrated cutoff line takes the value of 9.49. This means that with statistics that approximate a chi-square distribution, we can compare the test statistic with such tables and ascertain its level of significance.
Figure 1 An Example of Chi-Square Distribution With 4 Degrees of Freedom
The most common such statistic is that resulting from Pearson's chi-square test. However, this test is not the only use of the CHI-SQUARE distribution. Other statistics that test the relationship between observed and “expected” or theoretical values (i.e., statistics that measure goodness of fit) approximate a chi-square distribution. Forexample, the likelihood ratiote ststatistic, also known as G2 or L2, which is derived from maximum likelihood method, approximates a chi-square distribution. It does this through a (natural) log transformation of the ratio between the maximum likelihood based on the null hypothesis (the −2 log likelihood) and the maximum likelihood based on the actual data values found. G2 is a statistic commonly quoted for log-linearmodels. Inpractice, chi-squareand G2 statistics, though distinct, tend to give similar results and lead to similar conclusions about the goodness of fit of a given model, although chi-square is more robust for small samples.
...
- Analysis of Variance
- Association and Correlation
- Association
- Association Model
- Asymmetric Measures
- Biserial Correlation
- Canonical Correlation Analysis
- Correlation
- Correspondence Analysis
- Intraclass Correlation
- Multiple Correlation
- Part Correlation
- Partial Correlation
- Pearson's Correlation Coefficient
- Semipartial Correlation
- Simple Correlation (Regression)
- Spearman Correlation Coefficient
- Strength of Association
- Symmetric Measures
- Basic Qualitative Research
- Basic Statistics
- F Ratio
- N(n)
- t-Test
- X¯
- Y Variable
- z-Test
- Alternative Hypothesis
- Average
- Bar Graph
- Bell-Shaped Curve
- Bimodal
- Case
- Causal Modeling
- Cell
- Covariance
- Cumulative Frequency Polygon
- Data
- Dependent Variable
- Dispersion
- Exploratory Data Analysis
- Frequency Distribution
- Histogram
- Hypothesis
- Independent Variable
- Measures of Central Tendency
- Median
- Null Hypothesis
- Pie Chart
- Regression
- Standard Deviation
- Statistic
- Causal Modeling
- Discourse/Conversation Analysis
- Econometrics
- Epistemology
- Ethnography
- Evaluation
- Event History Analysis
- Experimental Design
- Factor Analysis and Related Techniques
- Feminist Methodology
- Generalized Linear Models
- Historical/Comparative
- Interviewing in Qualitative Research
- Latent Variable Model
- Life History/Biography
- Log-Linear Models (Categorical Dependent Variables)
- Longitudinal Analysis
- Mathematics and Formal Models
- Measurement Level
- Measurement Testing and Classification
- Multilevel Analysis
- Multiple Regression
- Qualitative Data Analysis
- Sampling in Qualitative Research
- Sampling in Surveys
- Scaling
- Significance Testing
- Simple Regression
- Survey Design
- Time Series
- ARIMA
- Box-Jenkins Modeling
- Cointegration
- Detrending
- Durbin-Watson Statistic
- Error Correction Models
- Forecasting
- Granger Causality
- Interrupted Time-Series Design
- Intervention Analysis
- Lag Structure
- Moving Average
- Periodicity
- Serial Correlation
- Spectral Analysis
- Time-Series Cross-Section (TSCS) Models
- Time-Series Data (Analysis/Design)
- Trend Analysis
- Loading...
Get a 30 day FREE TRIAL
-
 Watch videos from a variety of sources bringing classroom topics to life
 -
Read modern, diverse business cases
-
Explore hundreds of books and reference titles

Read next

More like this
Sage Recommends
We found other relevant content for you on other Sage platforms.
Have you created a personal profile? Login or create a profile so that you can save clips, playlists and searches