Entry
Reader's guide
Entries A-Z
Subject index
Canonical Correlation Analysis
The basic idea of canonical correlation analysis is clearly illustrated by Russett (1969), who analyzed the association between some economic and political characteristics of 47 countries. Five indicators were used for measuring economic inequality: the division of farmland, the Gini coefficient, the percentage of tenant farmers, the gross national product (GNP) per capita, and the percentage of farmers. Russett measured political instability with four indicators: the instability of leadership, the level of internal group violence, the occurrence of internal war, and the stability of democracy. The research hypothesis was that Alexis de Tocqueville was right: There is not one nation that is capable of maintaining a democratic form of government for an extensive period of time if economic resources are unevenly distributed among its citizens. In other words, there is a significant association between the economic in equality and the political in stability of nations.
The two theoretical concepts in this research problem are “economic inequality” (X*) and “political instability” (Y*). They are called canonical variables with an expected high correlation, known as canonical correlation. The first canonical variable, X*, is measured by p = 5 indicators, X1 to X5, and we will consider X* as a linear combination (a weighted sum) of these X variables. In an analogous fashion, Y*, the second canonical variable, is a linear combination of the q = 4 indicators, Y1 to Y4. In the most general case, in which the X set contains p variables and the Y set q variables, the diagram can be represented as in Figure 1.
Figure 1 Canonical Correlation
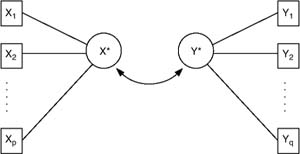
In Russett's (1969) research problem, the canonical correlation between the canonical variables X* and Y * is in fact a causal relationship because he asserts that nations with greater economic inequality display greater political instability. The arrow in the other direction, according to which the political characteristics would influence the economic characteristics, is not implied in de Tocqeville's or Russett's view. However, considering the fact that a canonical correlation is a “correlation,” the statistical analysis is not asymmetrical. For this reason, we do not draw a causal arrow from X* to Y * in the figure but a doublesided curved arrow, indicating that the question of causality remains open.
The Model of Canonical Correlation Analysis
In canonical correlation analysis, we want to see if there is a significant association between a set of X variables and a set of Y variables. For this reason, we look for a linear combination of the X set, X* = a1X1 + a2X2 +···+ apXp and a linear combination of the Y set, Y* =b1Y1 + b2Y2 +···+ bqYq in such a way that X* and Y * are maximally correlated. The two linear combinations, X* and Y *, are not observed. In our example, they have been given a name a priori: economic inequality and political instability. Sometimes such an a priori theory is absent at the start of research, and a name must be devised afterwards.
To find these two linear combinations (canonical variables X* and Y *), the a and b weights must be calculated. Canonical correlation analysis aims at determining these weights in such a way that the canonical correlation ρ is as high as possible. The square of this canonical correlation is the proportion of variance in one set (e.g., political characteristics) that is explained by the variance in the other set (e.g., economic characteristics).
...
- Analysis of Variance
- Association and Correlation
- Association
- Association Model
- Asymmetric Measures
- Biserial Correlation
- Canonical Correlation Analysis
- Correlation
- Correspondence Analysis
- Intraclass Correlation
- Multiple Correlation
- Part Correlation
- Partial Correlation
- Pearson's Correlation Coefficient
- Semipartial Correlation
- Simple Correlation (Regression)
- Spearman Correlation Coefficient
- Strength of Association
- Symmetric Measures
- Basic Qualitative Research
- Basic Statistics
- F Ratio
- N(n)
- t-Test
- X¯
- Y Variable
- z-Test
- Alternative Hypothesis
- Average
- Bar Graph
- Bell-Shaped Curve
- Bimodal
- Case
- Causal Modeling
- Cell
- Covariance
- Cumulative Frequency Polygon
- Data
- Dependent Variable
- Dispersion
- Exploratory Data Analysis
- Frequency Distribution
- Histogram
- Hypothesis
- Independent Variable
- Measures of Central Tendency
- Median
- Null Hypothesis
- Pie Chart
- Regression
- Standard Deviation
- Statistic
- Causal Modeling
- Discourse/Conversation Analysis
- Econometrics
- Epistemology
- Ethnography
- Evaluation
- Event History Analysis
- Experimental Design
- Factor Analysis and Related Techniques
- Feminist Methodology
- Generalized Linear Models
- Historical/Comparative
- Interviewing in Qualitative Research
- Latent Variable Model
- Life History/Biography
- Log-Linear Models (Categorical Dependent Variables)
- Longitudinal Analysis
- Mathematics and Formal Models
- Measurement Level
- Measurement Testing and Classification
- Multilevel Analysis
- Multiple Regression
- Qualitative Data Analysis
- Sampling in Qualitative Research
- Sampling in Surveys
- Scaling
- Significance Testing
- Simple Regression
- Survey Design
- Time Series
- ARIMA
- Box-Jenkins Modeling
- Cointegration
- Detrending
- Durbin-Watson Statistic
- Error Correction Models
- Forecasting
- Granger Causality
- Interrupted Time-Series Design
- Intervention Analysis
- Lag Structure
- Moving Average
- Periodicity
- Serial Correlation
- Spectral Analysis
- Time-Series Cross-Section (TSCS) Models
- Time-Series Data (Analysis/Design)
- Trend Analysis
- Loading...
Get a 30 day FREE TRIAL
-
 Watch videos from a variety of sources bringing classroom topics to life
 -
Read modern, diverse business cases
-
Explore hundreds of books and reference titles

Read next

More like this
Sage Recommends
We found other relevant content for you on other Sage platforms.
Have you created a personal profile? Login or create a profile so that you can save clips, playlists and searches