Entry
Reader's guide
Entries A-Z
Subject index
Total Fertility Rate
Total fertility rate (TFR) is among the most commonly used fertility measures. As a period measure, TFR usually examines fertility cross-sectionally. TFR represents the average number of children a woman would have, assuming that current age-specific fertility rates (ASFRs) remain constant throughout her childbearing years (ages 15—49) and she were to survive to the end of her reproductive cycle.
ASFR is calculated by dividing the number of children born to women in an age group by the number of women in that age group. The equation for ASFR is:
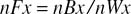
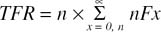
where F = fertility, B = births, W = women, x = age at the beginning of the interval, and n = number of years the age interval spans (usually 5-year intervals). TFR builds on ASFR by summing the rates for each age group and multiplying by the length of the age interval:
Another way to measure TFR is through cohort reports of Children Ever Born (CEB). CEB tracks a cohort of women's reproductive histories from the beginning of their childbearing years through completion, resulting in a measure representing the average of all children each woman actually bore. Usually data for AFSR, TFR, and CEB come from surveys or midyear population estimates combined with vital statistics on the number of births. When information about births is collected retrospectively, there is the danger of missing children who died shortly after childbirth.
TFR varies widely throughout the world today and has changed significantly over time. Levels range from well above replacement fertility (TFR = 2.1, an average of two children replacing one's parents, plus a one-tenth factor allowing for under-age-15 child mortality) to below-replacement fertility. In the early 1970s, TFR for the world was 4.5; by 2005, it had fallen to 2.6. For the same periods, in Latin America and the Caribbean, TFR dropped from 5.1 to 2.5. In 2005, Asia, excluding China, had a TFR of 2.8 (it was above 5.0 in the 1970s), with Taiwan and South Korea having among the lowest TFRs in the world at 1.1. European fertility levels were already reaching replacement in the 1970s, but now have dropped significantly below replacement to 1.4. TFR in the United States has remained stable since the 1970s at 2.0. TFR in sub-Saharan Africa has gone from 6.8 to 5.4 during this period; but in 2005, it ranged from a high of 7.9 in Niger to a low of 1.8 in Mauritius. Regional and national TFRs often hide substantial ethnic and racial variation.
Historical changes in TFRs often relate to new contraceptive technologies, access to services, and policies. In China, for example, TFR was close to 6.0 in the early 1970s, prior to the “later-longer-fewer” family planning campaign and the more widely known one-child policy. In 2005, TFR was 1.6; many scholars speculate that this drastic, rapid fertility decline is having significant effects on China's economy, marriage market, and care for the elderly. Changes in fertility across space and time have important context-specific influences on social and demographic processes.
Further Readings
...
- Aging and the Life Course
- Community, Culture, and Change
- Communitarianism
- Community
- Cults
- Cultural Capital
- Cultural Diffusion
- Cultural Imperialism
- Cultural Lag
- Cultural Relativism
- Cultural Values
- Culture of Dependency
- Culture of Poverty
- Culture Shock
- Culture Wars
- Cyberspace
- Digital Divide
- Faith-Based Social Initiatives
- Focus Groups
- Fundamentalism
- Gambling
- Gangsta Rap
- Institutional Ethnography
- Islam and Modernity
- Latent Functions
- Manifest Functions
- Mass Media
- Media
- Norms
- Obscenity
- Prestige
- Privacy
- Role Conflict
- Role Strain
- Secularization
- Social Change
- Social Conflict
- Social Disorganization
- Social Institutions
- Social Mobility
- Social Networks
- Subcultures
- Values
- Crime and Deviance
- Abuse, Child Sexual
- Abuse, Elderly
- Abuse, Intimate Partner
- Abuse, Sibling
- Addiction
- Alcoholism
- Arson
- Assault
- Binge Drinking
- Bullying
- Capital Punishment
- Child Abduction
- Community Corrections
- Community Crime Control
- Community Service
- Corporate Crime
- Corruption
- Crime
- Crime Rates
- Crime Waves
- Crime, Fear of
- Cultural Criminology
- Decriminalization
- Deviance
- Differential Association
- Domestic Violence
- Drug Abuse
- Drug Abuse, Crime
- Drug Abuse, Prescription Narcotics
- Drug Abuse, Sports
- Drunk Driving
- Eating Disorders
- Entrapment
- Environmental Crime
- Environmental Justice
- Ethnic Cleansing
- Extramarital Sex
- Felony
- Female Genital Cutting
- Gangs
- Genocide
- Gun Control
- Hate Crimes
- Hate Groups
- Hate Speech
- Holocaust
- Human Trafficking
- Identity Theft
- Illegitimate Opportunity Structures
- Incarceration, Societal Implications
- Incest
- Innocence Project
- Judicial Discretion
- Justice
- Juvenile Delinquency
- Juvenile Institutionalization, Effects of
- Juvenile Justice System
- Labor Racketeering
- Lynching
- Mass Murder
- Misdemeanor
- Murder
- Neighborhood Watch
- Obscenity
- Organized Crime
- Parole
- PATRIOT Act
- Pedophilia
- Piracy, Intellectual Property
- Plagiarism
- Plea Bargaining
- Police
- Police Stress
- Policing, Community
- Policing, Strategic
- Pornography
- Pornography and the Internet
- Pornography, Child
- Prison
- Prison, Convict Criminology
- Prisons, Gangs
- Prisons, Overcrowding
- Prisons, Pregnancy and Parenting
- Prisons, Privatization
- Prisons, Riots
- Prisons, Violence
- Probation
- Property Crime
- Prostitution
- Prostitution, Child
- Psychopath
- Racial Profiling
- Rape
- Rape, Acquaintance or Date
- Rape, Marital
- Rape, Statutory
- Reasonable Suspicion
- Recidivism
- Restorative Justice
- Riots
- Road Rage
- School Violence
- Sentencing Disparities
- Serial Murder
- Sex Trafficking
- Shoplifting
- Sociopath
- Stalking
- State Crimes
- Status Offenses
- Subculture of Violence Hypothesis
- Sweatshop
- Terrorism
- Terrorism, Counterterrorism Approaches
- Terrorism, Domestic Spying
- Theft
- Three Strikes Laws
- Torture
- Total Institution
- Twelve-Step Programs
- Uniform Crime Report
- Victim-Offender Mediation Model
- Victimization
- Victimless Crimes
- Vigilantism
- Violence
- Violence, Collective
- Violence, Sexual
- Violent Crime
- War Crimes
- Zero-Tolerance Policies
- Economics and Work
- Alienation
- Anomie
- Anti-Globalization Movement
- Automation
- Bankruptcy, Business
- Bankruptcy, Personal
- Budget Deficits, U.S.
- Bureaucracy
- Burnout
- Capital Flight
- Conglomerates
- Conspicuous Consumption
- Contingent Work
- Corporate State
- Culture of Dependency
- Culture of Poverty
- Current Account Deficit
- Debt Service
- Deindustrialization
- Dependency Ratio
- Deregulation
- Downsizing
- Economic Development
- Economic Restructuring
- Evaluation Research
- Gini Coefficient
- Global Economy
- Globalization
- Income Disparity
- Inflation
- Intergenerational Mobility
- Interlocking Directorates
- Job Satisfaction
- Labor Force Participation Rate
- Labor Market
- Labor Movement
- Labor Sectors
- Labor Unions
- Labor, Child
- Labor, Division of
- Literacy, Economic
- Living Wage
- Megamergers
- Military-Industrial Complex
- Mixed Economy
- Mommy Track
- Monopolies
- Multinational Corporations
- Occupational Safety and Health
- Oligarchy
- Oligopoly
- Outsourcing
- Pensions and Social Security
- Pink-Collar Occupations
- Postindustrialism
- Scientific Management
- Second Shift
- Segregation, Occupational
- Service Economy
- Skills Mismatch
- Social Capital
- Socialism
- Split Labor Market
- Sweatshop
- Taylorism
- Trickle-Down Economics
- Underclass Debate
- Underemployment
- Underground Economy
- Unemployment
- Wage Gap
- Wealth Disparities
- Wealth, U.S. Consumer
- World-Systems Analysis
- Education
- Brown v. Board of Education
- Ability Grouping
- Academic Standards
- Attention Deficit Hyperactivity Disorder
- Basic Skills Testing
- Bilingual Education
- Bullying
- Charter Schools
- Class
- Digital Divide
- Disability and Disabled
- Education, Academic Performance
- Education, Inner-City Schools
- Education, Policy and Politics
- Education, School Privatization
- Education, Silencing
- Education, Special Needs Children
- Educational Equity
- English as a Second Language
- Evaluation Research
- Grade Inflation
- Hidden Curriculum
- Illiteracy, Adult in Developed Nations
- Illiteracy, Adult in Developing Nations
- IQ Testing
- Labeling Theory
- Learning Disorders
- Life Chances
- Literacy, Adult
- Magnet Schools
- Minimum Competency Test
- Nature-Nurture Debate
- No Child Left Behind Act
- Oppositional Culture Theory
- Plagiarism
- Redistricting, School Districts
- School Dropouts
- School Funding
- School Prayer
- School Segregation
- School Violence
- School Vouchers
- Segregation, De Facto
- Sex Education
- Social Promotions
- Standardized Testing
- Stereotyping
- Title IX
- Family
- Adoption
- Adoption, Gay and Lesbian
- Adoption, Transracial
- Boomerang Generation
- Child Care Safety
- Child Neglect
- Cohabitation
- Divorce
- Domestic Partnerships
- Domestic Violence
- Dual-Income Families
- Extramarital Sex
- Family
- Family Leave Act
- Family Reunification
- Family, Blended
- Family, Dysfunctional
- Family, Extended
- Family, Nuclear
- Fathers' Rights Movement
- Foster Care
- Foster Children, Aging Out
- Intermarriage
- Missing Children
- Mommy Track
- Premarital Sex
- Runaways
- Same-Sex Marriage
- Sandwich Generation
- Second Shift
- Single Mothers
- Teenage Pregnancy and Parenting
- Transition Living
- Transnational Families
- Gender Inequality and Sexual Orientation
- Adoption, Gay and Lesbian
- Bisexuality
- Body Image
- Comparable Worth
- Feminism
- Feminist Theory
- Feminization of Poverty
- Gender Identity and Socialization
- Gini Coefficient
- Glass Ceiling
- Homophobia
- Homosexuality
- Hostile Environment
- Income Disparity
- Inequality
- Mommy Track
- Same-Sex Marriage
- Second Shift
- Segregation, Gender
- Standpoint Theory
- Stratification, Gender
- Transgender and Transsexuality
- Wage Gap
- Women's Rights Movement
- Health
- Accidents, Automobile
- Alcoholism
- Attention Deficit Hyperactivity Disorder
- Bioethics
- Chronic Diseases
- Codependency
- Deinstitutionalization
- Dementia
- Disability and Disabled
- Eating Disorders
- Epidemics, Management of
- Eugenics
- Euthanasia
- Famine
- Genetic Engineering
- Genetic Theories
- Genetically Altered Foods
- Health Care, Access
- Health Care, Costs
- Health Care, Ideological Barriers to Change
- Health Care, Insurance
- Hospices
- Learning Disorders
- Life Expectancy
- Managed Care
- Medicaid
- Medical Malpractice
- Medical-Industrial Complex
- Medicalization
- Medicare
- Mental Depression
- Mental Health
- Neuroses
- Nursing Home Care
- Obesity
- Pandemics
- Post-Traumatic Stress Disorder
- Psychopath
- Psychoses
- Secondhand Smoke
- Sexually Transmitted Diseases
- Smoking
- Socialized Medicine
- Sociopath
- Stressors
- Suicide
- Total Institution
- Twelve-Step Programs
- Vegetarian Movement
- Housing and Urbanization
- Capital Flight
- Economic Restructuring
- Edge Cities
- Gentrification
- Housing
- Inner City
- Inner-Ring Suburb
- Invasion-Succession
- Mass Transit
- Megacities
- Megalopolis
- Political Fragmentation
- Postindustrialism
- Segregation, Residential
- Service Economy
- Traffic Congestion
- Urban Decline
- Urban Infrastructure
- Urban Renewal
- Urban Sprawl
- Urban Underclass
- Urbanization
- White Flight
- Politics, Power, and War
- Arms Control
- Citizen Militias
- Citizenship
- Civil Rights
- Claims Making
- Collateral Damage
- Collective Consciousness
- Colonialism
- Conflict Resolution
- Conservative Approaches
- Corruption
- Culture Wars
- Demilitarization
- Democracy
- Eminent Domain
- False Consciousness
- Gerrymandering
- Groupthink
- Hegemony
- Human Rights
- Identity Politics
- Imperialism
- Mediation
- Militarism
- Moral Entrepreneurs
- Nation Building
- Nuclear Proliferation
- PATRIOT Act
- Peacekeeping
- Political Action Committees
- Political Fragmentation
- Politics and Christianity
- Power
- Power Elite
- Propaganda
- Public Opinion
- Public-Private Dichotomy
- Redistricting, Congressional Districts
- Segregation, De Jure
- Situation Ethics
- Social Control
- Special Interest Groups
- Surveillance
- Terrorism
- Terrorism, Counterterrorism Approaches
- Terrorism, Domestic Spying
- Think Tanks
- Totalitarianism
- Voter Apathy
- War
- War Crimes
- Population and Environment
- Acid Rain
- Baby Boomers
- Birth Rate
- Contraception
- Deforestation
- Demographic Transition Theory
- Desertification
- Disasters
- Ecosystem
- Environment, Eco-Warriors
- Environment, Hazardous Waste
- Environment, Pollution
- Environment, Runoff and Eutrophication
- Environment, Sewage Disposal
- Environmental Crime
- Environmental Degradation
- Environmental Hazards
- Environmental Justice
- Environmental Movement
- Environmental Racism
- Erosion
- Extinction
- Fertility
- Global Warming
- Infant Mortality
- Mortality Rate
- Neo-Malthusians
- NIMBYism
- Nonrenewable Resources
- Ozone
- Population Growth
- Population, Graying of
- Social Movements
- Sustainable Development
- Total Fertility Rate
- Toxic Waste
- Urbanization
- Water Organization
- Water Quality
- Water Resources
- Zero Population Growth
- Poverty and Social Class
- Aid to Families with Dependent Children
- Class
- Class Consciousness
- Codependency
- Evaluation Research
- Feminization of Poverty
- Food Insecurity and Hunger
- Gini Coefficient
- Hierarchy of Needs
- Homelessness
- Homelessness, Youth
- Housing
- Income Disparity
- Inequality
- Living Wage
- Means-Tested Programs
- Medicaid
- Personal Responsibility and Work Opportunity Reconciliation Act
- Poverty
- Poverty, Children Worldwide
- Relative Deprivation
- Single Mothers
- Socioeconomic Status
- Stratification, Social
- Temporary Assistance for Needy Families
- Trickle-Down Economics
- Underclass Debate
- Underemployment
- Unemployment
- Wealth Disparities
- Welfare
- Welfare Capitalism
- Welfare States
- Working Poor
- Race and Ethnic Relations
- Brown v. Board of Education
- Plessy v. Ferguson
- Acculturation
- Adoption, Transracial
- Affirmative Action
- Afrocentricity
- American Dream
- Americanization
- Anti-Semitism
- Apartheid
- Assimilation
- Asylum
- Backlash
- Bereavement, Effect by Race
- Bilingual Education
- Biracial
- Black Codes
- Black Nationalism
- Black Power Movement
- Blaming the Victim
- Bootstrap Theory
- Bracero Program
- Chicano Movement
- Cultural Capital
- Cultural Diffusion
- Cultural Imperialism
- Cultural Relativism
- Cultural Values
- Culture Shock
- Deportation
- Dillingham Flaw
- Discrimination
- Discrimination, Institutional
- English as a Second Language
- English-Only Movement
- Equal Protection
- Ethnic Cleansing
- Ethnic Group
- Ethnicity
- Ethnocentrism
- Ethnomethodology
- Genocide
- Hate Crimes
- Hate Groups
- Hate Speech
- HIV/AIDS, Reaching High-Risk Populations
- Holocaust
- Hypersegregation
- Identity Politics
- Immigration
- Immigration, United States
- Income Disparity
- Index of Dissimilarity
- Inequality
- Infant Mortality
- Intermarriage
- Internal Colonialism
- Islam and Modernity
- Jim Crow
- Labeling Theory
- Labor, Migrant
- Life Chances
- Lynching
- Marginality
- Melting Pot
- Middleman Minority
- Migration, Global
- Minority Group
- Miscegenation
- Multiculturalism
- Multiracial Identity
- Native Americans, Cultural Degradation
- Native Americans, Reservation Life
- Nativism
- Nature-Nurture Debate
- One-Drop Rule
- Oppositional Culture Theory
- Personal Responsibility and Work Opportunity Reconciliation Act
- Personhood, Evolving Notions of
- Pluralism
- Politics and Christianity
- Prejudice
- Race
- Race-Blind Policies
- Racial Formation Theory
- Racial Profiling
- Racism
- Redlining
- Refugees
- Religion and Conflict
- Religion and Politics
- Religion, Civil
- Religious Extremism
- Religious Holidays as Social Problems
- Religious Prejudice
- Reparations
- Repatriation
- Resettlement
- Sanctuary Movement
- Scapegoating
- Segmented Assimilation
- Segregation
- Segregation, De Facto
- Segregation, De Jure
- Segregation, Residential
- Slavery
- Social Distance
- Social Exclusion
- Split Labor Market
- Stereotyping
- Stratification, Gender
- Stratification, Race
- Stratification, Social
- Transnational Families
- Underground Economy
- Undocumented Immigrants
- White Flight
- White Supremacy
- Xenophobia
- Social Movements
- Anti-Globalization Movement
- Black Power Movement
- Chicano Movement
- Countermovements
- Environmental Movement
- Fathers'Rights Movement
- Labor Movement
- Prohibition
- Resource Mobilization
- Sanctuary Movement
- Social Movements
- Social Revolutions
- Temperance Movement
- Transnational Activism
- Transnational Social Movement
- Vegetarian Movement
- Women's Rights Movement
- Social Theory
- Activity Theory
- Bootstrap Theory
- Conflict Perspective
- Demographic Transition Theory
- Differential Association
- Disengagement Theory
- False Consciousness
- Feminist Theory
- Labeling Theory
- Modernization Theory
- Oppositional Culture Theory
- Postmodernism
- Queer Theory
- Racial Formation Theory
- Rational Choice Theory
- Self-Fulfilling Prophecy
- Social Bond Theory
- Social Constructionist Theory
- Split Labor Market
- Standpoint Theory
- Strain Theory
- Theory
- Substance Abuse
- Accidents, Automobile
- Addiction
- Alcoholism
- Anti-Drug Abuse Act of 1986
- Binge Drinking
- Club Drugs
- Cocaine and Crack
- Codependency
- Decriminalization
- Deterrence Programs
- Deviance
- Drug Abuse
- Drug Abuse, Crime
- Drug Abuse, Prescription Narcotics
- Drug Abuse, Sports
- Drug Subculture
- Drunk Driving
- Evaluation Research
- Fetal Alcohol Syndrome
- Fetal Narcotic Syndrome
- Gateway Drugs
- Harm Reduction Drug Policy
- Heroin
- Labeling Theory
- Marijuana
- Methadone
- Prohibition
- Psychoactive Drugs, Misuse of
- Rehabilitation
- Stigma
- Temperance Movement
- Therapeutic Communities
- Twelve-Step Programs
- Zero-Tolerance Policies
- Loading...
Get a 30 day FREE TRIAL
-
 Watch videos from a variety of sources bringing classroom topics to life
 -
Read modern, diverse business cases
-
Explore hundreds of books and reference titles

Read next

More like this
Sage Recommends
We found other relevant content for you on other Sage platforms.
Have you created a personal profile? Login or create a profile so that you can save clips, playlists and searches