Entry
Reader's guide
Entries A-Z
Subject index
Graph Theory
Graph theory, primarily a subdiscipline of mathematics, is nowadays applied in various scientific disciplines in social and natural sciences as well as in computer sciences. Especially in social network analysis, graph theory plays an important role as a tool for the visualization and modeling of networks. Defining terms is crucial within the sciences, and it is even more important in the context of graph theory. Its comprehensive terminology is built by simple and commonly used everyday words; however, they are used in highly specific and technical ways.
Specific Definitions
Applying graph theory as a tool to social network analysis allows network data, which generally are expressed by matrices, to be translated into formal assumptions. Graphs within the framework of social network analysis describe a system of interrelated objects. In graph theory, a network is defined as a clearly specified set of nodes, N = {n1, n2,…, ng}, as well as the corresponding set of lines, L = {11, 12,…, 1L}, which connect the nodes. In other words, for the analysis of networks within the framework of graph theory, the definition of social entities is essential. Social entities do not necessarily have to be individuals; they may also be a collective of persons or even juristic persons such as corporations or states.
On the other hand, the definition of the modality of connections between those entities is needed. These connections, for instance, can be relations based on exchange, communication, emotions, power, or cognition. In doing so, the nodes symbolize the particular actors in graph theory. The lines, however, represent their appropriate relations. As the terminology is not completely standard, the terms vertices or points are used for nodes, and edges or arcs are used for what in this discussion are called lines. If two actors are connected directly by a line, they are understood to be adjacent and building the neighborhood. The size of the point's neighborhood is measured by its degree (of connections).
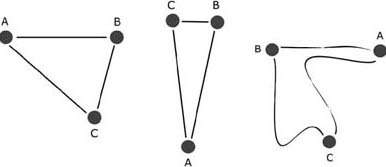
It is crucial to keep in mind that graphs always mean, in this situation, the combination of nodes and lines—not only do the lines represent a graph and not only one single connection between two nodes, but the whole composition of all given links form a graph. Furthermore, neither the position of the nodes in the plane nor the length of the lines is of any importance. The lines do not even have to be straight; straight lines are only conventionally used in matters of clarity within the drawing of the network. This means that one specific network may have more than one definite appearance (see Figure 1).
Figure 1 Three Different Drawings of One Single Graph
The very complex drawings of social networks are well known and sometimes also very impressive in their complexities. If the drawing of complex networks gets too confusing, it is useful to divide the graph into two or more subgraphs. Although a random division of graphs is possible, the criteria for it mostly depend on the particular research interest.
To increase the intricacy of graphs, lines can be supplemented by arrows, which indicate the relational direction between two nodes. Those graphs, whose nodes are connected by directed lines, are called directed graphs, or digraphs (see Figure 2). This means that a directed graph may, for example, indicate the direction of the communication flow, the movement of capital, or the imbalance of power between two actors. If there is no direction indicated, the graph is called undirected.
...
- History of Social Networking
- American Revolutionary War
- Ancient China
- Ancient Egypt
- Ancient Greece
- Ancient India
- Ancient Rome
- Civil War, U.S.
- Colonial America
- Earliest Civilizations
- History of Social Networks 1865–1899
- History of Social Networks 1900–1929
- History of Social Networks 1930–1940
- History of Social Networks 1941–1945
- History of Social Networks 1946–1959
- History of Social Networks 1960–1975
- History of Social Networks 1976–1999
- History of Social Networks 2000–Present
- Industrial Revolution
- Internet History and Networks
- Middle Ages
- Native Americans
- Renaissance
- World-Systems Networks
- Local U.S. Social Networks by State
- Alabama
- Alaska
- Arizona
- Arkansas
- California
- Colorado
- Connecticut
- Delaware
- District of Columbia
- Florida
- Georgia (State)
- Hawaii
- Idaho
- Illinois
- Indiana
- Iowa
- Kansas
- Kentucky
- Louisiana
- Maine
- Maryland
- Massachusetts
- Michigan
- Minnesota
- Mississippi
- Missouri
- Montana
- Nebraska
- Nevada
- New Hampshire
- New Jersey
- New Mexico
- New York
- North Carolina
- North Dakota
- Ohio
- Oklahoma
- Oregon
- Pennsylvania
- Rhode Island
- South Carolina
- South Dakota
- Tennessee
- Texas
- Utah
- Vermont
- Virginia
- Washington
- West Virginia
- Wisconsin
- Wyoming
- Privacy and Rights in Social Networks
- Social Network Analysis and Issues
- Affiliation Networks
- Agent-Based Models
- Bipartite networks
- Blockmodeling
- Cohesion Networks
- Complexity
- Cooperation/Coordination
- Dating
- Egocentric Networks
- Embeddedness
- Exchange Networks
- Exponential Randon Graph Models (ERGM/p*)
- Graph Theory
- Homophily
- Longitudinal Networks
- Multiplexed Networks
- Network Analysis Software
- Network Evolution
- Network Indicators
- Network Simulations
- Network Theory
- Network Visualization
- Paths/Walks/Cycles
- Pornography Networks
- Power Law Networks
- Preferential Attachment
- Prominence
- Proximity/Space
- Q-Analysis
- Random Graph Models
- Reciprocity
- Self-Organizing Networks
- Semantic Networks
- Small World
- Social Capital
- Social Influence
- Social Support
- Stalking
- Structural Equivalence
- Structural Holes
- Structural Theory
- Tie Length
- Tie Strength
- Tie Utility
- Tipping Point
- Triads
- Trust and Networks
- Two-Mode Networks
- Word Networks
- Social Networking around the World
- Afghanistan
- Algeria
- Angola
- Argentina
- Armenia
- Australia
- Austria
- Azerbaijan
- Bangladesh
- Belarus
- Belgium
- Benin
- Bolivia
- Brazil
- Bulgaria
- Burkina Faso
- Burundi
- Côte d'Ivoire
- Cambodia
- Cameroon
- Canada
- Central African Republic
- Chad, Republic of
- Chile
- China
- Colombia
- Congo, Democratic Republic of the
- Costa Rica
- Croatia
- Cuba
- Czech Republic
- Denmark
- Dominican Republic
- Ecuador
- Egypt
- El Salvador
- Eritrea
- Estonia
- Ethiopia
- Finland
- France
- Georgia (Country)
- Germany
- Ghana
- Greece
- Guatemala
- Guinea
- Haiti
- Honduras
- Hungary
- India
- Indonesia
- Iran
- Iraq
- Ireland
- Israel
- Italy
- Japan
- Jordan
- Kazakhstan
- Kenya
- Kurdistan
- Kyrgyzstan
- Laos
- Latvia
- Libya
- Lithuania
- Malawi
- Malaysia
- Mali
- Mexico
- Morocco
- Mozambique
- Myanmar
- Nepal
- Netherlands
- New Zealand
- Nicaragua
- Niger
- Nigeria
- North Korea
- Norway
- Pakistan
- Papua New Guinea
- Paraguay
- Peru
- Philippines
- Poland
- Portugal
- Romania
- Russia
- Rwanda
- Saudi Arabia
- Senegal
- Serbia
- Sierra Leone
- Singapore
- Slovakia
- Somalia
- South Africa
- South Korea
- Spain
- Sri Lanka
- Sudan
- Sweden
- Switzerland
- Syria
- Tajikistan
- Tanzania
- Thailand
- Togo
- Tunisia
- Turkey
- Turkmenistan
- Uganda
- Ukraine
- United Arab Emirates
- United Kingdom
- United States
- Uzbekistan
- Venezuela
- Vietnam
- Yemen
- Zambia
- Zimbabwe
- Social Networking Communities
- Adults-Only Communities
- Artists Communities
- Blogs and Networks
- Books Communities
- Classmates
- College Students Communities
- CouchSurfing
- Deviant Communities
- Elitist Communities
- Games Communities
- Investing Communities
- Local Political Activism Communities
- Mothers Communities
- Movie and TV Series Communities
- Music Communities
- MySpace
- Newsgroups
- People with Disabilities Communities
- Religious Communities
- Scientific Communities
- Teen Communities
- Wikipedia
- Yahoo!
- YouTube and Video Exchange
- Social Networking Organizations
- AARP (American Association of Retired Persons)
- Alcoholics Anonymous (AA)
- American Civil Liberties Union (ACLU)
- Charity Organizations
- Conservative Organizations
- Government Networks
- Greenpeace
- International Network for Social Network Analysis (INSNA)
- Liberal Organizations
- National Association for the Advancement of Colored People (NAACP)
- Neighborhood Organizations
- Nongovernmental Organizations (NGOs)
- Unions
- United Nations
- United Service Organizations (USO)
- Social Science of Networking
- Alumni Networks
- Anthropological Networks
- Bibliometrics/Citation Networks
- Cancer Networks
- Children's Networks
- Cognitive Networks
- Communication Networks
- Conspiracy Theory and Gossip Networks
- Corporate Networking
- Diet Networks
- Diffusion/Contagion Networks
- Economic Networks
- Educational Networks
- Employment Networks
- Entrepreneurial Networks
- Environmental Activism
- Ethnicity and Networks
- Fan Networks
- Fraternities
- Game Theory and Networks
- Gangs
- Gender and Networks
- Health Networks
- Hobby Networks
- Human Rights Networks
- Infectious Disease Networks
- Innovation Networks
- Interdepartmental Networks
- International Networks
- Interorganizational/Interlocks
- Kinship Networks
- Knowledge Networks
- Leadership Networks
- Letter-Writing
- Military Networks
- Neighborhood Organizations
- Network Psychology
- Network Visualization
- Organizational Networks
- Policy Networks
- Religious Communities
- Scholar Networks
- Senior Networks
- Small Group Networks
- Sororities
- Sports Networks
- Telecommunication Networks
- Twelve-Step Programs
- Urban Networks
- War and Networks
- Women's Networks
- Technology and Social Networking
- Loading...
Get a 30 day FREE TRIAL
-
 Watch videos from a variety of sources bringing classroom topics to life
 -
Read modern, diverse business cases
-
Explore hundreds of books and reference titles

Read next

More like this
Sage Recommends
We found other relevant content for you on other Sage platforms.
Have you created a personal profile? Login or create a profile so that you can save clips, playlists and searches