Entry
Reader's guide
Entries A-Z
Subject index
True Score
True score, which is the primary element of true score theory, is the individual's score on a measure if there was no error. Some classic theories of measurement believe that a true score can be estimated through repeated testing. The concept of true score is important to research design as it emphasizes that there is some error involved in any type of measurement (e.g., height, weight, self-esteem, IQ, and heart rate). In this entry, the definition of a true score is developed and explored with respect to reliability, measurement error, and classic extensions. Finally, some alternatives to true score theory are briefly presented.
Definition
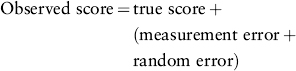
True score can also be defined with respect to the idea of an observed score. In short, the observed score is the true score plus some error. Symbolically, the equation is

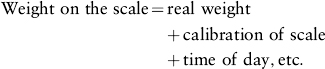
where Xo is the observed score or the participant's score on a measure (e.g., the participant's score on Prochaska's smoking decisional balance inventory) and Xt is the participants true score or what is really of interest. In addition, E represents the error term that can be comprised of measurement error (i.e., systematic error) and some random error (i.e., unsystematic error). For example, real body weight (i.e., the true score of our weight) is never really known as it fluctuates with time of day, gravitational pull, retention of water, clothing choice, and many other variables. The number viewed on a scale would be considered an observed score (the true weight plus some error). The observed weight on the scale is based on the real weight with the addition of the calibration of the instrument used to measure weight plus the other variables that might interfere with the scales ability to properly measure weight. Conceptually, the formula would be
or
Although weight can be measured on a scale, it is important to remember that it is estimated. Without knowing the amount of error or the true score, the observed weight is actually meaningless. The obtained weight (or measurement on a myriad of other psychological measures or tests) could be greatly flawed (i.e., have a large amount of error) or very precise (i.e., have a little amount of error). Without multiple measurements on the individual or test subject or replication studies, it is difficult to know how much error is in the measurement.
Assumptions of True Score Theory
Because of the theoretical nature of the true score, Xt, it is not possible to know its value. Although it cannot be directly measured, there are some basic assumptions (according to true score theory and classic measurement theory) concerning the true score. As mentioned earlier, the first assumption is that all observed variables contain some error. If there was no error, then the true score would equal the observed score Xo. Another assumption is that the true score and the error score are independent. In other words, the correlation between the true score and the error score is zero (signifying that the movement in the error score has no impact on the value of the true score). The error score E is considered completely random. For example, if a baby weighs 12 pounds (her true score) and is weighed multiple times, then the amount the baby's weight fluctuates (thereby showing the differential error values) does not impact the baby's real weight.
...
- Descriptive Statistics
- Distributions
- Graphical Displays of Data
- Hypothesis Testing
- Alternative Hypotheses
- Beta
- Critical Value
- Decision Rule
- Hypothesis
- Nondirectional Hypotheses
- Nonsignificance
- Null Hypothesis
- One-Tailed Test
- p Value
- Power
- Power Analysis
- Significance Level, Concept of
- Significance Level, Interpretation and Construction
- Significance, Statistical
- Two-Tailed Test
- Type I Error
- Type II Error
- Type III Error
- Important Publications
- “Coefficient Alpha and the Internal Structure of Tests”
- “Convergent and Discriminant Validation by the Multitrait-Multimethod Matrix”
- “Meta-Analysis of Psychotherapy Outcome Studies”
- “On the Theory of Scales of Measurement”
- “Probable Error of a Mean, The”
- “Psychometric Experiments”
- “Sequential Tests of Statistical Hypotheses”
- “Technique for the Measurement of Attitudes, A”
- “Validity”
- Aptitudes and Instructional Methods
- Doctrine of Chances, The
- Logic of Scientific Discovery, The
- Nonparametric Statistics for the Behavioral Sciences
- Probabilistic Models for Some Intelligence and Attainment Tests
- Statistical Power Analysis for the Behavioral Sciences
- Teoria Statistica Delle Classi e Calcolo Delle Probabilità
- Inferential Statistics
- Association, Measures of
- Coefficient of Concordance
- Coefficient of Variation
- Coefficients of Correlation, Alienation, and Determination
- Confidence Intervals
- Margin of Error
- Nonparametric Statistics
- Odds Ratio
- Parameters
- Parametric Statistics
- Partial Correlation
- Pearson Product-Moment Correlation Coefficient
- Polychoric Correlation Coefficient
- Q-Statistic
- R2
- Randomization Tests
- Regression Coefficient
- Semipartial Correlation Coefficient
- Spearman Rank Order Correlation
- Standard Error of Estimate
- Standard Error of the Mean
- Student's t Test
- Unbiased Estimator
- Weights
- Item Response Theory
- Mathematical Concepts
- Measurement Concepts
- Organizations
- Publishing
- Qualitative Research
- Reliability of Scores
- Research Design Concepts
- Aptitude-Treatment Interaction
- Cause and Effect
- Concomitant Variable
- Confounding
- Control Group
- Interaction
- Internet-Based Research Method
- Intervention
- Matching
- Natural Experiments
- Network Analysis
- Placebo
- Replication
- Research
- Research Design Principles
- Treatment(s)
- Triangulation
- Unit of Analysis
- Yoked Control Procedure
- Research Designs
- A Priori Monte Carlo Simulation
- Action Research
- Adaptive Designs in Clinical Trials
- Applied Research
- Behavior Analysis Design
- Block Design
- Case-Only Design
- Causal-Comparative Design
- Cohort Design
- Completely Randomized Design
- Cross-Sectional Design
- Crossover Design
- Double-Blind Procedure
- Ex Post Facto Study
- Experimental Design
- Factorial Design
- Field Study
- Group-Sequential Designs in Clinical Trials
- Laboratory Experiments
- Latin Square Design
- Longitudinal Design
- Meta-Analysis
- Mixed Methods Design
- Mixed Model Design
- Monte Carlo Simulation
- Nested Factor Design
- Nonexperimental Design
- Observational Research
- Panel Design
- Partially Randomized Preference Trial Design
- Pilot Study
- Pragmatic Study
- Pre-Experimental Designs
- Pretest-Posttest Design
- Prospective Study
- Quantitative Research
- Quasi-Experimental Design
- Randomized Block Design
- Repeated Measures Design
- Response Surface Design
- Retrospective Study
- Sequential Design
- Single-Blind Study
- Single-Subject Design
- Split-Plot Factorial Design
- Thought Experiments
- Time Studies
- Time-Lag Study
- Time-Series Study
- Triple-Blind Study
- True Experimental Design
- Wennberg Design
- Within-Subjects Design
- Zelen's Randomized Consent Design
- Research Ethics
- Research Process
- Clinical Significance
- Clinical Trial
- Cross-Validation
- Data Cleaning
- Delphi Technique
- Evidence-Based Decision Making
- Exploratory Data Analysis
- Follow-Up
- Inference: Deductive and Inductive
- Last Observation Carried Forward
- Planning Research
- Primary Data Source
- Protocol
- Q Methodology
- Research Hypothesis
- Research Question
- Scientific Method
- Secondary Data Source
- Standardization
- Statistical Control
- Type III Error
- Wave
- Research Validity Issues
- Bias
- Critical Thinking
- Ecological Validity
- Experimenter Expectancy Effect
- External Validity
- File Drawer Problem
- Hawthorne Effect
- Heisenberg Effect
- Internal Validity
- John Henry Effect
- Mortality
- Multiple Treatment Interference
- Multivalued Treatment Effects
- Nonclassical Experimenter Effects
- Order Effects
- Placebo Effect
- Pretest Sensitization
- Random Assignment
- Reactive Arrangements
- Regression to the Mean
- Selection
- Sequence Effects
- Threats to Validity
- Validity of Research Conclusions
- Volunteer Bias
- White Noise
- Sampling
- Cluster Sampling
- Convenience Sampling
- Demographics
- Error
- Exclusion Criteria
- Experience Sampling Method
- Nonprobability Sampling
- Population
- Probability Sampling
- Proportional Sampling
- Quota Sampling
- Random Sampling
- Random Selection
- Sample
- Sample Size
- Sample Size Planning
- Sampling
- Sampling and Retention of Underrepresented Groups
- Sampling Error
- Stratified Sampling
- Systematic Sampling
- Scaling
- Software Applications
- Statistical Assumptions
- Statistical Concepts
- Autocorrelation
- Biased Estimator
- Cohen's Kappa
- Collinearity
- Correlation
- Criterion Problem
- Critical Difference
- Data Mining
- Data Snooping
- Degrees of Freedom
- Directional Hypothesis
- Disturbance Terms
- Error Rates
- Expected Value
- Fixed-Effects Models
- Inclusion Criteria
- Influence Statistics
- Influential Data Points
- Intraclass Correlation
- Latent Variable
- Likelihood Ratio Statistic
- Loglinear Models
- Main Effects
- Markov Chains
- Method Variance
- Mixed- and Random-Effects Models
- Models
- Multilevel Modeling
- Odds
- Omega Squared
- Orthogonal Comparisons
- Outlier
- Overfitting
- Pooled Variance
- Precision
- Quality Effects Model
- Random-Effects Models
- Regression Artifacts
- Regression Discontinuity
- Residuals
- Restriction of Range
- Robust
- Root Mean Square Error
- Rosenthal Effect
- Serial Correlation
- Shrinkage
- Simple Main Effects
- Simpson's Paradox
- Sums of Squares
- Statistical Procedures
- Accuracy in Parameter Estimation
- Analysis of Covariance (ANCOVA)
- Analysis of Variance (ANOVA)
- Barycentric Discriminant Analysis
- Bivariate Regression
- Bonferroni Procedure
- Bootstrapping
- Canonical Correlation Analysis
- Categorical Data Analysis
- Confirmatory Factor Analysis
- Contrast Analysis
- Descriptive Discriminant Analysis
- Discriminant Analysis
- Dummy Coding
- Effect Coding
- Estimation
- Exploratory Factor Analysis
- Greenhouse-Geisser Correction
- Hierarchical Linear Modeling
- Holm's Sequential Bonferroni Procedure
- Jackknife
- Latent Growth Modeling
- Least Squares, Methods of
- Logistic Regression
- Mean Comparisons
- Missing Data, Imputation of
- Multiple Regression
- Multivariate Analysis of Variance (MANOVA)
- Pairwise Comparisons
- Path Analysis
- Post Hoc Analysis
- Post Hoc Comparisons
- Principal Components Analysis
- Propensity Score Analysis
- Sequential Analysis
- Stepwise Regression
- Structural Equation Modeling
- Survival Analysis
- Trend Analysis
- Yates's Correction
- Statistical Tests
- Bartlett's Test
- Behrens-Fisher t′ Statistic
- Chi-Square Test
- Duncan's Multiple Range Test
- Dunnett's Test
- F Test
- Fisher's Least Significant Difference Test
- Friedman Test
- Honestly Significant Difference (HSD) Test
- Kolmogorov-Smirnov Test
- Kruskal-Wallis Test
- Mann-Whitney U Test
- Mauchly Test
- McNemar's Test
- Multiple Comparison Tests
- Newman-Keuls Test and Tukey Test
- Omnibus Tests
- Scheffé Test
- Sign Test
- t Test, Independent Samples
- t Test, One Sample
- t Test, Paired Samples
- Tukey's Honestly Significant Difference (HSD)
- Welch's t Test
- Wilcoxon Rank Sum Test
- z Test
- Theories, Laws, and Principles
- Bayes's Theorem
- Central Limit Theorem
- Classical Test Theory
- Correspondence Principle
- Critical Theory
- Falsifiability
- Game Theory
- Gauss-Markov Theorem
- Generalizability Theory
- Grounded Theory
- Item Response Theory
- Occam's Razor
- Paradigm
- Positivism
- Probability, Laws of
- Theory
- Theory of Attitude Measurement
- Weber-Fechner Law
- Types of Variables
- Validity of Scores
- Loading...
Get a 30 day FREE TRIAL
-
 Watch videos from a variety of sources bringing classroom topics to life
 -
Read modern, diverse business cases
-
Explore hundreds of books and reference titles

Read next

More like this
Sage Recommends
We found other relevant content for you on other Sage platforms.
Have you created a personal profile? Login or create a profile so that you can save clips, playlists and searches