Entry
Reader's guide
Entries A-Z
Subject index
Panel Design
A panel design is used when researchers sample a group, or panel, of participants and then measure some variable or variables of interest at more than one point in time from this sample. Ordinarily, the same people who are measured at Time 1 are measured at Time 2, and so on. The successive measures are commonly referred to as waves. For example, a three-wave panel study would measure the same sample of participants on three separate occasions. The amount of time in between measurements is known as the interwave interval. The use of multiple measures on the same variable(s) over time allows for an assessment of longitudinal changes or stability on the variables of interest.
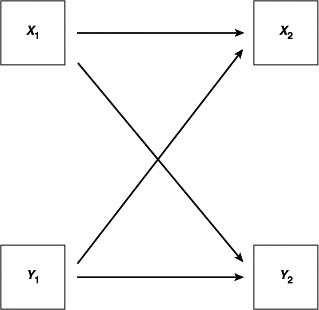
Perhaps the simplest and most common version of the panel design is the two-wave, two-variable panel, or cross-lagged panel design. In this design, two variables (X and Y) are measured at two discrete points in time from the same sample of participants. The procedure allows the researcher to test a series of different associations depicted in Figure 1.
The horizontal paths in the cross-lagged panel model represent stability coefficients. These values indicate how stable the X or Y variables are over time. If analyzed with regression, the larger these regression coefficients are, the greater the stability of the X or Y constructs over the course of the interwave interval. The diagonal paths are of particular interest as they are often compared to determine if X1 → Y2 is greater or less than Y1 → X2. This comparison often forms the basis for making causal inferences about whether X causes Y, Y causes X, or perhaps some combination of the two. Although cross-lagged panel designs are very common in the literature, there is a considerable controversy about their actual utility for testing causal inferences. This is because a valid causal analysis based on a cross-lagged panel design involves the absence of measurement error, correct specification of the causal lag between T1 and T2, and the assumption that there is no third variable, Z, that could exert a causal impact on X and Y. Rarely, if ever, are all of these assumptions met.
Despite its limitations, the cross-lagged panel study illustrates several key benefits of panel designs more generally. First and foremost, one of the fundamental prerequisites for establishing that X has a causal effect on Y is the demonstration that X occurs before Y. For example, if smoking is assumed to cause lung cancer, it is important to be able to demonstrate that people first smoke while otherwise free of cancer, and then lung cancer appears at a later point in time. Merely demonstrating that X precedes Y in a longitudinal panel study does not prove that X causes Y, but it satisfies this vital criterion, among several others, for establishing a causal relation. Another important quality of panel designs is that they do not confound interindividual growth with interindividual differences in intraindividual growth, the way that cross-sectional studies do. Because the same people are measured at multiple points in time, it is possible to statistically model changes within the same person over time, differences between people, and interindividual differences in the rate and direction of change over time.
Figure 1 Basic Structure of Cross-Lagged Panel Design
...
- Descriptive Statistics
- Distributions
- Graphical Displays of Data
- Hypothesis Testing
- Alternative Hypotheses
- Beta
- Critical Value
- Decision Rule
- Hypothesis
- Nondirectional Hypotheses
- Nonsignificance
- Null Hypothesis
- One-Tailed Test
- p Value
- Power
- Power Analysis
- Significance Level, Concept of
- Significance Level, Interpretation and Construction
- Significance, Statistical
- Two-Tailed Test
- Type I Error
- Type II Error
- Type III Error
- Important Publications
- “Coefficient Alpha and the Internal Structure of Tests”
- “Convergent and Discriminant Validation by the Multitrait-Multimethod Matrix”
- “Meta-Analysis of Psychotherapy Outcome Studies”
- “On the Theory of Scales of Measurement”
- “Probable Error of a Mean, The”
- “Psychometric Experiments”
- “Sequential Tests of Statistical Hypotheses”
- “Technique for the Measurement of Attitudes, A”
- “Validity”
- Aptitudes and Instructional Methods
- Doctrine of Chances, The
- Logic of Scientific Discovery, The
- Nonparametric Statistics for the Behavioral Sciences
- Probabilistic Models for Some Intelligence and Attainment Tests
- Statistical Power Analysis for the Behavioral Sciences
- Teoria Statistica Delle Classi e Calcolo Delle Probabilità
- Inferential Statistics
- Association, Measures of
- Coefficient of Concordance
- Coefficient of Variation
- Coefficients of Correlation, Alienation, and Determination
- Confidence Intervals
- Margin of Error
- Nonparametric Statistics
- Odds Ratio
- Parameters
- Parametric Statistics
- Partial Correlation
- Pearson Product-Moment Correlation Coefficient
- Polychoric Correlation Coefficient
- Q-Statistic
- R2
- Randomization Tests
- Regression Coefficient
- Semipartial Correlation Coefficient
- Spearman Rank Order Correlation
- Standard Error of Estimate
- Standard Error of the Mean
- Student's t Test
- Unbiased Estimator
- Weights
- Item Response Theory
- Mathematical Concepts
- Measurement Concepts
- Organizations
- Publishing
- Qualitative Research
- Reliability of Scores
- Research Design Concepts
- Aptitude-Treatment Interaction
- Cause and Effect
- Concomitant Variable
- Confounding
- Control Group
- Interaction
- Internet-Based Research Method
- Intervention
- Matching
- Natural Experiments
- Network Analysis
- Placebo
- Replication
- Research
- Research Design Principles
- Treatment(s)
- Triangulation
- Unit of Analysis
- Yoked Control Procedure
- Research Designs
- A Priori Monte Carlo Simulation
- Action Research
- Adaptive Designs in Clinical Trials
- Applied Research
- Behavior Analysis Design
- Block Design
- Case-Only Design
- Causal-Comparative Design
- Cohort Design
- Completely Randomized Design
- Cross-Sectional Design
- Crossover Design
- Double-Blind Procedure
- Ex Post Facto Study
- Experimental Design
- Factorial Design
- Field Study
- Group-Sequential Designs in Clinical Trials
- Laboratory Experiments
- Latin Square Design
- Longitudinal Design
- Meta-Analysis
- Mixed Methods Design
- Mixed Model Design
- Monte Carlo Simulation
- Nested Factor Design
- Nonexperimental Design
- Observational Research
- Panel Design
- Partially Randomized Preference Trial Design
- Pilot Study
- Pragmatic Study
- Pre-Experimental Designs
- Pretest-Posttest Design
- Prospective Study
- Quantitative Research
- Quasi-Experimental Design
- Randomized Block Design
- Repeated Measures Design
- Response Surface Design
- Retrospective Study
- Sequential Design
- Single-Blind Study
- Single-Subject Design
- Split-Plot Factorial Design
- Thought Experiments
- Time Studies
- Time-Lag Study
- Time-Series Study
- Triple-Blind Study
- True Experimental Design
- Wennberg Design
- Within-Subjects Design
- Zelen's Randomized Consent Design
- Research Ethics
- Research Process
- Clinical Significance
- Clinical Trial
- Cross-Validation
- Data Cleaning
- Delphi Technique
- Evidence-Based Decision Making
- Exploratory Data Analysis
- Follow-Up
- Inference: Deductive and Inductive
- Last Observation Carried Forward
- Planning Research
- Primary Data Source
- Protocol
- Q Methodology
- Research Hypothesis
- Research Question
- Scientific Method
- Secondary Data Source
- Standardization
- Statistical Control
- Type III Error
- Wave
- Research Validity Issues
- Bias
- Critical Thinking
- Ecological Validity
- Experimenter Expectancy Effect
- External Validity
- File Drawer Problem
- Hawthorne Effect
- Heisenberg Effect
- Internal Validity
- John Henry Effect
- Mortality
- Multiple Treatment Interference
- Multivalued Treatment Effects
- Nonclassical Experimenter Effects
- Order Effects
- Placebo Effect
- Pretest Sensitization
- Random Assignment
- Reactive Arrangements
- Regression to the Mean
- Selection
- Sequence Effects
- Threats to Validity
- Validity of Research Conclusions
- Volunteer Bias
- White Noise
- Sampling
- Cluster Sampling
- Convenience Sampling
- Demographics
- Error
- Exclusion Criteria
- Experience Sampling Method
- Nonprobability Sampling
- Population
- Probability Sampling
- Proportional Sampling
- Quota Sampling
- Random Sampling
- Random Selection
- Sample
- Sample Size
- Sample Size Planning
- Sampling
- Sampling and Retention of Underrepresented Groups
- Sampling Error
- Stratified Sampling
- Systematic Sampling
- Scaling
- Software Applications
- Statistical Assumptions
- Statistical Concepts
- Autocorrelation
- Biased Estimator
- Cohen's Kappa
- Collinearity
- Correlation
- Criterion Problem
- Critical Difference
- Data Mining
- Data Snooping
- Degrees of Freedom
- Directional Hypothesis
- Disturbance Terms
- Error Rates
- Expected Value
- Fixed-Effects Models
- Inclusion Criteria
- Influence Statistics
- Influential Data Points
- Intraclass Correlation
- Latent Variable
- Likelihood Ratio Statistic
- Loglinear Models
- Main Effects
- Markov Chains
- Method Variance
- Mixed- and Random-Effects Models
- Models
- Multilevel Modeling
- Odds
- Omega Squared
- Orthogonal Comparisons
- Outlier
- Overfitting
- Pooled Variance
- Precision
- Quality Effects Model
- Random-Effects Models
- Regression Artifacts
- Regression Discontinuity
- Residuals
- Restriction of Range
- Robust
- Root Mean Square Error
- Rosenthal Effect
- Serial Correlation
- Shrinkage
- Simple Main Effects
- Simpson's Paradox
- Sums of Squares
- Statistical Procedures
- Accuracy in Parameter Estimation
- Analysis of Covariance (ANCOVA)
- Analysis of Variance (ANOVA)
- Barycentric Discriminant Analysis
- Bivariate Regression
- Bonferroni Procedure
- Bootstrapping
- Canonical Correlation Analysis
- Categorical Data Analysis
- Confirmatory Factor Analysis
- Contrast Analysis
- Descriptive Discriminant Analysis
- Discriminant Analysis
- Dummy Coding
- Effect Coding
- Estimation
- Exploratory Factor Analysis
- Greenhouse-Geisser Correction
- Hierarchical Linear Modeling
- Holm's Sequential Bonferroni Procedure
- Jackknife
- Latent Growth Modeling
- Least Squares, Methods of
- Logistic Regression
- Mean Comparisons
- Missing Data, Imputation of
- Multiple Regression
- Multivariate Analysis of Variance (MANOVA)
- Pairwise Comparisons
- Path Analysis
- Post Hoc Analysis
- Post Hoc Comparisons
- Principal Components Analysis
- Propensity Score Analysis
- Sequential Analysis
- Stepwise Regression
- Structural Equation Modeling
- Survival Analysis
- Trend Analysis
- Yates's Correction
- Statistical Tests
- Bartlett's Test
- Behrens-Fisher t′ Statistic
- Chi-Square Test
- Duncan's Multiple Range Test
- Dunnett's Test
- F Test
- Fisher's Least Significant Difference Test
- Friedman Test
- Honestly Significant Difference (HSD) Test
- Kolmogorov-Smirnov Test
- Kruskal-Wallis Test
- Mann-Whitney U Test
- Mauchly Test
- McNemar's Test
- Multiple Comparison Tests
- Newman-Keuls Test and Tukey Test
- Omnibus Tests
- Scheffé Test
- Sign Test
- t Test, Independent Samples
- t Test, One Sample
- t Test, Paired Samples
- Tukey's Honestly Significant Difference (HSD)
- Welch's t Test
- Wilcoxon Rank Sum Test
- z Test
- Theories, Laws, and Principles
- Bayes's Theorem
- Central Limit Theorem
- Classical Test Theory
- Correspondence Principle
- Critical Theory
- Falsifiability
- Game Theory
- Gauss-Markov Theorem
- Generalizability Theory
- Grounded Theory
- Item Response Theory
- Occam's Razor
- Paradigm
- Positivism
- Probability, Laws of
- Theory
- Theory of Attitude Measurement
- Weber-Fechner Law
- Types of Variables
- Validity of Scores
- Loading...
Get a 30 day FREE TRIAL
-
 Watch videos from a variety of sources bringing classroom topics to life
 -
Read modern, diverse business cases
-
Explore hundreds of books and reference titles

Read next

More like this
Sage Recommends
We found other relevant content for you on other Sage platforms.
Have you created a personal profile? Login or create a profile so that you can save clips, playlists and searches