Entry
Reader's guide
Entries A-Z
Subject index
Descriptive Statistics
Descriptive statistics are commonly encountered, relatively simple, and for the most part easily understood. Most of the statistics encountered in daily life, in newspapers and magazines, in television, radio, and Internet news reports, and so forth, are descriptive in nature rather than inferential. Compared with the logic of inferential statistics, most descriptive statistics are somewhat intuitive. Typically the first five or six chapters of an introductory statistics text consist of descriptive statistics (means, medians, variances, standard deviations, correlation coefficients, etc.), followed in the later chapters by the more complex rationale and methods for statistical inference (probability theory, sampling theory, t and z tests, analysis of variance, etc.)
Descriptive statistical methods are also foundational in the sense that inferential methods are conceptually dependent on them and use them as their building blocks. One must, for example, understand the concept of variance before learning how analysis of variance or t tests are used for statistical inference. One must understand the descriptive correlation coefficient before learning how to use regression or multiple regression inferentially. Descriptive statistics are also complementary to inferential ones in analytical practice. Even when the analysis draws its main conclusions from an inferential analysis, descriptive statistics are usually presented as supporting information to give the reader an overall sense of the direction and meaning of significant results.
Although most of the descriptive building blocks of statistics are relatively simple, some descriptive methods are high level and complex. Consider multivariate descriptive methods, that is, statistical methods involving multiple dependent variables, such as factor analysis, principal components analysis, cluster analysis, canonical correlation, or discriminant analysis. Although each represents a fairly high level of quantitative sophistication, each is primarily descriptive. In the hands of a skilled analyst, each can provide invaluable information about the holistic patterns in data. For the most part, each of these high-level multivariate descriptive statistical methods can be matched to a corresponding inferential multivariate statistical method to provide both a description of the data from a sample and inferences to the population; however, only the descriptive methods are discussed here.
The topic of descriptive statistics is therefore a very broad one, ranging from the simple first concepts in statistics to the higher reaches of data structure explored through complex multivariate methods. The topic also includes graphical data presentation, exploratory data analysis (EDA) methods, effect size computations and meta-analysis methods, esoteric models in mathematical psychology that are highly useful in basic science experimental psychology areas (such as psycho-physics), and high-level multivariate graphical data exploration methods.
Graphics and EDA
Graphics are among the most powerful types of descriptive statistical devices and often appear as complementary presentations even in primarily inferential data analyses. Graphics are also highly useful in the exploratory phase of research, forming an essential part of the approach known as EDA.
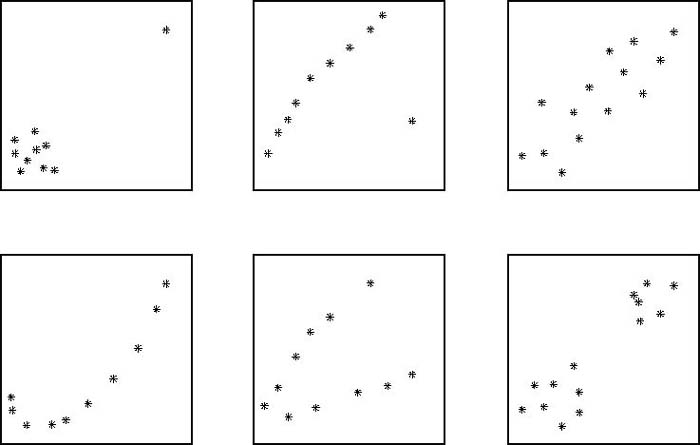
Figure 1 Scatterplots of Six Different Bivariate Data Configurations That All Have the Same Pearson Product-Moment Correlation Coefficient
Graphics
Many of the statistics encountered in everyday life are visual in form—charts and graphs. Descriptive data come to life and become much clearer and substantially more informative through a well-chosen graphic. One only has to look through a column of values of the Dow Jones Industrial Average closing price for the past 30 days and then compare it with a simple line graph of the same data to be convinced of the clarifying power of graphics. Consider also how much more informative a scatterplot is than the correlation coefficient as a description of the bivariate relationship between two variables. Figure 1 uses bivariate scatterplots to display six different data sets that all have the same correlation coefficient. Obviously there is much more to be known about the structural properties of a bivariate relationship than merely its strength (correlation), and much of this is revealed in a scatterplot.
...
- Descriptive Statistics
- Distributions
- Graphical Displays of Data
- Hypothesis Testing
- Alternative Hypotheses
- Beta
- Critical Value
- Decision Rule
- Hypothesis
- Nondirectional Hypotheses
- Nonsignificance
- Null Hypothesis
- One-Tailed Test
- p Value
- Power
- Power Analysis
- Significance Level, Concept of
- Significance Level, Interpretation and Construction
- Significance, Statistical
- Two-Tailed Test
- Type I Error
- Type II Error
- Type III Error
- Important Publications
- “Coefficient Alpha and the Internal Structure of Tests”
- “Convergent and Discriminant Validation by the Multitrait-Multimethod Matrix”
- “Meta-Analysis of Psychotherapy Outcome Studies”
- “On the Theory of Scales of Measurement”
- “Probable Error of a Mean, The”
- “Psychometric Experiments”
- “Sequential Tests of Statistical Hypotheses”
- “Technique for the Measurement of Attitudes, A”
- “Validity”
- Aptitudes and Instructional Methods
- Doctrine of Chances, The
- Logic of Scientific Discovery, The
- Nonparametric Statistics for the Behavioral Sciences
- Probabilistic Models for Some Intelligence and Attainment Tests
- Statistical Power Analysis for the Behavioral Sciences
- Teoria Statistica Delle Classi e Calcolo Delle Probabilità
- Inferential Statistics
- Association, Measures of
- Coefficient of Concordance
- Coefficient of Variation
- Coefficients of Correlation, Alienation, and Determination
- Confidence Intervals
- Margin of Error
- Nonparametric Statistics
- Odds Ratio
- Parameters
- Parametric Statistics
- Partial Correlation
- Pearson Product-Moment Correlation Coefficient
- Polychoric Correlation Coefficient
- Q-Statistic
- R2
- Randomization Tests
- Regression Coefficient
- Semipartial Correlation Coefficient
- Spearman Rank Order Correlation
- Standard Error of Estimate
- Standard Error of the Mean
- Student's t Test
- Unbiased Estimator
- Weights
- Item Response Theory
- Mathematical Concepts
- Measurement Concepts
- Organizations
- Publishing
- Qualitative Research
- Reliability of Scores
- Research Design Concepts
- Aptitude-Treatment Interaction
- Cause and Effect
- Concomitant Variable
- Confounding
- Control Group
- Interaction
- Internet-Based Research Method
- Intervention
- Matching
- Natural Experiments
- Network Analysis
- Placebo
- Replication
- Research
- Research Design Principles
- Treatment(s)
- Triangulation
- Unit of Analysis
- Yoked Control Procedure
- Research Designs
- A Priori Monte Carlo Simulation
- Action Research
- Adaptive Designs in Clinical Trials
- Applied Research
- Behavior Analysis Design
- Block Design
- Case-Only Design
- Causal-Comparative Design
- Cohort Design
- Completely Randomized Design
- Cross-Sectional Design
- Crossover Design
- Double-Blind Procedure
- Ex Post Facto Study
- Experimental Design
- Factorial Design
- Field Study
- Group-Sequential Designs in Clinical Trials
- Laboratory Experiments
- Latin Square Design
- Longitudinal Design
- Meta-Analysis
- Mixed Methods Design
- Mixed Model Design
- Monte Carlo Simulation
- Nested Factor Design
- Nonexperimental Design
- Observational Research
- Panel Design
- Partially Randomized Preference Trial Design
- Pilot Study
- Pragmatic Study
- Pre-Experimental Designs
- Pretest-Posttest Design
- Prospective Study
- Quantitative Research
- Quasi-Experimental Design
- Randomized Block Design
- Repeated Measures Design
- Response Surface Design
- Retrospective Study
- Sequential Design
- Single-Blind Study
- Single-Subject Design
- Split-Plot Factorial Design
- Thought Experiments
- Time Studies
- Time-Lag Study
- Time-Series Study
- Triple-Blind Study
- True Experimental Design
- Wennberg Design
- Within-Subjects Design
- Zelen's Randomized Consent Design
- Research Ethics
- Research Process
- Clinical Significance
- Clinical Trial
- Cross-Validation
- Data Cleaning
- Delphi Technique
- Evidence-Based Decision Making
- Exploratory Data Analysis
- Follow-Up
- Inference: Deductive and Inductive
- Last Observation Carried Forward
- Planning Research
- Primary Data Source
- Protocol
- Q Methodology
- Research Hypothesis
- Research Question
- Scientific Method
- Secondary Data Source
- Standardization
- Statistical Control
- Type III Error
- Wave
- Research Validity Issues
- Bias
- Critical Thinking
- Ecological Validity
- Experimenter Expectancy Effect
- External Validity
- File Drawer Problem
- Hawthorne Effect
- Heisenberg Effect
- Internal Validity
- John Henry Effect
- Mortality
- Multiple Treatment Interference
- Multivalued Treatment Effects
- Nonclassical Experimenter Effects
- Order Effects
- Placebo Effect
- Pretest Sensitization
- Random Assignment
- Reactive Arrangements
- Regression to the Mean
- Selection
- Sequence Effects
- Threats to Validity
- Validity of Research Conclusions
- Volunteer Bias
- White Noise
- Sampling
- Cluster Sampling
- Convenience Sampling
- Demographics
- Error
- Exclusion Criteria
- Experience Sampling Method
- Nonprobability Sampling
- Population
- Probability Sampling
- Proportional Sampling
- Quota Sampling
- Random Sampling
- Random Selection
- Sample
- Sample Size
- Sample Size Planning
- Sampling
- Sampling and Retention of Underrepresented Groups
- Sampling Error
- Stratified Sampling
- Systematic Sampling
- Scaling
- Software Applications
- Statistical Assumptions
- Statistical Concepts
- Autocorrelation
- Biased Estimator
- Cohen's Kappa
- Collinearity
- Correlation
- Criterion Problem
- Critical Difference
- Data Mining
- Data Snooping
- Degrees of Freedom
- Directional Hypothesis
- Disturbance Terms
- Error Rates
- Expected Value
- Fixed-Effects Models
- Inclusion Criteria
- Influence Statistics
- Influential Data Points
- Intraclass Correlation
- Latent Variable
- Likelihood Ratio Statistic
- Loglinear Models
- Main Effects
- Markov Chains
- Method Variance
- Mixed- and Random-Effects Models
- Models
- Multilevel Modeling
- Odds
- Omega Squared
- Orthogonal Comparisons
- Outlier
- Overfitting
- Pooled Variance
- Precision
- Quality Effects Model
- Random-Effects Models
- Regression Artifacts
- Regression Discontinuity
- Residuals
- Restriction of Range
- Robust
- Root Mean Square Error
- Rosenthal Effect
- Serial Correlation
- Shrinkage
- Simple Main Effects
- Simpson's Paradox
- Sums of Squares
- Statistical Procedures
- Accuracy in Parameter Estimation
- Analysis of Covariance (ANCOVA)
- Analysis of Variance (ANOVA)
- Barycentric Discriminant Analysis
- Bivariate Regression
- Bonferroni Procedure
- Bootstrapping
- Canonical Correlation Analysis
- Categorical Data Analysis
- Confirmatory Factor Analysis
- Contrast Analysis
- Descriptive Discriminant Analysis
- Discriminant Analysis
- Dummy Coding
- Effect Coding
- Estimation
- Exploratory Factor Analysis
- Greenhouse-Geisser Correction
- Hierarchical Linear Modeling
- Holm's Sequential Bonferroni Procedure
- Jackknife
- Latent Growth Modeling
- Least Squares, Methods of
- Logistic Regression
- Mean Comparisons
- Missing Data, Imputation of
- Multiple Regression
- Multivariate Analysis of Variance (MANOVA)
- Pairwise Comparisons
- Path Analysis
- Post Hoc Analysis
- Post Hoc Comparisons
- Principal Components Analysis
- Propensity Score Analysis
- Sequential Analysis
- Stepwise Regression
- Structural Equation Modeling
- Survival Analysis
- Trend Analysis
- Yates's Correction
- Statistical Tests
- Bartlett's Test
- Behrens-Fisher t′ Statistic
- Chi-Square Test
- Duncan's Multiple Range Test
- Dunnett's Test
- F Test
- Fisher's Least Significant Difference Test
- Friedman Test
- Honestly Significant Difference (HSD) Test
- Kolmogorov-Smirnov Test
- Kruskal-Wallis Test
- Mann-Whitney U Test
- Mauchly Test
- McNemar's Test
- Multiple Comparison Tests
- Newman-Keuls Test and Tukey Test
- Omnibus Tests
- Scheffé Test
- Sign Test
- t Test, Independent Samples
- t Test, One Sample
- t Test, Paired Samples
- Tukey's Honestly Significant Difference (HSD)
- Welch's t Test
- Wilcoxon Rank Sum Test
- z Test
- Theories, Laws, and Principles
- Bayes's Theorem
- Central Limit Theorem
- Classical Test Theory
- Correspondence Principle
- Critical Theory
- Falsifiability
- Game Theory
- Gauss-Markov Theorem
- Generalizability Theory
- Grounded Theory
- Item Response Theory
- Occam's Razor
- Paradigm
- Positivism
- Probability, Laws of
- Theory
- Theory of Attitude Measurement
- Weber-Fechner Law
- Types of Variables
- Validity of Scores
- Loading...
Get a 30 day FREE TRIAL
-
 Watch videos from a variety of sources bringing classroom topics to life
 -
Read modern, diverse business cases
-
Explore hundreds of books and reference titles

Read next

More like this
Sage Recommends
We found other relevant content for you on other Sage platforms.
Have you created a personal profile? Login or create a profile so that you can save clips, playlists and searches