Entry
Reader's guide
Entries A-Z
Subject index
Descriptive Statistics
Description of the data collected in research is an important component for both the researcher and the reader. In both quantitative and qualitative analysis, the reduction of a large amount of data to an easily digestible summary is an important function. In qualitative research, descriptive statistics are typically observed in mixed method, action research, or other qualitative designs. More important, description lays the foundation for later analyses and interpretation of collected data.
When numerical data are collected, the description of these data is termed descriptive statistics. Descriptive statistics constitute a mathematical summarization of the data where a large number of observed values are mathematically converted to a few numbers. This is a variable-oriented approach where typically a large number of cases are involved versus a case-oriented approach where typically a few cases are involved. In qualitative research, descriptive statistics allow researchers to provide another context, a richer picture or enhanced representation, in which to examine the phenomenon of interest. The inclusion of quantitative data can also enhance legitimacy (e.g., validity, credibility, trustworthiness, transferability), although this might not be appropriate for many qualitative projects.
The simplest ways to categorize descriptive statistics are (a) numerical, such as measures of central tendency and variability; and (b) graphical, such as histograms, bar charts, and scatter plots. Descriptive statistics are different from inferential statistics, where the purpose is to infer from the sample to the population of interest.
To make meaningful inferences, descriptive statistics must be used properly, and that begins with understanding when to use each quantitative descriptive technique. Common descriptive statistics in multi-method studies are the three measures of central tendency: mean (x −, M), median, and mode. The three measures of central tendency provide a set of values that describe the typical score in a distribution of scores. The measures of central tendency are calculated from continuous data (e.g., test scores) and not categorical scores (e.g., gender identification). For example, in educational research a common variable is an achievement score such as reading comprehension, and in gambling research a common variable is the speed of play on a slot machine.
Figure 1 Histogram of Reading Achievement Scores
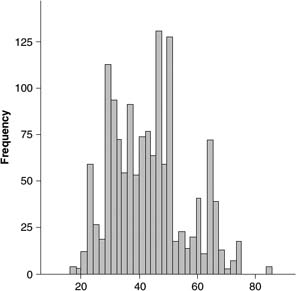
The mean, or average value, for the reading comprehension example is the summation of all scores divided by the number of test scores. The median is the middle score of all the ordered achievement scores. The mode is the most common, or highest frequency, achievement score. There can be more than one mode in a data set.
Measures of variability (i.e., score dispersion) are typically reported for continuous data and include the range, variance, and standard deviation of the scores. The range for a set of scores, or the distribution data, is calculated by subtracting the largest score from the smallest score. From the example of students' reading comprehension scores, this is the highest test score minus the lowest test score. The standard deviation (SD) is the average distance that scores are from the mean. The more dispersed the values, the larger the standard deviation. In a normally distributed data set (i.e., looks like a bell curve), 68% of the values will be within 1 standard deviation above or below the mean. The standard deviation is more commonly provided because it is easily interpreted, whereas the variance simply indicates that variability in the observed scores exists. If the variance, and therefore the standard deviation, is zero, then all of the scores are the same. A fourth, albeit less commonly provided, dispersion descriptor is the interquartile range. The interquartile range is the distance between the 25th and 75th percentiles and indicates where the middle 50% of the values are located.
...
- Approaches and Methodologies
- A/r/tography
- Action Research
- Advocacy Research
- Aesthetics
- Applied Research
- Appreciative Inquiry
- Artifact Analysis
- Arts-Based Research
- Arts-Informed Research
- Autobiography
- Autoethnography
- Basic Research
- Biography
- Case Study
- Clinical Research
- Collaborative Research
- Community-Based Research
- Comparative Research
- Content Analysis
- Conversation Analysis
- Covert Research
- Critical Action Research
- Critical Arts-Based Inquiry
- Critical Discourse Analysis
- Critical Ethnography
- Critical Hermeneutics
- Critical Research
- Cross-Cultural Research
- Discourse Analysis
- Document Analysis
- Duoethnography
- Ecological Research
- Emergent Design
- Empirical Research
- Empowerment Evaluation
- Ethnodrama
- Ethnography
- Ethnomethodology
- Evaluation Research
- Evidence-Based Practice
- Explanatory Research
- Exploratory Data Analysis
- Feminist Research
- Field Research
- Foucauldian Discourse Analysis
- Genealogical Approach
- Grounded Theory
- Hermeneutics
- Heuristic Inquiry
- Historical Discourse Analysis
- Historical Research
- Historiography
- Indigenous Research
- Institutional Ethnography
- Institutional Research
- Interdisciplinary Research
- Internet in Qualitative Research
- Interpretive Inquiry
- Interpretive Phenomenology
- Interpretive Research
- Market Research
- Meta-Analysis
- Meta-Ethnography
- Meta-Synthesis
- Methodological Holism Versus Individualism
- Methodology
- Methods
- Mixed Methods Research
- Multicultural Research
- Narrative Analysis
- Narrative Genre Analysis
- Narrative Inquiry
- Naturalistic Inquiry
- Observational Research
- Oral History
- Orientational Perspective
- Para-Ethnography
- Participatory Action Research (PAR)
- Performance Ethnography
- Phenomenography
- Phenomenology
- Place/Space in Qualitative Research
- Playbuilding
- Portraiture
- Program Evaluation
- Q Methodology
- Readers Theater
- Social Justice
- Social Network Analysis
- Survey Research
- Systemic Inquiry
- Theatre of the Oppressed
- Transformational Methods
- Unobtrusive Research
- Value-Free Inquiry
- Virtual Ethnography
- Virtual Research
- Visual Ethnography
- Visual Narrative Inquiry
- Arts-Based Research, Ties to
- A/r/tography
- Aesthetics
- Artifact Analysis
- Arts-Based Research
- Arts-Informed Research
- Audience
- Autobiography
- Bricolage and Bricoleur
- Collage
- Connoisseurship
- Critical Arts-Based Inquiry
- Dance in Qualitative Research
- Dramaturgy
- Ethnodrama
- Ethnopoetics
- Fictional Writing
- Film and Video in Qualitative Research
- Literature in Qualitative Research
- Memoirs
- Multimedia in Qualitative Research
- Music in Qualitative Research
- Performance Ethnography
- Photographs in Qualitative Research
- Photonovella and Photovoice
- Place/Space in Qualitative Research
- Playbuilding
- Poetry in Qualitative Research
- Portraiture
- Readers Theater
- Researcher as Artist
- Resonance
- Storytelling
- Theatre of the Oppressed
- Transformational Methods
- Vignettes
- Visual Ethnography
- Visual Narrative Inquiry
- Visual Research
- Associations, Centers, and Institutes
- Computer-Assisted Data Analysis
- Data Analysis
- Abduction
- Analytic Induction
- Artifact Analysis
- ATLAS.ti (Software)
- Audience Analysis
- Auditing
- Axial Coding
- Bricolage and Bricoleur
- Categories
- Categorization
- Co-Constructed Narrative
- Codes and Coding
- Coding Frame
- Collage
- Comparative Analysis
- Computer-Assisted Data Analysis
- Concept Mapping
- Conceptual Ordering
- Constant Comparison
- Content Analysis
- Context and Contextuality
- Context-Centered Knowledge
- Conversation Analysis
- Core Category
- Counternarrative
- Creative Writing
- Critical Discourse Analysis
- Cultural Context
- Data
- Data Analysis
- Data Management
- Data Saturation
- Deduction
- Descriptive Statistics
- Diction (Software)
- Discourse
- Discourse Analysis
- Discovery
- Discursive Practice
- Diversity Issues
- Document Analysis
- Embodied Knowledge
- Emergent Themes
- Emic/Etic Distinction
- Emotions in Qualitative Research
- Essence
- Ethnograph (Software)
- Ethnographic Content Analysis
- Ethnostatistics
- Evaluation Criteria
- Everyday Life
- Experiential Knowledge
- Explanation
- Exploratory Data Analysis
- Findings
- Foucauldian Discourse Analysis
- Framework (Software)
- Gender Issues
- Grounded Theory
- Heteroglossia
- Historical Context
- Historical Discourse Analysis
- Horizonalization
- HyperRESEARCH (Software)
- Imagination in Qualitative Research
- In Vivo Coding
- Indexicality
- Induction
- Interpretation
- Intertextuality
- Knowledge
- Liminal Perspective
- Literature Review
- Lived Experience
- Marginalization
- MAXqda (Software)
- Meaning
- Membership Categorization Device Analysis (MCDA)
- Memos and Memoing
- Meta-Analysis
- Meta-Narrative
- Meta-Synthesis
- Metaphor
- Narrative Analysis
- Narrative Genre Analysis
- Negative Case Analysis
- Nonverbal Communication
- NVivo (Software)
- Open Coding
- Otherness
- Peer Review
- Perception
- Photonovella and Photovoice
- Power
- Psychological Generalization
- Qualrus (Software)
- Rapid Assessment Process
- Reconstructive Analysis
- Recursivity
- Reflexivity
- Research Diaries and Journals
- Research Literature
- Researcher as Artist
- Researcher as Instrument
- Researcher Sensitivity
- Response Groups
- Rhythmanalysis
- Rigor in Qualitative Research
- Secondary Analysis
- Selective Coding
- Situatedness
- Social Context
- Social Network Analysis
- SuperHyperQual (Software)
- Systematic Sociological Introspection
- Tacit Knowledge
- TextQuest (Software)
- Textual Analysis
- Thematic Coding and Analysis
- Themes
- Theoretical Memoing
- Theoretical Saturation
- Thick Description
- Transana (Software)
- Transcript
- Transcription
- Truth
- Typological Analysis
- Understanding
- Video Intervention/Prevention Assessment
- Vignettes
- Visual Data
- Visual Data Displays
- Writing Process
- Data Collection
- Access
- Active Listening
- Artifacts
- Audiorecording
- Captive Population
- Checklists
- Closed Question
- Cognitive Interview
- Collage
- Convenience Sample
- Convergent Interviewing
- Conversational Interviewing
- Covert Observation
- Creative Writing
- Critical Incident Technique
- Data
- Data Archive
- Data Collection
- Data Generation
- Data Management
- Data Security
- Data Storage
- Debriefing
- Deception
- Dialogue
- Diaries and Journals
- Documents
- Dramaturgy
- Email Interview
- Emotions in Qualitative Research
- Empathy
- Ethnopoetics
- Fictional Writing
- Field Data
- Fieldnotes
- Fieldwork
- Film and Video in Qualitative Research
- Focus Groups
- Free Association Narrative Interview
- Funding
- Hypothesis
- In-Depth Interview
- In-Person Interview
- Interactive Focus Groups
- Interactive Interview
- Internet in Qualitative Research
- Interview Guide
- Interviewing
- Leaving the Field
- Life Stories
- Literature in Qualitative Research
- Literature Review
- Lived Experience
- Memoirs
- Memos and Memoing
- Multimedia in Qualitative Research
- Narrative Interview
- Narrative Texts
- Natural Setting
- Naturalistic Data
- Naturalistic Observation
- Negotiating Exit
- Neutral Question
- Neutrality in Qualitative Research
- Nonparticipant Observation
- Nonprobability Sampling
- Nonverbal Communication
- Observation Schedule
- Open-Ended Question
- Participant Observation
- Peer Debriefing
- Perception
- Photographs in Qualitative Research
- Pilot Study
- Poetry in Qualitative Research
- Population
- Probes and Probing
- Projective Techniques
- Prolonged Engagement
- Psychoanalytically Informed Observation
- Purposive Sampling
- Quota Sampling
- Random Sampling
- Rapport
- Raw Data
- Recruiting Participants
- Research Diaries and Journals
- Research Literature
- Research Problem
- Research Question
- Research Setting
- Research Team
- Researcher as Instrument
- Researcher Roles
- Researcher Safety
- Researcher Sensitivity
- Rich Data
- Rigor in Qualitative Research
- Risk
- Sample
- Sample Size
- Sampling
- Sampling Frame
- Secondary Data
- Semi-Structured Interview
- Sensitizing Concepts
- Serendipity
- Snowball Sampling
- Stratified Sampling
- Structured Interview
- Structured Observation
- Subjectivity Statement
- Telephone Interview
- Text
- Theoretical Sampling
- Triangulation
- Unstructured Interview
- Unstructured Observation
- Videorecording
- Vignettes
- Virtual Interview
- Dissemination and Writing
- Ethnography (Journal)
- Field Methods (Journal)
- Forum: Qualitative Social Research (Journal)
- International Journal of Qualitative Methods
- Journal of Contemporary Ethnography
- Journal of Mixed Methods Research
- Narrative Inquiry (Journal)
- Oral History Review (Journal)
- Qualitative Health Research (Journal)
- Qualitative Inquiry (Journal)
- Qualitative Report, The (Journal)
- Qualitative Research (Journal)
- Advances in Qualitative Methods Conference
- Creative Writing
- Ethnographic and Qualitative Research Conference
- Fictional Writing
- Film and Video in Qualitative Research
- Findings
- First-Person Voice
- Interdisciplinary Qualitative Studies Conference
- International Congress of Qualitative Inquiry
- International Human Science Research Conference
- Internet in Qualitative Research
- Literature in Qualitative Research
- Literature Review
- Memoirs
- Multimedia in Qualitative Research
- Peer Review
- Poetry in Qualitative Research
- Portraiture
- Publishing and Publication
- Qualitative Health Research Conference
- QualPage
- Representational Forms of Dissemination
- Research Literature
- Research Proposal
- Rhetoric
- Storytelling
- Subjectivity Statement
- Vignettes
- Voice
- Writing Process
- History of Qualitative Research
- Participants
- Access
- Agency
- Audience
- Captive Population
- Confidentiality
- Conflict of Interest
- Debriefing
- Deception
- Disengagement
- Disinterestedness
- Diversity Issues
- Emotions in Qualitative Research
- Empathy
- Empowerment
- Ethics
- First-Person Voice
- Harm
- Identity
- Informant
- Informed Consent
- Insider/Outsider Status
- Intersubjectivity
- Key Informant
- Leaving the Field
- Lived Experience
- Marginalization
- Marginalized Populations
- Member Check
- Negotiating Exit
- Otherness
- Over-Rapport
- Participant
- Participant Observation
- Participants as Co-Researchers
- Participatory Action Research
- Population
- Privacy
- Pseudonym
- Rapport
- Reciprocity
- Researcher–Participant Relationships
- Respondent
- Secondary Participants
- Trust
- Virtual Community
- Voice
- Vulnerability
- Quantitative Research, Ties to
- Research Design and Planning
- Access
- Data Analysis
- Data Archive
- Data Collection
- Data Generation
- Data Management
- Data Security
- Data Storage
- Ethics Review Process
- Funding
- Literature Review
- Methodology
- Methods
- Mixed Methods Research
- Participants as Co-Researchers
- Pilot Study
- Politics of Qualitative Research
- Project Management
- Publishing and Publication
- Qualitative Research Summer Intensive
- Quantitative Research
- Recruiting Participants
- Research Design
- Research Justification
- Research Literature
- Research Problem
- Research Proposal
- Research Question
- Research Setting
- Research Team
- Researcher as Artist
- Researcher as Instrument
- Researcher Roles
- Researcher Safety
- Researcher Sensitivity
- Researcher–Participant Relationships
- Rigor in Qualitative Research
- Sampling
- Secondary Analysis
- Secondary Data
- Theoretical Frameworks
- Theory
- Thinking Qualitatively Workshop Conference
- Triangulation
- Writing Process
- Research Ethics
- Access
- Accountability
- Anonymity
- Auditing
- Authenticity
- Benefit
- Bias
- Captive Population
- Confidentiality
- Conflict of Interest
- Data Security
- Debriefing
- Deception
- Ethics
- Ethics and New Media
- Ethics Codes
- Ethics Review Process
- Harm
- Informant
- Informed Consent
- Institutional Review Boards
- Integrity in Qualitative Research
- Key Informant
- Leaving the Field
- Negotiating Exit
- Over-Rapport
- Participant
- Participants as Co-Researchers
- Peer Debriefing
- Power
- Privacy
- Pseudonym
- Reciprocity
- Recruiting Participants
- Relational Ethics
- Researcher–Participant Relationships
- Respondent
- Risk
- Secondary Participants
- Sensitive Topics
- Trust
- Unobtrusive Research
- Vulnerability
- Rigor
- Audit Trail
- Authority
- Bias
- Bracketing
- Confirmability
- Constant Comparison
- Credibility
- Dependability
- Disengagement
- Disinterestedness
- Evidence
- Generalizability
- Inter- and Intracoder Reliability
- Member Check
- Negative Case Analysis
- Neutrality in Qualitative Research
- Objectivity
- Observer Bias
- Over-Rapport
- Peer Review
- Reactivity
- Reliability
- Replication
- Resonance
- Rigor in Qualitative Research
- Subjectivity
- Transferability
- Translatability
- Transparency
- Triangulation
- Trustworthiness
- Validity
- Value-Free Inquiry
- Verification
- Textual Analysis, Ties to
- Artifact Analysis
- Artifacts
- Autobiography
- Biography
- Content Analysis
- Conversation Analysis
- Creative Writing
- Critical Discourse Analysis
- Diaries and Journals
- Discourse
- Discourse Analysis
- Discursive Practice
- Discursive Psychology
- Document Analysis
- Documents
- Film and Video in Qualitative Research
- Historical Discourse Analysis
- Historical Research
- Historiography
- Internet in Qualitative Research
- Intertextuality
- Literature in Qualitative Research
- Multimedia in Qualitative Research
- Narrative Analysis
- Narrative Inquiry
- Narrative Interview
- Narrative Texts
- Poetry in Qualitative Research
- Rhetoric
- Text
- Textual Analysis
- Theoretical and Philosophical Frameworks
- Axiology
- Chaos and Complexity Theories
- Constructivism
- Critical Humanism
- Critical Pragmatism
- Critical Race Theory
- Critical Realism
- Critical Theory
- Deconstruction
- Discursive Psychology
- Empiricism
- Epistemology
- Essentialism
- Existentialism
- Feminist Epistemology
- Grand Narrative
- Grand Theory
- Hegemony
- Idealism
- Ideology
- Knowledge
- Nonessentialism
- Objectivism
- Ontology
- Paradigm
- Pluralism
- Positivism
- Postcolonialism
- Postmodernism
- Postpositivism
- Postrepresentation
- Poststructuralism
- Pragmatism
- Praxis
- Queer Theory
- Realism
- Reality and Multiple Realities
- Relativism
- Representation
- Semiotics
- Social Constructionism
- Structuralism
- Subjectivism
- Symbolic Interactionism
- Theoretical Frameworks
- Theory
- Truth
- Loading...
Get a 30 day FREE TRIAL
-
 Watch videos from a variety of sources bringing classroom topics to life
 -
Read modern, diverse business cases
-
Explore hundreds of books and reference titles

Read next

More like this
Sage Recommends
We found other relevant content for you on other Sage platforms.
Have you created a personal profile? Login or create a profile so that you can save clips, playlists and searches