
Entry
Reader's guide
Entries A-Z
Subject index
Measures of Association/Correlation Coefficient
In many situations, researchers are interested in evaluating the relationship between variables of interest. Such associations are important for testing theories and hypotheses in which changes in one variable are tied to changes in another. In other words, is an increase in one variable associated with a systematic increase or decrease in the other? The most frequently reported measure of association within industrial and organizational psychology is the correlation coefficient (r). Correlation is a standardized index of the extent to which two sets of scores vary together. As an index, correlation can vary between −1.00 (i.e., a perfect negative relationship) and +1.00 (i.e., a perfect positive relationship). Correlations near zero indicate the absence of a linear relationship between the variables of interest. Squaring the correlation (i.e., r2) provides an indication of the percentage of variance in one variable that can be explained by the other variable. For example, if the correlation between height and weight is .5, then 25% of the variance in height can be explained by weight, or vice versa.
Numerical Representation of Correlations
The correlation between two variables can be described in one of two ways: numerically or graphically. The following example illustrates how correlation is computed and what the numerical value indicates. First, assume that five individuals respond totwomeasures (x and y). Scores for the five individuals on x are 2, 4, 8, 6, and 5, and scores on y are 5, 7, 6, 8, and 4. Thus, the mean of x is equal to 5 (i.e., 25/5) and the mean of y is 6 (i.e., 30/5).
As a second step, deviation scores can be computed for each person on each variable by subtracting the mean of each distribution from each raw score. As a result, the deviation scores for x are −3, −1, 3, 1, and 0, and the deviation scores for y are −1, 1, 0, 2, and −2. These deviation scores can then be used to compute the standard deviation and variances for these measures.
With the current data, these values are as follows:
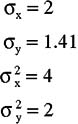
In addition to computing standard deviations and variances, deviation scores can also be used to construct a matrix of these data. Because there are only two variables, it will be a simple 2 × 2 matrix that describes all possible relationships among the data. To create the matrix, take the sums of the cross-products that are produced by cross-multiplying the deviation scores—that is x2, y2, and xy.
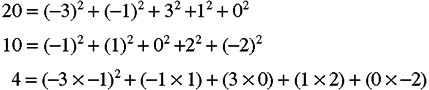
In matrix form, these values can be represented as shown in Table 1.
| Table 1 Cross-Products Matrix | ||
|---|---|---|
| x | y | |
| x | 20 | 4 |
| y | 4 | 10 |
The matrix in Table 1 can then be transformed into a variance-covariance matrix (see Table 2) by dividing the elements by the number of cases (e.g., 20/5, 4/5, 10/5).
| Table 2 Variance-Covariance Matrix | ||
|---|---|---|
| x | y | |
| x | 4.0 | 0.8 |
| y | 0.8 | 2.0 |
Importantly, the covariance in this example (0.8) is a measure of association between the two variables of interest. An important consideration in using covariance as a measure of association, however, is that it is fundamentally related to the scales of measurement for both x and y and therefore unstandardized. To get the correlation matrix, divide each of the elements by the product of the standard deviations of the variables involved. For
...
- Foundations: History
- Army Alpha/Army Beta
- Hawthorne Studies/Hawthorne Effect
- History of Industrial/Organizational Psychology in Europe and the United Kingdom
- History of Industrial/Organizational Psychology in North America
- History of Industrial/Organizational Psychology in Other Parts of the World
- Human Relations Movement
- Project A
- Scientific Management
- Scientist-Practitioner Model
- Unions
- Foundations: Ethical and Legal Issues
- Adverse Impact/Disparate Treatment/Discrimination at Work
- Affirmative Action
- Age Discrimination in Employment Act
- Americans with Disabilities Act
- Bona Fide Occupational Qualifications
- Civil Rights Act of 1964, Civil Rights Act of 1991
- Comparable Worth
- Corporate Ethics
- Corporate Social Responsibility
- Employment at Will
- Equal Pay Act of 1963
- Ethics in Industrial/Organizational Practice
- Ethics in Industrial/Organizational Research
- Family and Medical Leave Act
- Glass Ceiling
- Labor Law
- National Institute for Occupational Safety and Health/Occupational Safety and Health Administration
- Race Norming
- Sexual Discrimination
- Sexual Harassment at Work
- Stereotyping
- Test Security
- Uniform Guidelines on Employee Selection Procedures
- Workplace Accommodations for the Disabled
- Foundations: Research Methods
- Benchmarking
- Case Study Method
- Competency Modeling
- Content Coding
- Critical Incident Technique
- Cross-Cultural Research Methods and Theory
- Experimental Designs
- Focus Groups
- Lens Model
- Linkage Research and Analyses
- Longitudinal Research/Experience Sampling Technique
- Meta-Analysis
- Naturalistic Observation
- Nonexperimental Designs
- Organizational Surveys
- Policy Capturing
- Program Evaluation
- Qualitative Research Approach
- Quantitative Research Approach
- Quasi-experimental Designs
- Sampling Techniques
- Simulation, Computer Approach
- Survey Approach
- Verbal Protocol Analysis
- Foundations: Measurement Theory and Statistics
- Classical Test Theory
- Confidence Intervals/Hypothesis Testing/Effect Sizes
- Construct
- Criterion Theory
- Descriptive Statistics
- Differential Item Functioning
- Factor Analysis
- Generalizability Theory
- Incremental Validity
- Inferential Statistics
- Item Response Theory
- Measurement Scales
- Measures of Association/Correlation Coefficient
- Moderator and Mediator Variables
- Multilevel Modeling
- Multilevel Modeling Techniques
- Multitrait–Multimethod Matrix
- Nomological Networks
- Normative versus Ipsative Measurement
- Reliability
- Statistical Power
- Structural Equation Modeling
- Utility Analysis
- Validation Strategies
- Validity
- Industrial Psychology: Understanding and Assessing Individual Differences
- Affective Traits
- Big Five Taxonomy of Personality
- Biographical Data
- Cognitive Abilities
- Cognitive Ability Tests
- Computer Assessment
- Core Self-Evaluations
- Emotional Intelligence
- Employment Interview
- Genetics and Industrial/Organizational Psychology
- Graphology
- Gravitational Hypothesis
- Hardiness
- Impression Management
- Individual Assessment
- Individual Differences
- Integrity Testing
- Job Knowledge Testing
- Letters of Recommendation
- Locus of Control
- Machiavellianism
- Motivational Traits
- Need for Achievement, Power, and Affiliation
- Optimism and Pessimism
- Personality
- Personality Assessment
- Physical Performance Assessment
- Practical Intelligence
- Protestant Work Ethic
- Self-Esteem
- Situational Judgment Tests
- Standardized Testing
- Stereotype Threat
- Trainability and Adaptability
- Type A and Type B Personalities
- Work Samples
- Work Values
- Industrial Psychology: Employment, Staffing, and Career Issues
- Dictionary of Occupational Titles
- Applicant/Test-Taker Reactions
- Banding
- Career Development
- Careers
- Compensation
- Credentialing
- Dirty Work
- Drug and Alcohol Testing
- Electronic Human Resources Management
- Employee Selection
- Executive Selection
- Exit Survey (Exit Interview)
- Expatriates
- Gainsharing and Profit Sharing
- Gay, Lesbian, and Bisexual Issues at Work
- Human Resources Strategy
- Job Advertisements
- Job Analysis
- Job Analysis Methods
- Job Choice
- Job Description
- Job Evaluation
- Job Search
- Job Typologies
- Occupational Information Network (O*NET)
- Older Worker Issues
- Person–Environment Fit
- Person–Job Fit
- Person–Organization Fit
- Person–Vocation Fit
- Placement and Classification
- Prescreening Assessment Methods for Personnel Selection
- Realistic Job Preview
- Recruitment
- Recruitment Sources
- Retirement
- Selection Strategies
- Selection: Occupational Tailoring
- Succession Planning
- Underemployment
- Industrial Psychology: Developing, Training, and Evaluating Employees
- 360-Degree Feedback
- Assessment Center
- Assessment Center Methods
- Distance Learning
- Diversity Training
- Electronic Performance Monitoring
- Employee Assistance Program
- Executive Coaching
- Feedback Seeking
- Frame-of-Reference Training
- Leadership Development
- Mentoring
- Organizational Socialization
- Organizational Socialization Tactics
- Performance Appraisal
- Performance Appraisal, Objective Indexes
- Performance Appraisal, Subjective Indexes
- Performance Feedback
- Rating Errors and Perceptual Biases
- Self-Fulfilling Prophecy: Pygmalion Effect
- Socialization: Employee Proactive Behaviors
- Training
- Training Evaluation
- Training Methods
- Training Needs Assessment and Analysis
- Transfer of Training
- Industrial Psychology: Productive and Counterproductive Employee Behavior
- Contextual Performance/Prosocial Behavior/Organizational Citizenship Behavior
- Counterproductive Work Behaviors
- Counterproductive Work Behaviors, Interpersonal Deviance
- Counterproductive Work Behaviors, Organizational Deviance
- Creativity at Work
- Customer Satisfaction with Services
- Cyberloafing at Work
- Innovation
- Integrity at Work
- Job Performance Models
- Organizational Retaliatory Behavior
- Theft at Work
- Time Management
- Violence at Work
- Whistle-Blowers
- Withdrawal Behaviors, Absenteeism
- Withdrawal Behaviors, Lateness
- Withdrawal Behaviors, Turnover
- Workplace Incivility
- Industrial Psychology: Motivation and Job Design
- Action Theory
- Control Theory
- Empowerment
- Expectancy Theory of Work Motivation
- Goal-Setting Theory
- Human–Computer Interaction
- Incentives
- Intrinsic and Extrinsic Work Motivation
- Job Characteristics Theory
- Job Design
- Job Involvement
- Job Rotation
- Job Sharing
- Need Theories of Work Motivation
- Path–Goal Theory
- Positive Psychology Applied to Work
- Self-Concept Theory of Work Motivation
- Self-Efficacy
- Self-Regulation Theory
- Social Cognitive Theory
- Telecommuting
- Theory of Work Adjustment
- Two-Factor Theory
- Work Motivation
- Workaholism
- Industrial Psychology: Leadership and Management
- Abusive Supervision
- Behavioral Approach to Leadership
- Charismatic Leadership Theory
- Employee Grievance Systems
- Global Leadership and Organizational Behavior Effectiveness Project
- Implicit Theory of Leadership
- Judgment and Decision-Making Process
- Judgment and Decision-Making Process: Advice Giving and Taking
- Judgment and Decision-Making Process: Heuristics, Cognitive Biases, and Contextual Influences
- Leader–Member Exchange Theory
- Leadership and Supervision
- Least Preferred Coworker Theory
- Life-cycle Model of Leadership
- Normative Models of Decision Making and Leadership
- Reinforcement Theory of Work Motivation
- Situational Approach to Leadership
- Spirituality and Leadership at Work
- Trait Approach to Leadership
- Transformational and Transactional Leadership
- Trust
- Industrial Psychology: Groups, Teams, and Working with Others
- Conflict at Work
- Conflict Management
- Diversity in the Workplace
- Group Cohesiveness
- Group Decision-Making Quality and Performance
- Group Decision-Making Techniques
- Group Development
- Group Dynamics and Processes
- Groups
- Groupthink
- Input–Process–Output Model of Team Effectiveness
- Intergroup Relations
- Interpersonal Communication
- Interpersonal Communication Styles
- Justice in Teams
- Meetings at Work
- Negotiation, Mediation, and Arbitration
- Networking
- Social Exchange Theory
- Social Loafing
- Social Norms and Conformity
- Social Support
- Team Building
- Team Mental Model
- Team-Based Rewards
- Virtual Teams
- Workplace Romance
- Industrial Psychology: Employee Well-Being and Attitudes
- Affective Events Theory
- Attitudes and Beliefs
- Boredom at Work
- Emotional Burnout
- Emotional Labor
- Emotions
- Eustress
- Job Satisfaction
- Job Satisfaction Measurement
- Job Security/Insecurity
- Mood
- Morale
- Organizational Commitment
- Organizational Cynicism
- Organizational Justice
- Psychological Contract
- Quality of Work Life
- Role Ambiguity
- Role Conflict
- Role Overload and Underload
- Stress, Consequences
- Stress, Coping and Management
- Stress, Models and Theories
- Theory of Reasoned Action/Theory of Planned Behavior
- Union Commitment
- Work–Life Balance
- Industrial Psychology: Organizational Structure, Design, and Change
- Attraction–Selection–Attrition Model
- Automation/Advanced Manufacturing Technology/Computer-Based Integrated Technology
- Balanced Scorecard
- Compressed Workweek
- Downsizing
- Entrepreneurship
- Flexible Work Schedules
- Globalization
- High-Performance Organization Model
- Learning Organizations
- Mergers, Acquisitions, and Strategic Alliances
- Organizational Behavior
- Organizational Behavior Management
- Organizational Change
- Organizational Change, Resistance to
- Organizational Climate
- Organizational Communication, Formal
- Organizational Communication, Informal
- Organizational Culture
- Organizational Development
- Organizational Image
- Organizational Politics
- Organizational Sensemaking
- Organizational Structure
- Outsourcing
- Shiftwork
- Sociotechnical Approach
- Strategic Planning
- Survivor Syndrome
- Terrorism and Work
- Theory of Action
- Total Quality Management
- Virtual Organizations
- Workplace Injuries
- Workplace Safety
- Professional Organizations and Related Fields
- Loading...
Get a 30 day FREE TRIAL
-
 Watch videos from a variety of sources bringing classroom topics to life
 -
Read modern, diverse business cases
-
Explore hundreds of books and reference titles

Read next

More like this
Sage Recommends
We found other relevant content for you on other Sage platforms.
Have you created a personal profile? Login or create a profile so that you can save clips, playlists and searches