
Entry
Reader's guide
Entries A-Z
Subject index
Odds and Odds Ratio, Risk Ratio
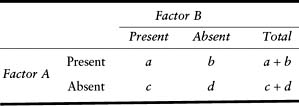
The main goal of many medical studies is to evaluate the effect of a treatment or the risk of disease under given conditions. This entry introduces and discusses measures of effect and/or risk when the factors or variables of interest are categorical (i.e., nominal) in nature. The discussion focuses on the case of dichotomous variables (factors), that is, those that take only two values that often indicate the presence or absence of a characteristic (disease, treatment, exposure, etc.). The data consist of information on n individuals who have been categorized according to the presence or absence of two factors. The information is presented in a 2 × 2 contingency table like the one in Table 1.
The numbers in the table denote the frequency of each cell. For example, a is the number of individuals for whom both factors were present, and b those for whom A was present and B was absent. Thus, the total number of patients is n = a + b + c + d. Common types of factors are exposure, treatment, and disease. The statistical significance of the association between the two factors is tested using the chisquare test (or the likelihood test). The result of the test is a p value, which measures the chance of the observed relationship under the assumption that there is none. Accordingly, a small p value (e.g., < .05) leads to a “significant” result and the rejection of the assumption of no association. The size of the p value is determined, in a critical way, by the sample size and can't be used to assess the strength of the association. When the association (or effect, when one factor is the “cause” of the other) is significant, the measure of its strength is critical. Below are the most common measures of association.
Definition 1. The relative risk (RR) is defined as
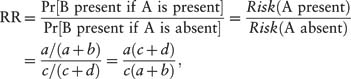
where Pr[ ] indicates probability.
Definition 2. The risk difference (RD), also called attributable risk, is defined as

Definition 3. The odds ratio (OR) is defined as

Table 1 The 2 × 2 contingency table
Comparing Measures
As mentioned, the significance of the association is tested using the chi-square test (or the likelihood test). However, when it comes to measuring the strength of the association, there is not only a lack of consensus but also considerable confusion. The three measures defined above assess the strength of the relationship but do so in different ways. The confusion in the interpretation of these measures is caused by the fact that each one is based on ratios (relative frequencies or odds). So, in the case of RR and OR, the reader is faced with the daunting task of interpreting ratios of ratios. It is therefore crucial to understand the differences and, consequently, the correct way to interpret these measures.
The RR is a relative measure interpreted as a percentage. It is important to note that both RR and 1/RR are relative risks and assess the strength of an association from a different point of view. The choice of denominator, which is not always obvious, determines the value and the interpretation. For example, RR = 1.30 describes a risk increase of 30%, whereas 1/RR = .77 is interpreted as a 23% decrease in risk. The key is to realize that RR describes a 30% risk increase of exposure (i.e., A present) relative to nonexposure (i.e., A absent), whereas 1/RR represents a 23% risk decrease in nonexposure relative to exposure. Without careful description, the interpretation of the value will depend on whether RR or 1/RR is used, when, in fact, they are measuring the same association. In general, relative measures such as RR and OR are not easy to interpret and can be misleading. The first two columns of Table 2 contain combinations of risks that yield the same value of RR, but represent very different situations.
...
- Basis for Making the Decision
- Acceptability Curves and Confidence Ellipses
- Beneficence
- Bioethics
- Choice Theories
- Construction of Values
- Cost-Benefit Analysis
- Cost-Comparison Analysis
- Cost-Consequence Analysis
- Cost-Effectiveness Analysis
- Cost-Minimization Analysis
- Cost-Utility Analysis
- Decision Quality
- Distributive Justice
- Dominance
- Equity
- Evaluating Consequences
- Expected Utility Theory
- Expected Value of Perfect Information
- Extended Dominance
- Health Production Function
- League Tables for Incremental Cost-Effectivenes: Ratios
- Marginal or Incremental Analysis, Cost-Effectiveness Ratio
- Monetary Value
- Moral Choice and Public Policy
- Net Benefit Regression
- Net Monetary Benefit
- Nonexpected Utility Theories
- Pharmacoeconomics
- Protected Values
- Rank-Dependent Utility Theory
- Return on Investment
- Risk-Benefit Trade-Off
- Subjective Expected Utility Theory
- Toss-Ups and Close Calls
- Value-Based Insurance Design
- Welfare, Welfarism, and Extrawelfarism
- Biostatistics and Clinical Epidemiology
- Analysis of Covariance (ANCOVA)
- Analysis of Variance (ANOVA)
- Attributable Risk
- Basic Common Statistical Tests: Chi-Square Test, t Test, Nonparametric Test
- Bayes's Theorem
- Bayesian Analysis
- Bayesian Evidence Synthesis
- Bayesian Networks
- Bias
- Bias in Scientific Studies
- Brier Scores
- Calibration
- Case Control
- Causal Inference and Diagrams
- Causal Inference in Medical Decision Making
- Conditional Independence
- Conditional Probability
- Confidence Intervals
- Confounding and Effect Modulation
- Cox Proportional Hazards Regression
- Decision Rules
- Diagnostic Tests
- Discrimination
- Distributions: Overview
- Dynamic Treatment Regimens
- Effect Size
- Equivalence Testing
- Experimental Designs
- Factor Analysis and Principal Components Analysis
- Fixed Versus Random Effects
- Frequentist Approach
- Hazard Ratio
- Hypothesis Testing
- Index Test
- Intraclass Correlation Coefficient
- Likelihood Ratio
- Log-Rank Test
- Logic Regression
- Logistic Regression
- Maximum Likelihood Estimation Methods
- Measures of Central Tendency
- Measures of Frequency and Summary
- Measures of Variability
- Meta-Analysis and Literature Review
- Mixed and Indirect Comparisons
- Multivariate Analysis of Variance (MANOVA)
- Nomograms
- Number Needed to Treat
- Odds and Odds Ratio, Risk Ratio
- Ordinary Least Squares Regression
- Parametric Survival Analysis
- Poisson and Negative Binomial Regression
- Positivity Criterion and Cutoff Values
- Prediction Rules and Modeling
- Probability
- Propensity Scores
- Randomized Clinical Trials
- Receiver Operating Characteristic (ROC) Curve
- Recurrent Events
- Recursive Partitioning
- Regression to the Mean
- Sample Size and Power
- Screening Programs
- Statistical Notations
- Statistical Testing: Overview
- Subjective Probability
- Subset Analysis: Insights and Pitfalls
- Survival Analysis
- Tables, Two-by-Two and Contingency
- Variance and Covariance
- Violations of Probability Theory
- Weighted Least Squares
- Decision Analysis and Related Mathematical Models
- Applied Decision Analysis
- Boolean Algebra and Nodes
- Decision Analyses, Common Errors Made in Conducting
- Decision Curve Analysis
- Decision Tree: Introduction
- Decision Trees, Advanced Techniques in Constructing
- Decision Trees, Construction
- Decision Trees, Evaluation
- Decision Trees, Evaluation With Monte Carlo
- Decision Trees: Sensitivity Analysis, Basic and Probabilistic
- Decision Trees: Sensitivity Analysis, Deterministic
- Declining Exponential Approximation of Life Expectancy
- Deterministic Analysis
- Discrete-Event Simulation
- Disease Management Simulation Modeling
- Expected Value of Sample Information, Net Benefit of Sampling
- Influence Diagrams
- Markov Models
- Markov Models, Applications to Medical Decision Making
- Markov Models, Cycles
- Markov Processes
- Reference Case
- Steady-State Models
- Stochastic Medical Informatics
- Subtrees, Use in Constructing Decision Trees
- Test-Treatment Threshold
- Time Horizon
- Tornado Diagram
- Tree Structure, Advanced Techniques
- Health Outcomes and Measurement
- Complications or Adverse Effects of Treatment
- Cost-Identification Analysis
- Costs, Direct Versus Indirect
- Costs, Fixed Versus Variable
- Costs, Opportunity
- Costs, Out-of-Pocket
- Costs, Semifixed Versus Semivariable
- Costs, Spillover
- Economics, Health Economics
- Efficacy Versus Effectiveness
- Efficient Frontier
- Health Outcomes Assessment
- Health Status Measurement Standards
- Health Status Measurement, Assessing Meaningful Change
- Health Status Measurement, Construct Validity
- Health Status Measurement, Face and Content Validity
- Health Status Measurement, Floor and Ceiling Effects
- Health Status Measurement, Generic Versus Condition-Specific Measures
- Health Status Measurement, Minimal Clinically Significant Differences, and Anchor Versus Distribution Methods
- Health Status Measurement, Reliability and Internal Consistency
- Health Status Measurement, Responsiveness and Sensitivity to Change
- Human Capital Approach
- Life Expectancy
- Morbidity
- Mortality
- Oncology Health-Related Quality of Life Assessment
- Outcomes Research
- Patient Satisfaction
- Regret
- Report Cards, Hospitals and Physicians
- Risk Adjustment of Outcomes
- SF-36 and SF-12 Health Surveys
- SF-6D
- Sickness Impact Profile
- Sunk Costs
- Impact or Weight or Utility of the Possible Outcomes
- Certainty Equivalent
- Chained Gamble
- Conjoint Analysis
- Contingent Valuation
- Cost Measurement Methods
- Decomposed Measurement
- Disability-Adjusted Life Years (DALYs)
- Discounting
- Discrete Choice
- Disutility
- EuroQol (EQ-5D)
- Health Utilities Index Mark 2 and 3 (HUI2, HUI3)
- Healthy Years Equivalents
- Holistic Measurement
- Multi-Attribute Utility Theory
- Person Trade-Off
- Quality of Well-Being Scale
- Quality-Adjusted Life Years (QALYs)
- Quality-Adjusted Time Without Symptoms or Toxicity (Q-TWiST)
- SMARTS and SMARTER
- Split Choice
- Utilities for Joint Health States
- Utility Assessment Techniques
- Willingness to Pay
- Other Techniques, Theories, and Tools
- Artificial Neural Networks
- Bayesian Networks
- Bioinformatics
- Chaos Theory
- Clinical Algorithms and Practice Guidelines
- Complexity
- Computer-Assisted Decision Making
- Constraint Theory
- Decision Board
- Decisional Conflict
- Error and Human Factors Analyses
- Ethnographic Methods
- Expert Systems
- Patient Decision Aids
- Qualitative Methods
- Story-Based Decision Making
- Support Vector Machines
- Team Dynamics and Group Decision Making
- Threshold Technique
- Perspective of the Decision Maker
- Advance Directives and End-of-Life Decision Making
- Consumer-Directed Health Plans
- Cultural Issues
- Data Quality
- Decision Making in Advanced Disease
- Decisions Faced by Hospital Ethics Committees
- Decisions Faced by Institutional Review Boards
- Decisions Faced by Nongovernment Payers of Healthcare: Managed Care
- Decisions Faced by Patients: Primary Care
- Decisions Faced by Surrogates or Proxies for the Patient, Durable Power of Attorney
- Diagnostic Process, Making a Diagnosis
- Differential Diagnosis
- Evaluating and Integrating Research Into Clinical Practice
- Evidence Synthesis
- Evidence-Based Medicine
- Expert Opinion
- Genetic Testing
- Government Perspective, General Healthcare
- Government Perspective, Informed Policy Choice
- Government Perspective, Public Health Issues
- Health Insurance Portability and Accountability Act Privacy Rule
- Health Risk Management
- Informed Consent
- Informed Decision Making
- International Differences in Healthcare Systems
- Law and Court Decision Making
- Medicaid
- Medical Decisions and Ethics in the Military Context
- Medical Errors and Errors in Healthcare Delivery
- Medicare
- Models of Physician–Patient Relationship
- Patient Rights
- Physician Estimates of Prognosis
- Rationing
- Religious Factors
- Shared Decision Making
- Surrogate Decision Making
- Teaching Diagnostic Clinical Reasoning
- Technology Assessments
- Terminating Treatment, Physician Perspective
- Treatment Choices
- Trust in Healthcare
- The Psychology Underlying Decision Making
- Accountability
- Allais Paradox
- Associative Thinking
- Attention Limits
- Attraction Effect
- Automatic Thinking
- Axioms
- Biases in Human Prediction
- Bounded Rationality and Emotions
- Certainty Effect
- Cognitive Psychology and Processes
- Coincidence
- Computational Limitations
- Confirmation Bias
- Conflicts of Interest and Evidence-Based Clinical Medicine
- Conjunction Probability Error
- Context Effects
- Contextual Error
- Counterfactual Thinking
- Cues
- Decision Making and Affect
- Decision Modes
- Decision Psychology
- Decision Weights
- Decision-Making Competence, Aging and Mental Status
- Deliberation and Choice Processes
- Developmental Theories
- Dual-Process Theory
- Dynamic Decision Making
- Editing, Segregation of Prospects
- Emotion and Choice
- Errors in Clinical Reasoning
- Experience and Evaluations
- Fear
- Frequency Estimation
- Fuzzy-Trace Theory
- Gain/Loss Framing Effects
- Gambles
- Hedonic Prediction and Relativism
- Heuristics
- Human Cognitive Systems
- Information Integration Theory
- Intuition Versus Analysis
- Irrational Persistence in Belief
- Judgment
- Judgment Modes
- Learning and Memory in Medical Training
- Lens Model
- Lottery
- Managing Variability and Uncertainty
- Memory Reconstruction
- Mental Accounting
- Minerva-DM
- Mood Effects
- Moral Factors
- Motivation
- Numeracy
- Overinclusive Thinking
- Pain
- Pattern Recognition
- Personality, Choices
- Preference Reversals
- Probability Errors
- Probability, Verbal Expressions of
- Problem Solving
- Procedural Invariance and Its Violations
- Prospect Theory
- Range-Frequency Theory
- Risk Attitude
- Risk Aversion
- Risk Communication
- Risk Perception
- Scaling
- Social Factors
- Social Judgment Theory
- Stigma Susceptibility
- Support Theory
- Uncertainty in Medical Decisions
- Unreliability of Memory
- Value Functions in Domains of Gains and Losses
- Worldviews
- Loading...
Get a 30 day FREE TRIAL
-
 Watch videos from a variety of sources bringing classroom topics to life
 -
Read modern, diverse business cases
-
Explore hundreds of books and reference titles

Read next

More like this
Sage Recommends
We found other relevant content for you on other Sage platforms.
Have you created a personal profile? Login or create a profile so that you can save clips, playlists and searches