Entry
Reader's guide
Entries A-Z
Subject index
Time, Representation of
Our world is a dynamic place. Everything in our environment is changing constantly—from land use and traffic patterns to climate and wildlife habitat. Understanding spatial phenomena requires examining not only patterns over space but also how those patterns change over time as a process. Earth-related processes tend to be highly complex, involving many aspects that interact at various space–time scales. This tendency is further complicated by the fact that space–time lags are ubiquitous in cause–effect associations. Examining how things change over time allows us to discover temporal patterns (cycles and rhythms of occurrence). From this, we gain an understanding of cause and effect so that we can predict and plan effectively.
Although geographic information systems (GIS) have become an essential software tool for examining and analyzing just about any Earth-related phenomenon, representing temporal dynamics within GIS has proven to be a significant challenge. Geographic information systems maintain a static view of the world inherited from cartographic tradition. Although not currently possible in any straightforward manner because the data models and query languages used in current GIS do not explicitly incorporate the temporal dimension, some simple questions that might be asked using GIS in an example application of land use change could include the following:
- What did the distribution of single-family housing look like 15 years ago?
- What residential areas were added between 1980 and 1998?
- What areas changed from a predominance of agricultural to residential land use since the enactment of agricultural preservation regulations?
- What agricultural areas are most likely to be converted to other uses within the next 10 years?
Basic Approaches for Digital Representation of Space–Time Data
There have been recent introductions of GIS products for analyzing the occurrence of discrete point data over space and time (e.g., incidence of disease or crime) and for tracking point objects as they travel through space and time (e.g., delivery vans). The Tracking Analyst from the Environmental Systems Research Institute (ESRI) is one such GIS product. Dealing with areal data, however, is more challenging. Areal objects, such as residential districts, wetlands, and areas of poor air quality, not only move but also can grow, shrink, and change shape. Implementations for dealing with this type of data currently involve improvising with the (static) raster (i.e., grid) and vector data models currently inherent in GIS.
The primary conceptual approach currently used for representation of areal space–time data in GIS is known as the snapshot approach—sequential images or snapshots of values for a given variable over a given area for a known point in time (Figure 1a). These snapshots are conceptually equivalent to slices extracted from the continuous space–time cube. Another conceptual approach for representing space–time data is what Gail Langran called “base state with amendments” (Figure 1b), where only the changes known at specific times are recorded. A third conceptual scheme is the space–time composite, which can be thought of as the result of stacking all successive changes on top of one another as virtual transparencies, flattening out the space–time cube into a single cumulative depiction (Figure 1c).
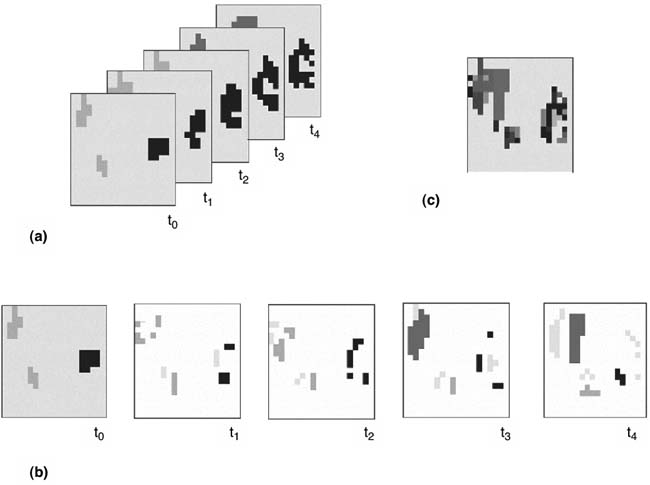
Figure 1 The Three Space-Based Approaches to Space–Time Representation: (a) Snapshots, (b) Base State With Amendments, and (c) Space–Time Composites
Sequent snapshots usually are implemented as gridded raster images, although vector implementation can also be done. This approach is easy to implement using the standard raster and vector data models available in existing GIS by “tricking” the software. Instead of individual grids representing a set of thematic layers (e.g., elevation, vegetation, soil type), each spatially registered layer represents the state at a given moment in time for one of these themes (e.g., a vegetation sequence). Because modern computer graphics use rasters, the gridded implementation of sequent snapshots allows these to be displayed as a movie similar to the radar map on the Weather Channel. Under software control, the display sequence can be speeded up, slowed down, or reversed. Temporal change can also be calculated by finding the differences between two snapshots.
...
- Cartography/Geographic Information Systems
- Agent-Based Modeling
- Automated Geography
- Cartogram
- Cartography
- Cellular Automata
- Computational Models of Space
- Digital Earth
- Ecological Fallacy
- Fractal
- Geodemographics
- Geoslavery
- GIS
- GPS
- Humanistic GIScience
- Information Ecology
- Limits of Computation
- Location-Based Services
- Multicriteria Analysis
- Neural Computing
- Ontology
- Overlay
- Social Informatics
- Spatial Autocorrelation
- Spatial Dependence
- Spatial Heterogeneity
- Spatially Integrated Social Science
- Tessellation
- Time, Representation of
- Uncertainty
- Economic Geography
- Agglomeration Economies
- Agriculture, Industrialized
- Agriculture, Preindustrial
- Agro-Food System
- Applied Geography
- Capital
- Carrying Capacity
- Cartels
- Census
- Census Tracts
- Circuits of Capital
- Class
- Class War
- Colonialism
- Commodity
- Comparative Advantage
- Competitive Advantage
- Conservation
- Consumption, Geography and
- Core–Periphery Models
- Crisis
- Debt and Debt Crisis
- Deindustrialization
- Dependency Theory
- Developing World
- Development Theory
- Division of Labor
- Economic Geography
- Economies of Scale
- Economies of Scope
- Export Processing Zones
- Externalities
- Factors of Production
- Flexible Production
- Fordism
- Globalization
- Gravity Model
- Gross Domestic Product
- Growth Pole
- High Technology
- Import Substitution
- Incubator
- Industrial Districts
- Industrial Revolution
- Informal Economy
- Infrastructure
- Innovation, Geography of
- Input–Output Models
- Labor Theory of Value
- Labor, Geography of
- Location Theory
- Mode of Production
- Modernization Theory
- Money, Geography of
- Neocolonialism
- Neoliberalism
- New International Division of Labor
- Newly Industrializing Countries
- Postindustrial Society
- Producer Services
- Product Cycle
- Profit
- Resource
- Restructuring
- Rural Development
- Rustbelt
- Structural Adjustment
- Sustainable Development
- Telecommunications, Geography and
- Terms of Trade
- Trade
- Transnational Corporations
- Transportation Geography
- Underdevelopment
- Uneven Development
- World Economy
- Geographic Theory and History
- Anthropogeography
- Berkeley School
- Chorology
- Discourse
- Ethnocentrism
- Eurocentrism
- Existentialism
- Exploration, Geography and
- History of Geography
- Human Agency
- Humanistic Geography
- Ideology
- Idiographic
- Imaginative Geographies
- Interviewing
- Locality
- Logical Positivism
- Marxism, Geography and
- Model
- Nomothetic
- Orientalism
- Paradigm
- Participant Observation
- Phenomenology
- Place
- Postcolonialism
- Postmodernism
- Poststructuralism
- Qualitative Research
- Quantitative Methods
- Quantitative Revolution
- Queer Theory
- Radical Geography
- Realism
- Regional Geography
- Scale
- Situated Knowledge
- Spaces of Representation
- Spatial Analysis
- Structuralism
- Structuration Theory
- Subaltern Studies
- Subject and Subjectivity
- Theory
- Tobler's First Law of Geography
- Political Geography
- Anticolonialism
- Boundaries
- Bureaucracy
- Civil Society
- Communism
- Critical Geopolitics
- Decolonization
- Democracy
- Electoral Geography
- Environmental Determinism
- Environmental Justice
- Geopolitics
- Gerrymandering
- Hegemony
- Imperialism
- Institutions
- Justice, Geography of
- Law, Geography of
- Local State
- Nation-State
- Nationalism
- Political Ecology
- Political Geography
- Power
- Redistricting
- Resistance
- Social Movement
- Socialism
- Sovereignty
- State
- World Systems Theory
- Social/Cultural Geography
- AIDS
- Animals
- Art, Geography and
- Behavioral Geography
- Body, Geography of
- Children, Geography of
- Communications, Geography of
- Crime, Geography of
- Critical Human Geography
- Cultural Ecology
- Cultural Geography
- Cultural Landscape
- Cultural Turn
- Culture
- Culture Hearth
- Cyberspace
- Demographic Transition
- Diaspora
- Diffusion
- Disability, Geography of
- Domestic Sphere
- Emotions, Geography and
- Empiricism
- Enlightenment, The
- Environmental Perception
- Epistemology
- Ethics, Geography and
- Ethnicity
- Femininity
- Feminisms
- Feminist Geographies
- Feminist Methodologies
- Fertility Rates
- Fieldwork
- Film, Geography and
- Food, Geography of
- Gays, Geography and/of
- Gender and Geography
- Geography Education
- Health and Healthcare, Geography of
- Heterosexism
- Historic Preservation
- Historical Geography
- Home
- Homophobia
- Hunger and Famine, Geography of
- Identity, Geography and
- Languages, Geography of
- Lesbians, Geography of/and
- Literature, Geography and
- Malthusianism
- Masculinities
- Medical Geography
- Mental Maps
- Migration
- Mobility
- Modernity
- Mortality Rates
- Music and Sound, Geography of
- Natural Growth Rate
- Nature and Culture
- Nomadism
- Other/Otherness
- Peasants/Peasantry
- Photography, Geography and
- Place Names
- Popular Culture, Geography and
- Population Pyramid
- Population, Geography and
- Poverty
- Production of Space
- Psychoanalysis, Geography and
- Race and Racism
- Religion, Geography of
- Rural Geography
- Segregation
- Sense of Place
- Sequent Occupance
- Sexuality, Geography of
- Social Geography
- Social Justice
- Space, Human Geography and
- Spatial Inequality
- Spatiality
- Sport, Geography of
- Symbols and Symbolism
- Text and Textuality
- Time Geography
- Time–Space Compression
- Topophilia
- Tourism, Geography of
- Travel Writing, Geography and
- Virtual Geographies
- Vision
- Whiteness
- Wilderness
- Writing
- Urban Geography
- Built Environment
- Central Business District
- Chicago School
- City Government
- Cognitive Models of Space
- Derelict Zones
- Edge Cities
- Exurbs
- Gated Community
- Gentrification
- Ghetto
- Global Cities
- Growth Machine
- Homelessness
- Housing and Housing Markets
- HUD
- Invasion–Succession
- Locally Unwanted Land Uses
- Neighborhood
- Neighborhood Change
- New Urbanism
- NIMBY
- Open Space
- Public Space
- Rent Gap
- Rural–Urban Continuum
- Squatter Settlement
- Suburbs
- Sunbelt
- Urban and Regional Planning
- Urban Ecology
- Urban Entrepreneurialism
- Urban Fringe
- Urban Geography
- Urban Managerialism
- Urban Social Movements
- Urban Spatial Structure
- Urban Sprawl
- Urban Underclass
- Urbanization
- Zoning
- Loading...
Get a 30 day FREE TRIAL
-
 Watch videos from a variety of sources bringing classroom topics to life
 -
Read modern, diverse business cases
-
Explore hundreds of books and reference titles

Read next

More like this
Sage Recommends
We found other relevant content for you on other Sage platforms.
Have you created a personal profile? Login or create a profile so that you can save clips, playlists and searches