[Page 1347]- Americans 65 Years and Older As a Percentage of Total U.S. Population, 1950–2050 1348
- Annual Number of Births, 1946 to 2001 1349
- Average Reading, Mathematics, and Science Literacy Scores of 15-Year-Olds, by Sex, 2000 1350
- Basic Indicators of World Health Organization Members, 2001 1351
- Child Care Arrangements of Preschool Children, by Age, Race/Ethnicity, and Type of Child Care Arrangement, 1999 1355
- Death Rates for Leading Causes of Death for All Ages: United States, 1950–2002 1356
- Enrollment in Grades K8 and 9–12 of Elementary and Secondary Schools 1357
- General Statistics of Public Libraries, by Population, 2000 1358
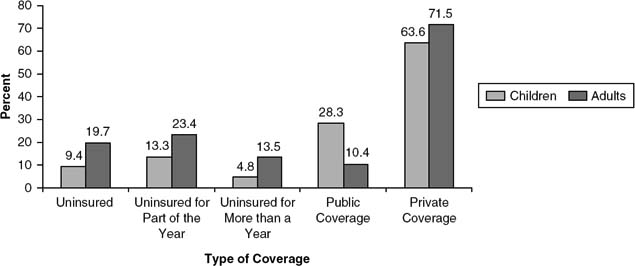
- Health Insurance Coverage by Age Group in United States 1358
- High School Graduates 1987–1988 to 2012–2013 1359
- Life Expectancy in All Member States of World Health Organization in 2001 1360
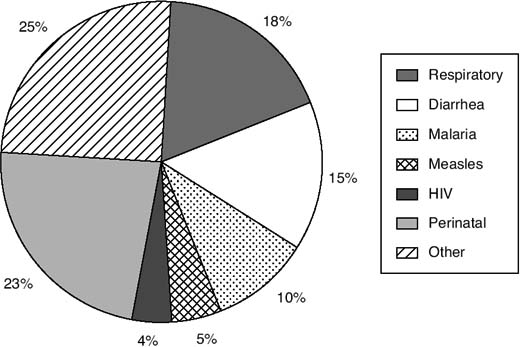
- Mortality Causes under 5 Years Old in 2002 1364
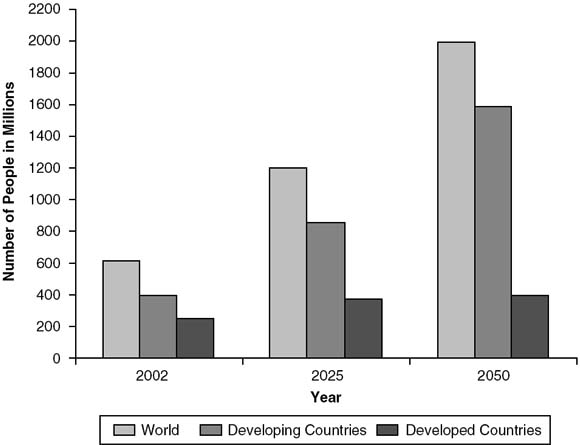
- Number of People Age 60 and Older 1364
- Number of School-Associated Violent Deaths, 1992–2000 1365
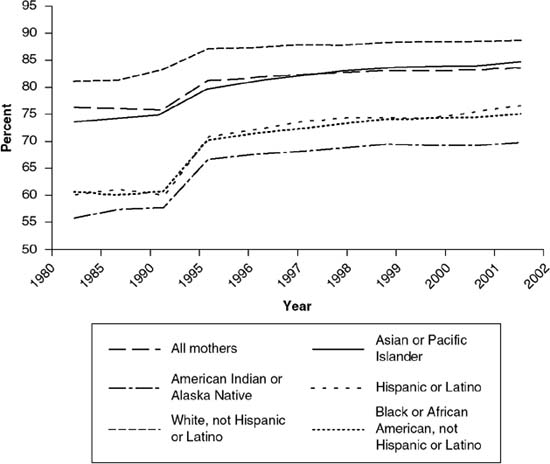
- Percent of Early Prenatal Care by Race: United States, 1980–2002 1365
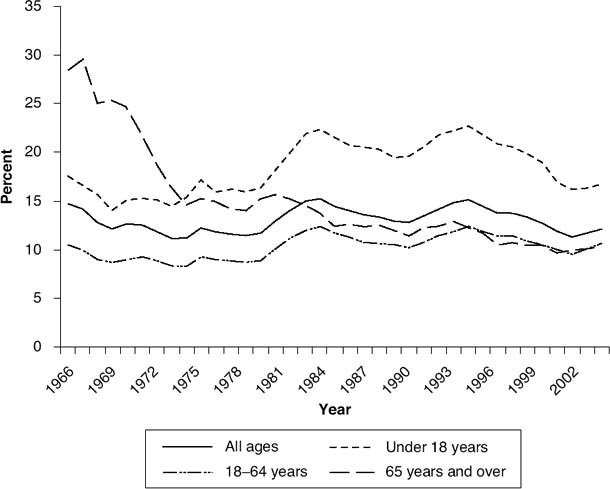
- Percent of Families with Income below the Poverty Level 1366
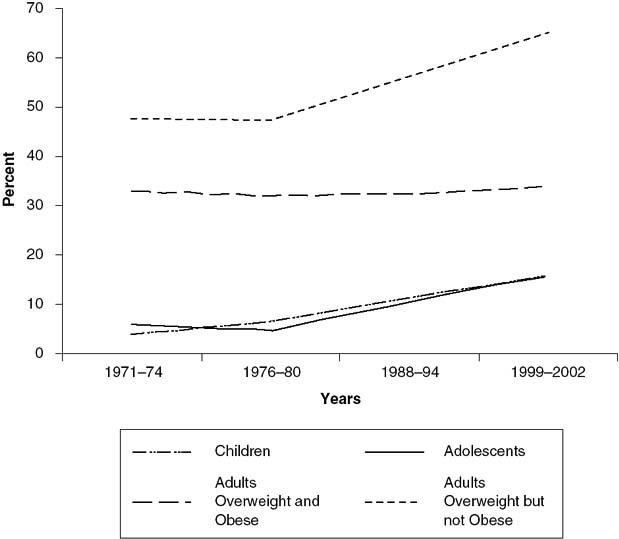
- Percent Overweight and Obesity by Age: United States, 1960–2002 1366
- Percentage of Children Ages 3–5 Not Yet Enrolled in Kindergarten Who Participated in Home Literacy Activities with a Family Member Three or More Times per Week 1367
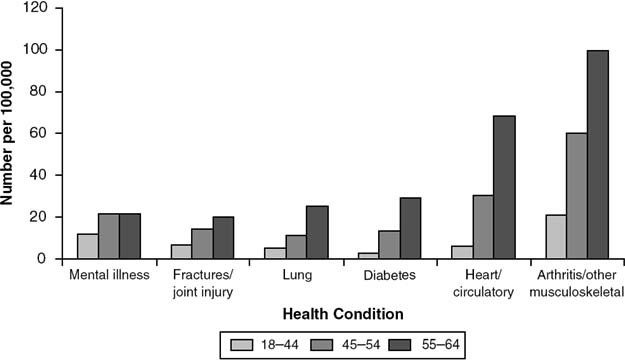
- Selected Chronic Health Conditions Causing Limitation of Activity among Working-Age Adults by Age: United States, 2000–2002 1367
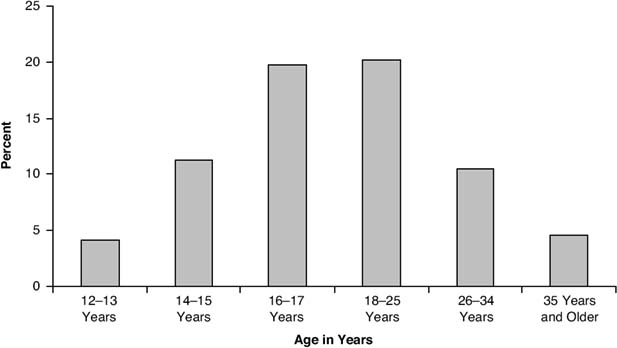
- Use of Illicit Drugs in the Past Month by Age, 2003 1368
- Years of Life Lost in Thousands by Risk Factor and Sex, 2000 1369
[Page 1348]| Americans 65 Years and Older As A Percentage of Total U.S. Population, 1950–2050 |
|---|
| Year | Total | 65 years and over | 75 years and over |
| 1950 | 150,216,110 | 12,256,850 | 3,852,395 |
| 1960 | 179,325,657 | 16,207,237 | 5,359,338 |
| 1970 | 203,211,926 | 20,065,502 | 7,630,046 |
| 1980 | 226,545,805 | 25,549,427 | 9,968,822 |
| 1990 | 248,709,873 | 31,078,895 | 13,033,400 |
| 2000 | 281,421,906 | 34,991,753 | 16,600,767 |
| 2010 | 308,935,581 | 40,243,713 | 18,974,204 |
| 2020 | 335,804,546 | 54,631,891 | 22,852,732 |
| 2030 | 363,584,435 | 71,453,471 | 33,505,538 |
| 2040 | 391,945,658 | 80,049,634 | 44,579,726 |
| 2050 | 419,853,587 | 86,705,637 | 48,763,200 |
| SOURCE: U.S. Census (2000). | | | |
[Page 1349]
| Annual Number of Births, 1946 To 2001 (In Thousands) |
|---|
| Year | Number of births | Year | Number of births |
| 1946 | 3,426 | 1974 | 3,160 |
| 1947 | 3,834 | 1975 | 3,144 |
| 1948 | 3,655 | 1976 | 3,168 |
| 1949 | 3,667 | 1977 | 3,327 |
| 1950 | 3,645 | 1978 | 3,333 |
| 1951 | 3,845 | 1979 | 3,494 |
| 1952 | 3,933 | 1980 | 3,612 |
| 1953 | 3,989 | 1981 | 3,629 |
| 1954 | 4,102 | 1982 | 3,681 |
| 1955 | 4,128 | 1983 | 3,639 |
| 1956 | 4,244 | 1984 | 3,669 |
| 1957 | 4,332 | 1985 | 3,761 |
| 1958 | 4,279 | 1986 | 3,757 |
| 1959 | 4,313 | 1987 | 3,809 |
| 1960 | 4,307 | 1988 | 3,910 |
| 1961 | 4,317 | 1989 | 4,041 |
| 1962 | 4,213 | 1990 | 4,158 |
| 1963 | 4,142 | 1991 | 4,111 |
| 1964 | 4,070 | 1992 | 4,065 |
| 1965 | 3,801 | 1993 | 4,000 |
| 1966 | 3,642 | 1994 | 3,953 |
| 1967 | 3,555 | 1995 | 3,900 |
| 1968 | 3,535 | 1996 | 3,891 |
| 1969 | 3,626 | 1997 | 3,881 |
| 1970 | 3,739 | 1998 | 3,942 |
| 1971 | 3,556 | 1999 | 3,959 |
| 1972 | 3,258 | 2000 | 4,063 |
| 1973 | 3,137 | 2001 | 4,028 |
| SOURCE: U.S. Department of Health and Human Services, National Center for Health Statistics (NCHS), Annual Summary of Births, Marriages, Divorces, and Deaths: United States, various years, National Vital Statistics Report (2003). | | | |
[Page 1350]
| Average Reading, Mathematics, And Science Literacy Scores1 Of 15-Year-Olds, By Sex, 2000 |
|---|
| | Reading literacy | | Mathematics literacy | | | Science literacy | | |
| Country | Total | Male | Female | Total | Male | Female | Total | Male | Female |
| Australia | 528 | 513 | 546 | 533 | 539 | 527 | 528 | 526 | 529 |
| Austria | 507 | 495 | 520 | 515 | 530 | 503 | 519 | 526 | 514 |
| Belgium | 507 | 492 | 525 | 520 | 524 | 518 | 496 | 496 | 498 |
| Canada | 534 | 519 | 551 | 533 | 539 | 529 | 529 | 529 | 531 |
| Czech Republic | 492 | 473 | 510 | 498 | 504 | 492 | 511 | 512 | 511 |
| Denmark | 497 | 485 | 510 | 514 | 522 | 507 | 481 | 488 | 476 |
| Finland | 546 | 520 | 571 | 536 | 537 | 536 | 538 | 534 | 541 |
| France | 505 | 490 | 519 | 517 | 525 | 511 | 500 | 504 | 498 |
| Germany | 484 | 468 | 502 | 490 | 498 | 483 | 487 | 489 | 487 |
| Greece | 474 | 456 | 493 | 447 | 451 | 444 | 461 | 457 | 464 |
| Hungary | 480 | 465 | 496 | 488 | 492 | 485 | 496 | 496 | 497 |
| Iceland | 507 | 488 | 528 | 514 | 513 | 518 | 496 | 495 | 499 |
| Ireland | 527 | 513 | 542 | 503 | 510 | 497 | 513 | 511 | 517 |
| Italy | 487 | 469 | 507 | 457 | 462 | 454 | 478 | 474 | 483 |
| Japan | 522 | 507 | 537 | 557 | 561 | 553 | 550 | 547 | 554 |
| Korea, Republic of | 525 | 519 | 533 | 547 | 559 | 532 | 552 | 561 | 541 |
| Luxembourg | 441 | 429 | 456 | 446 | 454 | 439 | 443 | 441 | 448 |
| Mexico | 422 | 411 | 432 | 387 | 393 | 382 | 422 | 423 | 419 |
| Netherlands | — | 517 | 547 | — | 569 | 558 | — | 529 | 529 |
| New Zealand | 529 | 507 | 553 | 537 | 536 | 539 | 528 | 523 | 535 |
| Norway | 505 | 486 | 529 | 499 | 506 | 495 | 500 | 499 | 505 |
| Poland | 479 | 461 | 498 | 470 | 472 | 468 | 483 | 486 | 480 |
| Portugal | 470 | 458 | 482 | 454 | 464 | 446 | 459 | 456 | 462 |
| Spain | 493 | 481 | 505 | 476 | 487 | 469 | 491 | 492 | 491 |
| Sweden | 516 | 499 | 536 | 510 | 514 | 507 | 512 | 512 | 513 |
| Switzerland | 494 | 480 | 510 | 529 | 537 | 523 | 496 | 500 | 493 |
| United Kingdom | 523 | 512 | 537 | 529 | 534 | 526 | 532 | 535 | 531 |
| United States | 504 | 490 | 518 | 493 | 497 | 490 | 499 | 497 | 502 |
| SOURCE: World Health Organization. | | | | | | | | | |
| 1. Average score equals 500. | | | | | | | | | |
| [Page 1351]Basic Indicators of World Health Organization Members, 2001 |
|---|
| Member State | Total population (in thousands) | Annual growth rate (%) | Percentage of population aged 60+years | | Total fertility rate | |
| 2001 | 1991–2001 | 1991 | 2001 | 1991 | 2001 |
| Afghanistan | 22,473 | 4.5 | 4.7 | 4.7 | 7.1 | 6.8 |
| Albania | 3,144 | − 0.5 | 7.9 | 9.2 | 2.9 | 2.4 |
| Algeria | 30,841 | 1.9 | 5.7 | 6.0 | 4.3 | 2.9 |
| Andorra | 90 | 5.0 | 19.4 | 21.1 | 1.5 | 1.3 |
| Angola | 13,527 | 3.2 | 4.7 | 4.5 | 7.2 | 7.2 |
| Antigua and Barbuda | 65 | 0.3 | 9.1 | 10.0 | 1.9 | 1.6 |
| Argentina | 37,487 | 1.3 | 13.0 | 13.4 | 2.9 | 2.5 |
| Armenia | 3,787 | 0.5 | 10.4 | 13.2 | 2.2 | 1.2 |
| Australia | 19,338 | 1.2 | 15.6 | 16.5 | 1.9 | 1.8 |
| Austria | 8,074 | 0.4 | 20.0 | 21.1 | 1.5 | 1.3 |
| Azerbaijan | 8,095 | 1.1 | 8.2 | 10.5 | 2.7 | 1.6 |
| Bahamas | 307 | 1.7 | 6.7 | 8.1 | 2.6 | 2.3 |
| Bahrain | 651 | 2.6 | 3.7 | 4.8 | 3.6 | 2.4 |
| Bangladesh | 140,368 | 2.2 | 4.7 | 5.0 | 4.5 | 3.6 |
| Barbados | 268 | 0.4 | 15.1 | 13.2 | 1.6 | 1.5 |
| Belarus | 10,146 | − 0.1 | 16.8 | 18.8 | 1.8 | 1.2 |
| Belgium | 10,263 | 0.3 | 20.7 | 22.2 | 1.6 | 1.5 |
| Belize | 230 | 2.0 | 6.0 | 5.9 | 4.3 | 3.0 |
| Benin | 6,445 | 3.0 | 4.7 | 4.2 | 6.6 | 5.8 |
| Bhutan | 2,141 | 2.2 | 6.0 | 6.5 | 5.8 | 5.2 |
| Bolivia | 8,516 | 2.4 | 5.9 | 6.2 | 4.9 | 4.1 |
| Bosnia and Herzegovina | 4,066 | − 0.2 | 10.7 | 15.1 | 1.6 | 1.3 |
| Botswana | 1,553 | 2.0 | 3.6 | 4.6 | 5.0 | 4.1 |
| Brazila | 172,558 | 1.4 | 6.8 | 8.0 | 2.6 | 2.2 |
| Brunei Darussalam | 334 | 2.4 | 4.0 | 5.2 | 3.2 | 2.6 |
| Bulgaria | 7,866 | − 1.0 | 19.5 | 21.7 | 1.6 | 1.1 |
| Burkina Faso | 11,855 | 2.5 | 5.2 | 4.8 | 7.2 | 6.8 |
| Burundi | 6,501 | 1.2 | 4.7 | 4.3 | 6.8 | 6.8 |
| Cambodia | 13,440 | 3.0 | 4.4 | 4.4 | 5.5 | 4.9 |
| Cameroon | 15,202 | 2.4 | 5.6 | 5.6 | 5.8 | 4.8 |
| Canada | 31,014 | 1.0 | 15.7 | 16.9 | 1.7 | 1.6 |
| Cape Verde | 436 | 2.3 | 6.8 | 6.3 | 4.1 | 3.3 |
| Central African Republic | 3,781 | 2.3 | 6.2 | 6.1 | 5.6 | 5.0 |
| Chad | 8,134 | 3.1 | 5.2 | 4.9 | 6.7 | 6.7 |
| Chile | 15,401 | 1.5 | 9.1 | 10.4 | 2.6 | 2.4 |
| China | 1,292,378 | 0.9 | 8.6 | 10.0 | 2.1 | 1.8 |
| Colombia | 42,802 | 1.8 | 6.3 | 7.0 | 3.1 | 2.7 |
| Comoros | 726 | 3.0 | 4.0 | 4.2 | 6.0 | 5.1 |
| Congo | 3,109 | 3.1 | 5.3 | 5.0 | 6.3 | 6.3 |
| Cook Islands | 20 | 0.7 | 5.8 | 6.9 | 4.1 | 3.3 |
| Costa Rica | 4,112 | 2.7 | 6.4 | 7.6 | 3.1 | 2.7 |
| Côte d'Ivoire | 16,348 | 2.3 | 4.3 | 5.0 | 6.1 | 4.8 |
| Croatia | 4,654 | 0.3 | 17.3 | 20.5 | 1.6 | 1.7 |
| Cubaa | 11,236 | 0.5 | 11.8 | 14.0 | 1.7 | 1.6 |
| Cyprus | 790 | 1.3 | 14.8 | 15.9 | 2.4 | 1.9 |
| Czech Republic | 10,260 | 0.0 | 17.8 | 18.6 | 1.7 | 1.2 |
[Page 1352]| Democratic People's Republic of Korea | 22,427 | 1.0 | 7.8 | 10.4 | 2.4 | 2.1 |
| Democratic Republic of the Congo | 52,521 | 3.2 | 4.6 | 4.5 | 6.7 | 6.7 |
| Denmark | 5,332 | 0.3 | 20.3 | 20.2 | 1.7 | 1.7 |
| Djibouti | 643 | 2.2 | 4.1 | 5.7 | 6.3 | 5.9 |
| Dominica | 71 | − 0.1 | 9.1 | 10.0 | 2.1 | 1.8 |
| Dominican Republic | 8,506 | 1.7 | 5.5 | 6.7 | 3.3 | 2.8 |
| Ecuador | 12,879 | 2.1 | 6.2 | 7.0 | 3.7 | 2.9 |
| Egypt | 69,079 | 1.9 | 6.1 | 6.3 | 4.0 | 3.0 |
| El Salvador | 6,399 | 2.1 | 6.6 | 7.2 | 3.6 | 3.0 |
| Equatorial Guinea | 469 | 2.7 | 6.3 | 5.9 | 5.9 | 5.9 |
| Eritrea | 3,815 | 2.0 | 4.4 | 4.7 | 6.2 | 5.4 |
| Estonia | 1,376 | − 1.3 | 17.5 | 20.3 | 1.8 | 1.2 |
| Ethiopia | 64,458 | 2.8 | 4.5 | 4.7 | 6.9 | 6.8 |
| Fiji | 822 | 1.2 | 4.9 | 5.8 | 3.4 | 3.0 |
| Finland | 5,177 | 0.3 | 18.6 | 20.2 | 1.8 | 1.6 |
| France | 59,452 | 0.4 | 19.3 | 20.5 | 1.7 | 1.8 |
| Gabon | 1,261 | 2.7 | 9.1 | 8.6 | 5.1 | 5.4 |
| Gambia | 1,337 | 3.3 | 4.8 | 5.2 | 5.8 | 4.9 |
| Georgia | 5,238 | − 0.4 | 15.3 | 18.9 | 2.0 | 1.4 |
| Germany | 82,006 | 0.3 | 20.5 | 23.7 | 1.4 | 1.3 |
| Ghana | 19,733 | 2.4 | 4.6 | 5.1 | 5.5 | 4.3 |
| Greece | 10,623 | 0.4 | 20.4 | 23.7 | 1.4 | 1.3 |
| Grenada | 94 | 0.3 | 9.1 | 10.0 | 4.1 | 3.5 |
| Guatemala | 11,686 | 2.7 | 5.1 | 5.3 | 5.5 | 4.6 |
| Guinea | 8,273 | 2.7 | 4.4 | 4.5 | 6.5 | 6.0 |
| Guinea-Bissau | 1,226 | 2.4 | 5.9 | 5.6 | 6.0 | 6.0 |
| Guyana | 762 | 0.4 | 6.7 | 6.9 | 2.6 | 2.4 |
| Haiti | 8,269 | 1.6 | 5.7 | 5.6 | 5.1 | 4.1 |
| Honduras | 6,574 | 2.7 | 4.5 | 5.1 | 5.1 | 3.9 |
| Hungary | 9,916 | − 0.4 | 19.1 | 19.9 | 1.8 | 1.3 |
| Iceland | 281 | 0.9 | 14.6 | 15.1 | 2.2 | 1.9 |
| India | 1,025,095 | 1.8 | 6.9 | 7.7 | 3.8 | 3.1 |
| Indonesia | 214,839 | 1.5 | 6.3 | 7.8 | 3.2 | 2.4 |
| Iran, Islamic Republic of | 71,368 | 1.8 | 4.7 | 5.3 | 4.8 | 2.9 |
| Iraq | 23,583 | 2.9 | 4.5 | 4.6 | 5.8 | 4.9 |
| Ireland | 3,840 | 0.9 | 15.2 | 15.3 | 2.1 | 2.0 |
| Israel | 6,171 | 2.9 | 12.5 | 13.1 | 3.0 | 2.8 |
| Italy | 57,502 | 0.1 | 21.5 | 24.3 | 1.3 | 1.2 |
| Jamaica | 2,598 | 0.9 | 10.0 | 9.6 | 2.8 | 2.4 |
| Japana | 127,334 | 0.3 | 18.0 | 23.8 | 1.5 | 1.4 |
| Jordan | 5,050 | 3.9 | 4.6 | 4.6 | 5.7 | 4.4 |
| Kazakhstan | 16,094 | − 0.4 | 9.7 | 11.2 | 2.6 | 2.0 |
| Kenya | 31,292 | 2.5 | 4.1 | 4.2 | 5.8 | 4.3 |
| Kiribati | 84 | 1.4 | 6.0 | 6.9 | 4.4 | 4.6 |
| Kuwait | 1,970 | − 0.6 | 2.1 | 4.8 | 3.4 | 2.7 |
| Kyrgyzstan | 4,986 | 1.2 | 8.3 | 8.9 | 3.6 | 2.5 |
[Page 1353]| Lao People's Democratic Republic | 5,402 | 2.5 | 6.0 | 5.6 | 6.0 | 5.0 |
| Latvia | 2,405 | − 1.0 | 17.9 | 21.1 | 1.8 | 1.1 |
| Lebanon | 3,555 | 2.5 | 8.2 | 8.5 | 3.1 | 2.2 |
| Lesotho | 2,057 | 1.8 | 6.0 | 6.6 | 5.1 | 4.5 |
| Liberia | 3,107 | 4.0 | 5.2 | 4.4 | 6.8 | 6.8 |
| Libyan Arab Jamahiriya | 5,407 | 2.1 | 4.3 | 5.6 | 4.6 | 3.5 |
| Lithuania | 3,688 | − 0.1 | 16.4 | 18.8 | 1.9 | 1.3 |
| Luxembourg | 441 | 1.4 | 19.0 | 19.4 | 1.6 | 1.7 |
| Madagascar | 16,436 | 2.9 | 4.8 | 4.7 | 6.2 | 5.8 |
| Malawi | 11,571 | 1.8 | 4.3 | 4.7 | 7.3 | 6.5 |
| Malaysia | 22,632 | 2.2 | 5.8 | 6.7 | 3.7 | 3.0 |
| Maldives | 299 | 3.0 | 5.3 | 5.2 | 6.3 | 5.5 |
| Mali | 11,676 | 2.6 | 5.3 | 5.8 | 7.0 | 7.0 |
| Malta | 391 | 0.8 | 14.8 | 17.2 | 2.0 | 1.8 |
| Marshall Islands | 52 | 1.4 | 6.0 | 6.9 | 5.5 | 5.7 |
| Mauritania | 2,746 | 3.0 | 4.9 | 4.7 | 6.1 | 6.0 |
| Mauritius | 1,170 | 0.9 | 8.3 | 9.1 | 2.3 | 1.9 |
| Mexico | 100,367 | 1.7 | 5.9 | 7.1 | 3.3 | 2.6 |
| Micronesia, Federated States of | 126 | 2.6 | 6.0 | 6.9 | 4.8 | 5.1 |
| Monaco | 34 | − 2.9 | 18.4 | 20.5 | 1.8 | 1.8 |
| Mongolia | 2,558 | 1.2 | 5.9 | 5.6 | 3.8 | 2.4 |
| Morocco | 30,430 | 1.9 | 6.0 | 6.4 | 4.1 | 3.1 |
| Mozambique | 18,644 | 2.9 | 5.1 | 5.1 | 6.4 | 6.0 |
| Myanmara | 48,363 | 1.6 | 6.7 | 6.8 | 3.9 | 3.0 |
| Namibia | 1,787 | 2.3 | 5.5 | 5.6 | 5.9 | 5.0 |
| Nauru | 13 | 2.6 | 6.0 | 6.9 | 4.4 | 4.5 |
| Nepal | 23,592 | 2.4 | 5.8 | 5.9 | 5.1 | 4.6 |
| Netherlandsa | 15,929 | 0.6 | 17.4 | 18.4 | 1.6 | 1.5 |
| New Zealand | 3,807 | 1.1 | 15.3 | 15.7 | 2.1 | 2.0 |
| Nicaragua | 5,207 | 2.9 | 4.4 | 4.6 | 4.9 | 4.0 |
| Niger | 11,226 | 3.5 | 3.5 | 3.3 | 8.0 | 8.0 |
| Nigeria | 116,928 | 2.8 | 4.7 | 4.8 | 6.5 | 5.6 |
| Niue | 2 | − 1.4 | 5.8 | 6.9 | 3.2 | 2.6 |
| Norway | 4,487 | 0.5 | 20.8 | 19.6 | 1.9 | 1.7 |
| Oman | 2,621 | 3.5 | 3.8 | 4.3 | 6.9 | 5.6 |
| Pakistan | 144,971 | 2.6 | 5.6 | 5.8 | 5.9 | 5.2 |
| Palau | 20 | 2.3 | 6.0 | 6.9 | 2.6 | 2.8 |
| Panama | 2,898 | 1.7 | 7.3 | 8.2 | 3.0 | 2.5 |
| Papua New Guinea | 4,919 | 2.5 | 4.2 | 4.2 | 5.1 | 4.4 |
| Paraguay | 5,635 | 2.6 | 5.3 | 5.4 | 4.7 | 3.9 |
| Peru | 26,092 | 1.7 | 6.2 | 7.3 | 3.6 | 2.7 |
| Philippines | 77,130 | 2.1 | 4.9 | 5.6 | 4.3 | 3.4 |
| Poland | 38,576 | 0.1 | 15.1 | 16.6 | 2.0 | 1.3 |
| Portugal | 10,032 | 0.1 | 19.3 | 21.0 | 1.5 | 1.5 |
[Page 1354]| Qatar | 574 | 2.1 | 2.1 | 3.3 | 4.3 | 3.4 |
| Republic of Korea | 47,068 | 0.8 | 7.9 | 11.3 | 1.7 | 1.5 |
| Republic of Moldova | 4,284 | − 0.2 | 12.9 | 13.6 | 2.3 | 1.5 |
| Romania | 22,387 | − 0.3 | 16.0 | 18.9 | 1.7 | 1.3 |
| Russian Federation | 144,663 | − 0.3 | 16.2 | 18.5 | 1.7 | 1.2 |
| Rwanda | 7,948 | 2.1 | 4.1 | 4.2 | 6.8 | 5.9 |
| Saint Kitts and Nevis | 38 | − 0.8 | 9.1 | 10.0 | 2.8 | 2.4 |
| Saint Lucia | 149 | 1.2 | 8.6 | 7.6 | 3.2 | 2.6 |
| Saint Vincent and the Grenadines | 114 | 0.7 | 9.1 | 10.0 | 2.2 | 1.9 |
| Samoa | 158 | − 0.1 | 6.1 | 6.7 | 4.7 | 4.3 |
| San Marino | 27 | 1.4 | 21.5 | 24.3 | 1.5 | 1.3 |
| Sao Tome and Principe | 140 | 1.8 | 6.8 | 6.3 | 6.2 | 6.0 |
| Saudi Arabia | 21,027 | 2.9 | 4.1 | 4.9 | 6.8 | 5.7 |
| Senegal | 9,661 | 2.5 | 4.6 | 4.2 | 6.2 | 5.2 |
| Seychelles | 81 | 1.4 | 8.3 | 9.1 | 2.1 | 1.8 |
| Sierra Leone | 4,587 | 1.1 | 5.0 | 4.7 | 6.5 | 6.5 |
| Singapore | 4,107 | 2.9 | 8.6 | 10.8 | 1.7 | 1.5 |
| Slovakia | 5,402 | 0.2 | 14.9 | 15.5 | 2.0 | 1.3 |
| Slovenia | 1,984 | 0.3 | 17.3 | 19.5 | 1.5 | 1.2 |
| Solomon Islands | 462 | 3.5 | 4.4 | 4.1 | 5.9 | 5.4 |
| Somalia | 9,156 | 2.4 | 4.2 | 3.9 | 7.3 | 7.3 |
| South Africa | 43,791 | 1.7 | 5.1 | 5.8 | 3.4 | 2.9 |
| Spain | 39,920 | 0.1 | 19.6 | 22.0 | 1.3 | 1.1 |
| Sri Lanka | 19,103 | 1.0 | 8.1 | 9.5 | 2.5 | 2.1 |
| Sudan | 31,809 | 2.3 | 5.0 | 5.5 | 5.4 | 4.6 |
| Suriname | 418 | 0.4 | 6.8 | 8.1 | 2.6 | 2.1 |
| Swaziland | 937 | 1.8 | 4.9 | 5.4 | 5.5 | 4.5 |
| Sweden | 8,832 | 0.2 | 22.6 | 22.7 | 2.0 | 1.4 |
| Switzerland | 7,169 | 0.4 | 19.2 | 21.7 | 1.5 | 1.4 |
| Syrian Arab Republica | 16,609 | 2.7 | 4.5 | 4.7 | 5.3 | 3.8 |
| Tajikistan | 6,135 | 1.3 | 6.3 | 6.8 | 4.7 | 3.1 |
| Thailand | 63,583 | 1.4 | 6.4 | 8.3 | 2.2 | 2.0 |
| The former Yugoslav Republic of Macedonia | 2,043 | 0.6 | 11.8 | 14.6 | 1.9 | 1.6 |
| Togo | 4,656 | 2.8 | 4.8 | 4.9 | 6.3 | 5.5 |
| Tonga | 99 | 0.3 | 5.8 | 6.9 | 4.7 | 3.8 |
| Trinidad and Tobago | 1,299 | 0.6 | 8.8 | 9.7 | 2.3 | 1.6 |
| Tunisia | 9,561 | 1.4 | 7.0 | 8.4 | 3.4 | 2.2 |
| Turkey | 67,632 | 1.7 | 7.3 | 8.5 | 3.3 | 2.4 |
| Turkmenistan | 4,834 | 2.5 | 6.2 | 6.4 | 4.2 | 3.3 |
| Tuvalu | 10 | 1.4 | 5.8 | 6.9 | 3.6 | 2.9 |
| Uganda | 24,022 | 3.0 | 4.1 | 3.8 | 7.1 | 7.1 |
| Ukraine | 49,111 | − 0.6 | 18.6 | 20.7 | 1.7 | 1.1 |
| United Arab Emirates | 2,653 | 2.4 | 2.7 | 5.5 | 4.0 | 3.0 |
| United Kingdoma | 59,541 | 0.3 | 20.8 | 20.7 | 1.8 | 1.6 |
| United Republic of Tanzania | 35,964 | 2.9 | 3.8 | 4.0 | 6.0 | 5.2 |
[Page 1355]| United States of Americaa | 285,925 | 1.1 | 16.6 | 16.2 | 2.0 | 2.0 |
| Uruguay | 3,360 | 0.7 | 16.5 | 17.2 | 2.5 | 2.3 |
| Uzbekistan | 25,256 | 1.9 | 6.5 | 7.1 | 3.8 | 2.5 |
| Vanuatu | 201 | 2.8 | 5.2 | 4.8 | 4.9 | 4.4 |
| Venezuela, Bolivarian Republic of | 24,631 | 2.1 | 5.8 | 6.7 | 3.4 | 2.8 |
| Viet Nam | 79,174 | 1.6 | 7.3 | 7.5 | 3.5 | 2.3 |
| Yemen | 19,113 | 4.6 | 4.1 | 3.6 | 7.6 | 7.6 |
| Yugoslavia | 10,537 | 0.3 | 15.6 | 18.4 | 2.0 | 1.6 |
| Zambia | 10,648 | 2.5 | 4.4 | 4.5 | 6.3 | 5.8 |
| Zimbabwe | 12,851 | 2.0 | 4.6 | 4.7 | 5.7 | 4.7 |
| a. Figures not endorsed by member state as official statistics. | | | | | | |
| SOURCE: World Health Organization, The World Health Report 2002. | | | | | | |
| Child Care Arrangements of Preschool Children, By Age, Race/Ethnicity, And Type of Child Care Arrangement, 1999 |
|---|
| | | Percent in nonparental arrangements | |
| Characteristics | Relative care | Nonrelative care | Center-based program | Percent with parental care only |
| Total | 22.8 | 16.1 | 59.7 | 23.1 |
| | | Age | |
| 3 years old | 24.4 | 16.2 | 45.7 | 30.8 |
| 4 years old | 22 | 15.9 | 69.6 | 17.7 |
| 5 years old | 20.2 | 16.1 | 76.5 | 13.5 |
| | Race/ethnicity | | |
| White, non-Hispanic | 18.8 | 19.4 | 60 | 23.2 |
| Black, non-Hispanic | 33.4 | 7.4 | 73.2 | 13.7 |
| Hispanic | 26.5 | 12.7 | 44.2 | 33.4 |
| Other | 30.2 | 10.4 | 66.1 | 16.6 |
| SOURCE: Department of Education. | | | | |
| [Page 1357]Enrollment in Grades K8 And 9–12 Of Elementary and Secondary Schools (In Thousands) |
|---|
| Year | | Total | | | Public | | | Private | |
| K121 | K81 | 9–12 | K121 | K81 | 9–12 | K121 | K81 | 9–12 |
| 1988 | 45,430 | 32,537 | 12,893 | 40,188 | 28,501 | 11,687 | 5,242 | 4,036 | 1,206 |
| 1989 | 45,741 | 33,187 | 12,554 | 40,543 | 29,152 | 11,390 | 5,198 | 4,035 | 1,163 |
| 1990 | 46,451 | 33,962 | 12,488 | 41,217 | 29,878 | 11,338 | 5,234 | 4,084 | 1,150 |
| 1991 | 47,322 | 34,619 | 12,703 | 42,047 | 30,506 | 11,541 | 5,275 | 4,113 | 1,162 |
| 1992 | 48,145 | 35,264 | 12,882 | 42,823 | 31,088 | 11,735 | 5,322 | 4,175 | 1,147 |
| 1993 | 48,812 | 35,719 | 13,093 | 43,465 | 31,504 | 11,961 | 5,348 | 4,215 | 1,132 |
| 1994 | 49,610 | 36,233 | 13,376 | 44,111 | 31,898 | 12,213 | 5,498 | 4,335 | 1,163 |
| 1995 | 50,503 | 36,806 | 13,697 | 44,840 | 32,341 | 12,500 | 5,662 | 4,465 | 1,197 |
| 1996 | 51,375 | 37,316 | 14,060 | 45,611 | 32,764 | 12,847 | 5,764 | 4,551 | 1,213 |
| 1997 | 51,968 | 37,696 | 14,272 | 46,127 | 33,073 | 13,054 | 5,841 | 4,623 | 1,218 |
| 1998 | 52,475 | 38,048 | 14,427 | 46,539 | 33,346 | 13,193 | 5,937 | 4,702 | 1,235 |
| 1999 | 52,876 | 38,253 | 14,623 | 46,857 | 33,488 | 13,369 | 6,018 | 4,765 | 1,254 |
| 2000 | 53,385 | 38,584 | 14,801 | 47,223 | 33,709 | 13,514 | 6,162 | 4,875 | 1,287 |
| 2001 | 53,890 | 38,832 | 15,058 | 47,688 | 33,952 | 13,736 | 6,202 | 4,880 | 1,322 |
| | | | Projected | | | | | |
| 2002 | 54,158 | 38,827 | 15,331 | 47,918 | 33,942 | 13,976 | 6,241 | 4,885 | 1,356 |
| 2003 | 54,296 | 38,719 | 15,577 | 48,040 | 33,843 | 14,198 | 6,256 | 4,876 | 1,379 |
| 2004 | 54,455 | 38,541 | 15,914 | 48,175 | 33,669 | 14,506 | 6,279 | 4,871 | 1,408 |
| 2005 | 54,615 | 38,412 | 16,203 | 48,304 | 33,534 | 14,770 | 6,311 | 4,878 | 1,433 |
| 2006 | 54,907 | 38,522 | 16,385 | 48,524 | 33,589 | 14,936 | 6,383 | 4,933 | 1,449 |
| 2007 | 55,049 | 38,605 | 16,445 | 48,640 | 33,654 | 14,986 | 6,409 | 4,950 | 1,458 |
| 2008 | 55,124 | 38,766 | 16,358 | 48,690 | 33,791 | 14,899 | 6,434 | 4,975 | 1,459 |
| 2009 | 55,223 | 38,995 | 16,228 | 48,761 | 33,994 | 14,767 | 6,461 | 5,001 | 1,461 |
| 2010 | 55,386 | 39,283 | 16,103 | 48,890 | 34,243 | 14,648 | 6,495 | 5,040 | 1,455 |
| 2011 | 55,618 | 39,688 | 15,930 | 49,084 | 34,597 | 14,487 | 6,534 | 5,091 | 1,443 |
| 2012 | 55,946 | 40,154 | 15,792 | 49,367 | 35,006 | 14,361 | 6,579 | 5,148 | 1,430 |
| 2013 | 56,364 | 40,638 | 15,726 | 49,737 | 35,430 | 14,307 | 6,627 | 5,208 | 1,419 |
| SOURCE: U.S. Department of Education. | | | | | | | | | |
| 1. Includes most nursery school enrollment. | | | | | | | | | |
| [Page 1358]General Statistics of Public Libraries, By Population, 2000 |
|---|
| Number of public library service outlets | 17,182 | 5,749 | 4,205 | 1,790 | 2,140 | 1,108 | 2,190 |
| Central libraries | 8,915 | 5,423 | 2,582 | 499 | 281 | 73 | 57 |
| Branch libraries | 7,383 | 255 | 1,326 | 1,113 | 1,693 | 964 | 2,032 |
| Bookmobiles | 884 | 71 | 297 | 178 | 166 | 71 | 101 |
| Collections, in thousands | | | | | | | |
| Books and serial volumes | 760,513 | 99,639 | 185,480 | 91,633 | 112,461 | 75,126 | 196,173 |
| Audio and video materials and films | 54,021 | 5,456 | 13,020 | 6,662 | 8,241 | 5,184 | 15,458 |
| Serial subscriptions | 1,944 | 276 | 487 | 209 | 254 | 193 | 523 |
| Paid staff, in full-time equivalents | | | | | | | |
| Librarians | 43,118 | 6,016 | 11,317 | 5,156 | 6,018 | 4,195 | 10,416 |
| Librarians with ALA-MLS | 29,519 | 1,221 | 6,904 | 3,761 | 4,858 | 3,441 | 9,334 |
| Other staff | 86,984 | 5,479 | 20,404 | 11,770 | 15,787 | 9,492 | 24,053 |
| Income, in thousands | | | | | | | |
| Total operating income | $7,702,768 | $499,840 | $1,744,932 | $967,817 | $1,246,162 | $858,994 | $2,385,022 |
| Source of operating income (percent) | | | | | | | |
| Federal | 0.7 | 1.5 | 0.6 | 0.6 | 0.7 | 0.6 | 0.9 |
| State | 12.8 | 7.8 | 12.3 | 15.2 | 11.6 | 13.0 | 13.3 |
| Local | 77.1 | 69.3 | 77.4 | 76.0 | 80.2 | 79.0 | 75.9 |
| Other and private | 9.4 | 21.4 | 9.8 | 8.2 | 7.5 | 7.4 | 10.0 |
| SOURCE: U.S. Department of Education. | | | | | | | |
| [Page 1359]High School Graduates 1987–1988 To 2012–2013 (In Thousands) |
|---|
| Year ending | Total | | Public | Private |
| 1988 | 2,773 | | 2,500 | 273 |
| 1989 | 2,744 | | 2,459 | 285 |
| 1990 | 2,589 | | 2,320 | 269 |
| 1991 | 2,493 | | 2,235 | 258 |
| 1992 | 2,478 | | 2,226 | 252 |
| 1993 | 2,481 | | 2,233 | 247 |
| 1994 | 2,464 | | 2,221 | 243 |
| 1995 | 2,519 | | 2,274 | 246 |
| 1996 | 2,518 | | 2,273 | 245 |
| 1997 | 2,612 | | 2,358 | 254 |
| 1998 | 2,704 | | 2,439 | 265 |
| 1999 | 2,759 | | 2,486 | 273 |
| 2000 | 2,833 | | 2,554 | 279 |
| 2001 | 2,852 | | 2,569 | 283 |
| | Projected | | |
| 2002 | 2,917 | | 2,630 | 287 |
| 2003 | 2,986 | | 2,685 | 301 |
| 2004 | 3,002 | | 2,698 | 305 |
| 2005 | 3,037 | | 2,728 | 308 |
| 2006 | 3,101 | | 2,785 | 316 |
| 2007 | 3,172 | | 2,850 | 322 |
| 2008 | 3,262 | | 2,931 | 331 |
| 2009 | 3,274 | | 2,942 | 332 |
| 2010 | 3,262 | | 2,930 | 331 |
| 2011 | 3,237 | | 2,906 | 331 |
| 2012 | 3,202 | | 2,870 | 331 |
| 2013 | 3,176 | | 2,843 | 333 |
| SOURCE: National Center for Educational Statistics. | | | | |
| [Page 1360]Life Expectancy in All Member States of World Health Organization In 2001 |
|---|
| Country | Total | Males at birth | Males at age 60 | Females at birth | Females at age 60 |
| Japan | 73.6 | 71.4 | 17.1 | 75.8 | 20.7 |
| Switzerland | 72.8 | 71.1 | 16.9 | 74.4 | 19.4 |
| San Marino | 72.2 | 70.4 | 16.3 | 74.0 | 19.1 |
| Sweden | 71.8 | 70.5 | 16.5 | 73.2 | 18.5 |
| Australia | 71.6 | 70.1 | 16.4 | 73.2 | 18.8 |
| Monaco | 71.3 | 69.0 | 16.3 | 73.5 | 19.4 |
| France | 71.3 | 69.0 | 16.1 | 73.5 | 19.1 |
| Iceland | 71.2 | 70.5 | 16.8 | 71.9 | 17.6 |
| Italy | 71.0 | 69.2 | 15.5 | 72.9 | 18.2 |
| Austria | 71.0 | 68.9 | 15.7 | 73.0 | 18.5 |
| Andorra | 70.9 | 68.8 | 15.8 | 73.0 | 18.5 |
| Spain | 70.9 | 68.7 | 15.2 | 73.0 | 18.2 |
| Norway | 70.8 | 69.3 | 15.6 | 72.2 | 17.9 |
| Luxembourg | 70.6 | 68.6 | 15.1 | 72.7 | 18.3 |
| Greece | 70.4 | 69.0 | 15.7 | 71.9 | 17.1 |
| New Zealand | 70.3 | 69.1 | 15.9 | 71.5 | 17.7 |
| Germany | 70.2 | 68.3 | 15.0 | 72.2 | 17.7 |
| Finland | 70.1 | 67.7 | 15.2 | 72.5 | 18.1 |
| Denmark | 70.1 | 69.3 | 15.5 | 70.8 | 16.7 |
| Netherlands | 69.9 | 68.7 | 15.0 | 71.1 | 17.3 |
| Canada | 69.9 | 68.2 | 15.3 | 71.6 | 17.9 |
| Belgium | 69.7 | 67.7 | 14.8 | 71.8 | 17.8 |
| United Kingdom | 69.6 | 68.4 | 15.0 | 70.9 | 16.9 |
| Israel | 69.4 | 68.0 | 15.8 | 70.8 | 16.9 |
| Malta | 69.2 | 67.6 | 14.3 | 70.9 | 16.5 |
| Ireland | 69.0 | 67.6 | 13.9 | 70.4 | 16.1 |
| Singapore | 68.7 | 67.9 | 14.5 | 69.5 | 15.8 |
| Slovenia | 67.7 | 65.1 | 13.3 | 70.3 | 16.6 |
| United States of America | 67.6 | 66.4 | 14.9 | 68.8 | 16.6 |
| Republic of Korea | 67.4 | 64.5 | 12.9 | 70.3 | 16.6 |
| Portugal | 66.8 | 64.3 | 13.4 | 69.4 | 16.2 |
| Czech Republic | 66.6 | 63.8 | 12.8 | 69.5 | 16.0 |
| Cuba | 66.6 | 64.7 | 14.4 | 68.5 | 16.6 |
| Cyprus | 66.2 | 65.3 | 13.2 | 67.2 | 14.5 |
| Chile | 66.1 | 64.4 | 13.3 | 67.8 | 15.5 |
| Kuwait | 64.9 | 64.1 | 12.2 | 65.8 | 13.0 |
| Costa Rica | 64.8 | 62.6 | 12.9 | 67.0 | 15.3 |
| Uruguay | 64.7 | 61.2 | 12.3 | 68.3 | 16.8 |
| Poland | 64.3 | 62.1 | 11.9 | 66.6 | 14.6 |
| Barbados | 64.3 | 61.0 | 12.3 | 67.6 | 16.4 |
| Slovakia | 64.1 | 61.6 | 11.5 | 66.6 | 14.6 |
| Panama | 64.1 | 61.2 | 13.6 | 66.9 | 16.4 |
| Mexico | 63.8 | 62.6 | 14.5 | 65.0 | 14.9 |
| Croatia | 63.3 | 59.7 | 10.1 | 66.9 | 14.4 |
| China | 63.2 | 62.0 | 12.7 | 64.3 | 14.2 |
| Argentina | 63.1 | 60.6 | 11.9 | 65.7 | 15.1 |
| Bulgaria | 63.0 | 60.8 | 11.5 | 65.2 | 13.9 |
| Jamaica | 62.8 | 61.1 | 11.8 | 64.5 | 13.9 |
[Page 1361]| United Arab Emirates | 62.5 | 61.7 | 10.6 | 63.3 | 12.3 |
| Bosnia and Herzegovina | 62.5 | 60.0 | 11.3 | 64.9 | 14.3 |
| The former Yugoslav Republic of Macedonia | 62.2 | 60.4 | 11.4 | 63.9 | 13.0 |
| Yugoslavia | 62.1 | 60.7 | 11.0 | 63.6 | 12.8 |
| Dominica | 62.1 | 59.4 | 13.0 | 64.8 | 15.0 |
| Brunei Darussalam | 62.0 | 60.4 | 10.5 | 63.7 | 12.8 |
| Estonia | 62.0 | 58.0 | 11.1 | 66.1 | 15.0 |
| Bahrain | 61.8 | 62.3 | 10.5 | 61.3 | 9.4 |
| Hungary | 61.8 | 58.0 | 10.4 | 65.5 | 14.4 |
| Tunisia | 61.3 | 58.9 | 10.8 | 63.7 | 13.4 |
| Qatar | 61.2 | 59.2 | 9.4 | 63.1 | 12.7 |
| Lithuania | 61.1 | 56.9 | 11.0 | 65.4 | 14.8 |
| Venezuela, Bolivarian Republic of | 61.1 | 57.1 | 11.6 | 65.0 | 15.0 |
| Romania | 60.9 | 58.6 | 11.1 | 63.3 | 13.5 |
| Saint Kitts and Nevis | 60.8 | 58.8 | 11.1 | 62.8 | 13.5 |
| Saint Lucia | 60.6 | 58.9 | 11.0 | 62.4 | 13.5 |
| Cook Islands | 60.5 | 58.3 | 10.2 | 62.6 | 12.7 |
| Trinidad and Tobago | 60.4 | 58.9 | 11.5 | 62.0 | 12.8 |
| Oman | 60.4 | 59.0 | 10.4 | 61.7 | 12.3 |
| Malaysia | 60.4 | 57.6 | 9.2 | 63.2 | 12.0 |
| Latvia | 60.0 | 55.2 | 10.0 | 64.9 | 14.4 |
| Saudi Arabia | 60.0 | 57.4 | 10.0 | 62.5 | 13.0 |
| Saint Vincent and the Grenadines | 59.8 | 57.5 | 11.3 | 62.2 | 14.0 |
| Georgia | 59.8 | 57.5 | 10.3 | 62.2 | 12.1 |
| Turkey | 59.8 | 58.5 | 11.2 | 61.1 | 12.4 |
| Antigua and Barbuda | 59.7 | 56.9 | 10.3 | 62.6 | 13.4 |
| Libyan Arab Jamahiriya | 59.6 | 56.8 | 9.8 | 62.4 | 12.9 |
| Ecuador | 59.5 | 56.6 | 11.6 | 62.4 | 14.2 |
| Lebanon | 59.4 | 56.5 | 10.0 | 62.2 | 12.9 |
| Syrian Arab Republic | 59.2 | 58.0 | 10.0 | 60.5 | 11.5 |
| Seychelles | 59.1 | 55.4 | 8.6 | 62.9 | 13.1 |
| Niue | 59.1 | 56.4 | 10.0 | 61.9 | 13.0 |
| Belize | 58.9 | 56.3 | 10.4 | 61.5 | 12.9 |
| Sri Lanka | 58.9 | 55.2 | 8.8 | 62.6 | 12.7 |
| Fiji | 58.8 | 56.8 | 10.0 | 60.8 | 12.3 |
| Tonga | 58.8 | 57.1 | 10.0 | 60.4 | 11.9 |
| Colombia | 58.7 | 55.3 | 10.7 | 62.1 | 12.9 |
| Albania | 58.7 | 55.9 | 8.8 | 61.5 | 12.7 |
| Paraguay | 58.7 | 55.4 | 9.6 | 61.9 | 12.9 |
| Viet Nam | 58.6 | 55.9 | 9.9 | 61.4 | 12.5 |
| Bahamas | 58.6 | 54.7 | 11.1 | 62.5 | 14.7 |
| Thailand | 58.6 | 56.4 | 12.0 | 60.8 | 12.6 |
| Jordan | 58.5 | 57.2 | 9.9 | 59.9 | 11.5 |
| Belarus | 58.4 | 53.9 | 9.5 | 62.8 | 13.0 |
| Armenia | 58.3 | 55.4 | 9.2 | 61.1 | 12.2 |
| Algeria | 57.8 | 55.8 | 10.3 | 59.9 | 12.2 |
| Nicaragua | 57.8 | 54.4 | 10.7 | 61.3 | 13.7 |
[Page 1362]| Samoa | 57.7 | 56.0 | 9.3 | 59.5 | 11.6 |
| Palau | 57.7 | 55.5 | 9.2 | 59.9 | 11.7 |
| Grenada | 57.5 | 56.0 | 10.1 | 59.0 | 12.1 |
| Republic of Moldova | 57.5 | 54.2 | 9.3 | 60.8 | 11.7 |
| Suriname | 57.5 | 54.2 | 9.4 | 60.7 | 12.6 |
| El Salvador | 57.4 | 53.7 | 11.2 | 61.2 | 13.5 |
| Peru | 57.4 | 54.7 | 10.7 | 60.1 | 13.2 |
| Ukraine | 57.4 | 52.9 | 8.8 | 61.8 | 12.2 |
| Mauritius | 57.1 | 56.4 | 9.4 | 57.7 | 11.2 |
| Iran, Islamic Republic of | 56.7 | 55.5 | 9.8 | 57.9 | 11.4 |
| Indonesia | 56.7 | 56.1 | 10.6 | 57.2 | 11.1 |
| Russian Federation | 56.7 | 51.5 | 8.5 | 61.9 | 12.7 |
| Egypt | 56.7 | 56.4 | 9.4 | 57.0 | 9.2 |
| Brazil | 56.7 | 52.2 | 9.4 | 61.1 | 13.0 |
| Cape Verde | 56.5 | 52.2 | 9.2 | 60.8 | 12.3 |
| Dominican Republic | 56.4 | 53.0 | 9.7 | 59.8 | 13.1 |
| Honduras | 55.9 | 52.1 | 9.3 | 59.6 | 12.6 |
| Micronesia, Federated States of | 55.8 | 54.0 | 9.3 | 57.5 | 11.2 |
| Democratic People's Republic of Korea | 55.8 | 53.5 | 10.7 | 58.1 | 13.2 |
| Philippines | 55.5 | 51.1 | 8.0 | 59.8 | 11.9 |
| Morocco | 55.4 | 54.9 | 9.2 | 55.9 | 10.0 |
| Vanuatu | 54.9 | 53.4 | 8.9 | 56.3 | 10.8 |
| Solomon Islands | 54.8 | 52.6 | 8.7 | 56.9 | 11.0 |
| Guatemala | 54.3 | 51.4 | 10.4 | 57.2 | 11.6 |
| Guyana | 54.1 | 51.6 | 9.4 | 56.7 | 12.1 |
| Mongolia | 53.9 | 49.9 | 9.7 | 58.0 | 12.7 |
| Tuvalu | 53.9 | 52.0 | 8.8 | 55.7 | 11.0 |
| Uzbekistan | 53.5 | 50.9 | 8.2 | 56.1 | 10.8 |
| Kiribati | 53.2 | 51.1 | 8.7 | 55.4 | 10.8 |
| Azerbaijan | 52.8 | 50.3 | 8.5 | 55.4 | 11.0 |
| Nauru | 52.7 | 48.8 | 6.8 | 56.6 | 10.4 |
| Marshall Islands | 52.6 | 50.4 | 7.9 | 54.7 | 10.3 |
| Kazakhstan | 52.4 | 49.0 | 8.7 | 55.8 | 10.8 |
| Bangladesh | 52.1 | 51.7 | 9.4 | 52.6 | 10.9 |
| Maldives | 51.9 | 49.6 | 5.7 | 54.3 | 7.5 |
| Kyrgyzstan | 51.5 | 47.7 | 6.9 | 55.4 | 10.4 |
| Bhutan | 51.4 | 50.0 | 9.2 | 52.9 | 11.1 |
| India | 51.4 | 51.5 | 9.7 | 51.3 | 10.2 |
| Sao Tome and Principe | 51.4 | 48.1 | 8.2 | 54.7 | 10.8 |
| Pakistan | 50.9 | 50.4 | 9.3 | 51.5 | 10.8 |
| Bolivia | 50.8 | 48.0 | 8.4 | 53.6 | 11.0 |
| Iraq | 50.5 | 47.7 | 8.1 | 53.3 | 11.0 |
| Turkmenistan | 50.3 | 46.7 | 6.8 | 53.8 | 9.7 |
| Tajikistan | 50.1 | 47.0 | 8.4 | 53.2 | 11.8 |
| Comoros | 49.9 | 47.0 | 7.6 | 52.8 | 10.2 |
| Gabon | 49.9 | 48.2 | 9.1 | 51.5 | 11.0 |
| Papua New Guinea | 49.8 | 47.9 | 8.2 | 51.8 | 10.4 |
| Myanmar | 48.9 | 46.5 | 9.0 | 51.4 | 11.0 |
[Page 1363]| Nepal | 48.9 | 48.7 | 8.9 | 49.1 | 10.5 |
| Yemen | 48.4 | 45.5 | 7.0 | 51.2 | 10.4 |
| Gambia | 48.0 | 45.1 | 7.8 | 51.0 | 10.3 |
| Ghana | 47.8 | 45.8 | 8.4 | 49.7 | 10.6 |
| Cambodia | 46.4 | 43.0 | 7.6 | 49.9 | 10.5 |
| Sudan | 45.5 | 42.9 | 7.4 | 48.1 | 9.9 |
| Senegal | 45.4 | 43.1 | 7.4 | 47.7 | 9.8 |
| Madagascar | 44.5 | 42.2 | 7.4 | 46.7 | 9.8 |
| Lao People's Democratic Republic | 44.2 | 42.4 | 7.5 | 46.0 | 9.8 |
| Eritrea | 44.1 | 42.3 | 8.0 | 45.9 | 10.3 |
| Equatorial Guinea | 43.8 | 41.7 | 7.7 | 45.9 | 10.0 |
| Congo | 43.0 | 40.9 | 7.7 | 45.2 | 10.6 |
| Haiti | 42.9 | 38.5 | 8.4 | 47.3 | 11.2 |
| Togo | 42.7 | 40.6 | 7.6 | 44.9 | 10.2 |
| Guinea | 42.4 | 40.0 | 7.3 | 44.7 | 9.6 |
| Benin | 42.1 | 40.1 | 7.1 | 44.1 | 9.5 |
| Nigeria | 41.9 | 40.0 | 7.0 | 43.8 | 9.5 |
| Mauritania | 41.6 | 39.6 | 6.9 | 43.6 | 9.4 |
| South Africa | 41.3 | 40.0 | 8.9 | 42.7 | 11.4 |
| Kenya | 40.8 | 39.5 | 8.1 | 42.1 | 10.7 |
| Namibia | 40.4 | 39.8 | 8.7 | 41.1 | 10.9 |
| Cameroon | 40.4 | 38.8 | 7.3 | 42.0 | 9.9 |
| Djibouti | 40.1 | 37.9 | 6.9 | 42.3 | 9.6 |
| Ethiopia | 38.8 | 36.9 | 7.0 | 40.7 | 9.4 |
| Chad | 38.7 | 35.9 | 6.3 | 41.5 | 9.3 |
| Guinea-Bissau | 38.3 | 36.1 | 6.9 | 40.6 | 9.4 |
| Uganda | 38.0 | 36.2 | 6.9 | 39.8 | 9.4 |
| Côte d'Ivoire | 37.8 | 36.3 | 7.3 | 39.3 | 9.7 |
| United Republic of Tanzania | 37.8 | 36.3 | 6.8 | 39.3 | 9.5 |
| Liberia | 37.5 | 35.3 | 6.6 | 39.6 | 9.1 |
| Mozambique | 36.0 | 34.4 | 6.9 | 37.7 | 9.5 |
| Mali | 35.7 | 33.7 | 6.5 | 37.7 | 9.2 |
| Burkina Faso | 35.1 | 33.9 | 7.0 | 36.3 | 9.4 |
| Somalia | 35.0 | 32.5 | 6.3 | 37.4 | 8.8 |
| Democratic Republic of the Congo | 34.8 | 32.3 | 6.3 | 37.3 | 9.2 |
| Central African Republic | 34.0 | 32.3 | 6.0 | 35.6 | 9.2 |
| Swaziland | 33.9 | 33.8 | 9.0 | 34.1 | 11.0 |
| Rwanda | 33.8 | 31.7 | 6.7 | 36.0 | 9.6 |
| Burundi | 33.7 | 31.7 | 6.8 | 35.7 | 9.6 |
| Afghanistan | 33.4 | 31.1 | 4.9 | 35.7 | 8.7 |
| Lesotho | 33.4 | 33.2 | 8.4 | 33.6 | 10.6 |
| Niger | 33.2 | 31.7 | 6.1 | 34.7 | 8.6 |
| Botswana | 32.9 | 33.0 | 9.1 | 32.7 | 12.2 |
| Zimbabwe | 31.3 | 31.6 | 8.6 | 31.0 | 10.7 |
| Zambia | 30.9 | 30.5 | 7.5 | 31.4 | 10.0 |
| Malawi | 29.8 | 29.0 | 7.2 | 30.7 | 9.5 |
| Angola | 28.7 | 25.7 | 5.8 | 31.7 | 9.2 |
| Sierra Leone | 26.5 | 24.0 | 5.5 | 29.0 | 8.5 |
| SOURCE: World Health Organization. | | | | | |
| [Page 1365]Number of School Associated Violent Deaths, 1992–2000 |
|---|
| Ages 5–19 | | Ages 5–19 | |
| Year | Homicides at school | Homicides away from school | Suicides at school | Suicides away from school |
| 1992–1993 | 34 | 3,583 | 6 | 2,199 |
| 1993–1994 | 29 | 3,806 | 7 | 2,263 |
| 1994–1995 | 28 | 3,546 | 7 | 2,220 |
| 1995–1996 | 32 | 3,303 | 6 | 2,113 |
| 1996–1997 | 28 | 2,950 | 1 | 2,108 |
| 1997–1998 | 34 | 2,728 | 6 | 2,055 |
| 1998–1999 | 33 | 2,366 | 4 | 1,855 |
| 1999–2000 | 16 | 2,124 | 6 | 1,922 |
| Total | 234 | 24,406 | 43 | 16,735 |
| SOURCE: National Center for Education Statistics. | | | | |
| [Page 1367]Percentage of Children Ages 3–5 Not Yet Enrolled in Kindergarten Who Participated in Home Literacy Activities With A Family Member Three Or More Times Per Week |
|---|
| Read to | | Told a story | | Taught letters, words, or numbers | | Taught songs or music | |
| Child and family characteristics | 1993 | 2001 | 1993 | 2001 | 1993 | 2001 | 1993 | 2001 |
| Total | 78.3 | 84.1 | 43 | 54.3 | 57.7 | 74.2 | 41 | 54.1 |
| | | | | Age | | | |
| 3 Years | 79.4 | 83.6 | 46.4 | 54.5 | 57.2 | 71.2 | 45 | 59.9 |
| 4 Years | 77.8 | 85.2 | 41.2 | 54.6 | 58.1 | 77.1 | 38.9 | 51.7 |
| 5 Years | 75.9 | 81.5 | 35.8 | 52 | 57.9 | 74.6 | 33.1 | 40.6 |
| | | | Race/Ethnicity | | | | |
| Asian/Pacific Islander | 68.8 | 87.4 | 52.1 | 58.1 | 61.8 | 77.9 | 35.9 | 50.4 |
| Black | 65.9 | 76.7 | 39 | 51.2 | 62.7 | 77.5 | 48.9 | 53.9 |
| White | 84.8 | 89.4 | 44.3 | 57.9 | 57.2 | 74.8 | 40.2 | 53.4 |
| Other1 | 75.9 | 86.5 | 48.1 | 61.8 | 56 | 78.4 | 31.3 | 57.9 |
| Hispanic | 58.2 | 70.7 | 37.7 | 42.3 | 53.9 | 68.2 | 38.7 | 56.6 |
| | | | Poverty Status | | | | |
| Below poverty threshold (poor) | 67.5 | 73.7 | 39.1 | 50.7 | 59.6 | 72.4 | 45.2 | 57 |
| At or above poverty threshold (nonpoor) | 82.1 | 87.1 | 44.3 | 55.3 | 57 | 74.7 | 39.5 | 53.3 |
| SOURCE: U.S. Department of Education, NCES, School Readiness and Early Childhood Education Program Participation Surveys of the National Household Education Surveys Program. | | | | | | | | |
| 1. Other includes American Indian and Alaska Native. | | | | | | | | |
| [Page 1369]Years of Life Lost in Thousands By Risk Factor and Sex, 2000 (Global) |
|---|
| Males | Females |
| Childhood and maternal undernutrition | | |
| Underweight | 64,119 | 62,766 |
| Iron deficiency | 11,891 | 13,967 |
| Vitamin A deficiency | 11,276 | 14,727 |
| Zinc deficiency | 13,459 | 13,167 |
| Other diet-related risks and physical inactivity | | |
| Blood pressure | 30,206 | 25,342 |
| Cholesterol | 19,373 | 15,600 |
| Overweight | 11,276 | 11,868 |
| Low fruit and vegetable intake | 13,463 | 10,014 |
| Physical inactivity | 8,562 | 7,278 |
| Sexual and reproductive health risks | | |
| Unsafe sex | 36,918 | 40,052 |
| Lack of contraception | — | 4,206 |
| Addictive substances | | |
| Tobacco | 37,913 | 7,708 |
| Alcohol | 28,035 | 4,662 |
| Illicit drugs | 3,841 | 978 |
| Environmental risks | | |
| Unsafe water, sanitation, and hygiene | 24,917 | 24,315 |
| Urban air pollution | 3,533 | 2,871 |
| Indoor smoke from solid fuels | 17,341 | 17,805 |
| Lead exposure | 1,888 | 914 |
| Climate change | 2,415 | 2,530 |
| Occupational risks | | |
| Risk factors for injury | 6,674 | 433 |
| Carcinogens | 1,105 | 271 |
| Airborne particulates | 1,344 | 143 |
| Ergonomic stressors | 4 | 1 |
| Noise | 0 | 0 |
| Other selected risks to health | | |
| Unsafe health care injections | 5,504 | 3,675 |
| Childhood sexual abuse | 784 | 908 |
| SOURCE: World Health Organization. | | |
[Page 1370] 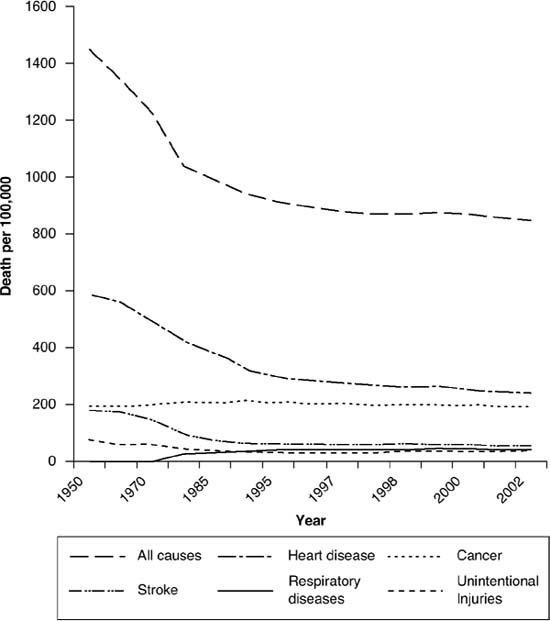
 Watch videos from a variety of sources bringing classroom topics to life