Entry
Reader's guide
Entries A-Z
Subject index
Tissot's Indicatrix
Tissot's indicatrix is a graphical means for the depiction of the amount and direction of distortion inherent in a map projection transformation. Invented by French mathematician Nicolas August Tissot, the elliptical figure is the result of a theoretical pointsized circle of unit radius on the globe or spheroid having gone through the map projection, and so having been distorted in size and shape.
Indicatrixes are normally shown as open circles or ellipses on a projected map and are repeated at regular intervals of latitude and longitude so that their collective pattern communicates to the map user the overall pattern of projection distortion. The ellipses show orientation, since their axes are in the directions of, and in proportion to, the maximum and minimum map scales at the chosen point. For example, if each circle simply expands or contracts but remains a circle, then directions at a point are preserved by the projection and the map is conformal. Similarly, if the circles all become ellipses of various orientations but are all of the same area, then the projection is of equal area or equivalent.
The indicatrix can thus show three dimensions of projection distortion. The orientation shows the direction of maximum scale distortion; the size of the indicatrix shows the amount of scale distortion; and the flattening of the ellipse shows differential directional scale distortion.
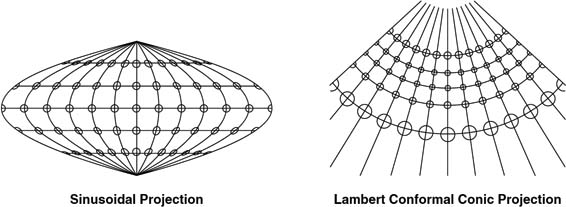
The indicatrix has been shown to be a highly efficient means of communicating projection distortion and blends both visual and mathematical methods. Means for its depiction are often included in map projection and geographic information systems software. Figure 1 shows two projections: left, a sinusoidal projection and, right, a Lambert Conformal Conic with Tissot's indicatrixes. The sinusoidal projection (equivalent, i.e., equal area) shows circles at the equator, becoming increasingly elliptical and angularly distorted as latitude increases and longitude diverges from the central meridian, but remaining the same size. The Lambert Conformal (shape-preserving) Conic projection shows only circles, but these get larger at high and low latitudes and do not change with longitude.
Figure 1 Tissot's Indicatrixes for Sinusoidal and Lambert Conformal Projections
Further Readings
- Analytical Methods
- Analytical Cartography
- Cartographic Modeling
- Cost Surface
- Cost-Benefit Analysis
- Data Mining, Spatial
- Density
- Diffusion
- Ecological Fallacy
- Effects, First- and Second-Order
- Error Propagation
- Exploratory Spatial Data Analysis (ESDA)
- Fragmentation
- Geocoding
- Geodemographics
- Geographical Analysis Machine (GAM)
- Geographically Weighted Regression (GWR)
- Georeferencing, Automated
- Geostatistics
- Geovisualization
- Image Processing
- Interpolation
- Intervisibility
- Kernel
- Location-Allocation Modeling
- Minimum Bounding Rectangle
- Modifiable Areal Unit Problem (MAUP)
- Multicriteria Evaluation
- Multidimensional Scaling (MDS)
- Multivalued Logic
- Network Analysis
- Optimization
- Outliers
- Pattern Analysis
- Polygon Operations
- Qualitative Analysis
- Regionalized Variables
- Slope Measures
- Spatial Analysis
- Spatial Autocorrelation
- Spatial Econometrics
- Spatial Filtering
- Spatial Interaction
- Spatial Statistics
- Spatial Weights
- Spatialization
- Spline
- Structured Query Language (SQL)
- Terrain Analysis
- Cartography and Visualization
- Analytical Cartography
- Cartograms
- Cartography
- Choropleth Map
- Classification, Data
- Datum
- Generalization, Cartographic
- Geovisualization
- Isoline
- Legend
- Multiscale Representations
- Multivariate Mapping
- National Map Accuracy Standards (NMAS)
- Normalization
- Projection
- Scale
- Shaded Relief
- Symbolization
- Three-Dimensional Visualization
- Tissot's Indicatrix
- Topographic Map
- Virtual Environments
- Visual Variables
- Conceptual Foundations
- Accuracy
- Aggregation
- Cognitive Science
- Direction
- Discrete versus Continuous Phenomena
- Distance
- Elevation
- Extent
- First Law of Geography
- Fractals
- Geographic Information Science (GISci)
- Geographic Information Systems (GIS)
- Geometric Primitives
- Isotropy
- Layer
- Logical Expressions
- Mathematical Model
- Mental Map
- Metaphor, Spatial and Map
- Nonstationarity
- Ontology
- Precision
- Representation
- Sampling
- Scale
- Scales of Measurement
- Semantic Interoperability
- Semantic Network
- Spatial Autocorrelation
- Spatial Cognition
- Spatial Heterogeneity
- Spatial Reasoning
- Spatial Relations, Qualitatitve
- Topology
- Uncertainty and Error
- Data Manipulation
- Data Modeling
- z-Values
- Computer-Aided Drafting (CAD)
- Data Modeling
- Data Structures
- Database Management System (DBMS)
- Database, Spatial
- Digital Elevation Model (DEM)
- Discrete versus Continuous Phenomena
- Elevation
- Extensible Markup Language (XML)
- Geometric Primitives
- Index, Spatial
- Integrity Constraints
- Layer
- Linear Referencing
- Network Data Structures
- Object Orientation (OO)
- Open Standards
- Raster
- Scalable Vector Graphics (SVG)
- Spatiotemporal Data Models
- Structured Query Language (SQL)
- Tessellation
- Three-Dimensional GIS
- Topology
- Triangulated Irregular Networks (TIN)
- Virtual Reality Modeling Language (VRML)
- Design Aspects
- Geocomputation
- Geospatial Data
- Accuracy
- Address Standard, U.S.
- Attributes
- BLOB
- Cadastre
- Census
- Census, U.S.
- Computer-Aided Drafting (CAD)
- Coordinate Systems
- Data Integration
- Datum
- Digital Chart of the World (DCW)
- Digital Elevation Model (DEM)
- Framework Data
- Gazetteers
- Geodesy
- Geodetic Control Framework
- Geography Markup Language (GML)
- Geoparsing
- Georeference
- Global Positioning System (GPS)
- Interoperability
- LiDAR
- Linear Referencing
- Metadata, Geospatial
- Metes and Bounds
- Minimum Mapping Unit (MMU)
- National Map Accuracy Standards (NMAS)
- Natural Area Coding System (NACS)
- Photogrammetry
- Postcodes
- Precision
- Projection
- Remote Sensing
- Scale
- Semantic Network
- Spatial Data Server
- Standards
- State Plane Coordinate System
- TIGER
- Topographic Map
- Universal Transverse Mercator (UTM)
- Organizational and Institutional Aspects
- Address Standard, U.S.
- Association of Geographic Information Laboratories for Europe (AGILE)
- Canada Geographic Information System (CGIS)
- Census, U.S.
- Chorley Report
- Coordination of Information on the Environment (CORINE)
- COSIT Conference Series
- Data Access Policies
- Data Warehouse
- Digital Chart of the World (DCW)
- Digital Earth
- Digital Library
- Distributed GIS
- Enterprise GIS
- Environmental Systems Research Institute, Inc. (ESRI)
- ERDAS
- Experimental Cartography Unit (ECU)
- Federal Geographic Data Committee (FGDC)
- Framework Data
- Geomatics
- Geospatial Intelligence
- GIS/LIS Consortium and Conference Series
- Google Earth
- GRASS
- Harvard Laboratory for Computer Graphics and Spatial Analysis
- IDRISI
- Intergraph
- Interoperability
- Land Information Systems
- Life Cycle
- Location-Based Services (LBS)
- Manifold GIS
- MapInfo
- Metadata, Geospatial
- MicroStation
- National Center for Geographic Information and Analysis (NCGIA)
- National Geodetic Survey (NGS)
- National Mapping Agencies
- Open Geospatial Consortium (OGC)
- Open Source Geospatial Foundation (OSGF)
- Open Standards
- Ordnance Survey (OS)
- Quantitative Revolution
- Software, GIS
- Spatial Data Infrastructure
- Spatial Decision Support Systems
- Standards
- U.S. Geological Survey (USGS)
- University Consortium for Geographic Information Science (UCGIS)
- Web GIS
- Web Service
- Societal Issues
- Access to Geographic Information
- Copyright and Intellectual Property Rights
- Critical GIS
- Cybergeography
- Data Access Policies
- Digital Library
- Economics of Geographic Information
- Ethics in the Profession
- Geographic Information Law
- Historical Studies, GIS for
- Liability Associated With Geographic Information
- Licenses, Data and Software
- Location-Based Services (LBS)
- Privacy
- Public Participation GIS (PPGIS)
- Qualitative Analysis
- Quantitative Revolution
- Spatial Literacy
- Loading...
Get a 30 day FREE TRIAL
-
 Watch videos from a variety of sources bringing classroom topics to life
 -
Read modern, diverse business cases
-
Explore hundreds of books and reference titles

Read next

More like this
Sage Recommends
We found other relevant content for you on other Sage platforms.
Have you created a personal profile? Login or create a profile so that you can save clips, playlists and searches