Entry
Reader's guide
Entries A-Z
Subject index
Shaded Relief
Shaded relief, or hill shading, is the graphical depiction of a surface in such a way as to highlight the apparent three-dimensional variation in its shape. Typically, shaded relief maps are used to depict natural terrain, often in combination with other topographic information, such as rivers, land cover, and placenames. While shaded relief maps have been produced manually for several hundreds of years, many geographic information systems (GIS) can show shaded relief automatically from digital elevation models (DEMs) or triangulated irregular networks (TINs). This can be useful when visually exploring the landscape features of a terrain or to provide a contextual backdrop for other geographic information.
The Origins of Shaded Relief Depiction
The use of shading to emphasize the three-dimensional quality of terrain features on maps goes back at least as far as the 15th century. For example, Leonardo da Vinci's “Map of Tuscany and the Chiana Valley” in 1502 (Figure 1) shows shaded hills and their relation to the river valley network and settlements. This was one of the earliest examples of using shaded relief to represent the actual position and form of surface features on a map.
More common in the 18th and 19th centuries was the use of hachures to represent shadow produced by surface features. The printing and reproduction technologies of the time limited the use of shaded relief to such etched lines or points rather than continuous tones. Hachures were used both pictorially to illustrate archetypal hill and mountain features (Figure 2) as well as more precisely to show surface form lines (Figure 3).
As reproduction technologies improved in the 20th century, shaded relief maps increasingly used continuous variations in tone to represent shadow and light on surface features. Probably of greatest influence in the development of shaded relief depiction in the 20th century was the output of Swiss cartographers, in particular the work of Eduard Imhof. Imhof provided detailed guidance on the use of color, shade, and symbolization in the depiction of relief that continues to be used today in topographic mapping.
Figure 1 Detail From “Map of Tuscany and the Chiana Valley”
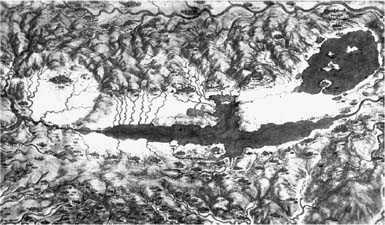
Figure 2 Detail From “Map of Vancouver, 1798,” University of Washington Libraries
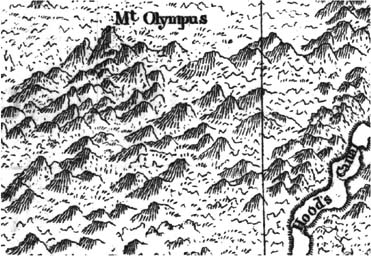
Shows use of hachures to highlight symbolic three-dimensional mountain features.
Figure 3 Detail from “Map Showing the Line of Boundary Between the United States & British Possessions 1868,” University of Washington Libraries
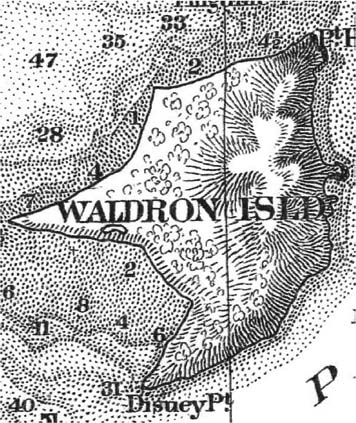
Shows hachures to represent slope lines.
Automated Shaded Relief from Digital Elevation Models
Computer-generated cartography and GIS have been able to in part reproduce the types of relief shading evident in the manual cartography of the 20th century. By processing a DEM or TIN, it is possible to model the amount of light and shadow falling on every point on a surface. To speed up calculation time required to produce automated shaded relief, it is common for GIS to use a local Lambertian lighting model to approximate the amount of light reflected from every point on a landscape. This tends to be calculated in a similar way to that of gradient and aspect.
...
- Analytical Methods
- Analytical Cartography
- Cartographic Modeling
- Cost Surface
- Cost-Benefit Analysis
- Data Mining, Spatial
- Density
- Diffusion
- Ecological Fallacy
- Effects, First- and Second-Order
- Error Propagation
- Exploratory Spatial Data Analysis (ESDA)
- Fragmentation
- Geocoding
- Geodemographics
- Geographical Analysis Machine (GAM)
- Geographically Weighted Regression (GWR)
- Georeferencing, Automated
- Geostatistics
- Geovisualization
- Image Processing
- Interpolation
- Intervisibility
- Kernel
- Location-Allocation Modeling
- Minimum Bounding Rectangle
- Modifiable Areal Unit Problem (MAUP)
- Multicriteria Evaluation
- Multidimensional Scaling (MDS)
- Multivalued Logic
- Network Analysis
- Optimization
- Outliers
- Pattern Analysis
- Polygon Operations
- Qualitative Analysis
- Regionalized Variables
- Slope Measures
- Spatial Analysis
- Spatial Autocorrelation
- Spatial Econometrics
- Spatial Filtering
- Spatial Interaction
- Spatial Statistics
- Spatial Weights
- Spatialization
- Spline
- Structured Query Language (SQL)
- Terrain Analysis
- Cartography and Visualization
- Analytical Cartography
- Cartograms
- Cartography
- Choropleth Map
- Classification, Data
- Datum
- Generalization, Cartographic
- Geovisualization
- Isoline
- Legend
- Multiscale Representations
- Multivariate Mapping
- National Map Accuracy Standards (NMAS)
- Normalization
- Projection
- Scale
- Shaded Relief
- Symbolization
- Three-Dimensional Visualization
- Tissot's Indicatrix
- Topographic Map
- Virtual Environments
- Visual Variables
- Conceptual Foundations
- Accuracy
- Aggregation
- Cognitive Science
- Direction
- Discrete versus Continuous Phenomena
- Distance
- Elevation
- Extent
- First Law of Geography
- Fractals
- Geographic Information Science (GISci)
- Geographic Information Systems (GIS)
- Geometric Primitives
- Isotropy
- Layer
- Logical Expressions
- Mathematical Model
- Mental Map
- Metaphor, Spatial and Map
- Nonstationarity
- Ontology
- Precision
- Representation
- Sampling
- Scale
- Scales of Measurement
- Semantic Interoperability
- Semantic Network
- Spatial Autocorrelation
- Spatial Cognition
- Spatial Heterogeneity
- Spatial Reasoning
- Spatial Relations, Qualitatitve
- Topology
- Uncertainty and Error
- Data Manipulation
- Data Modeling
- z-Values
- Computer-Aided Drafting (CAD)
- Data Modeling
- Data Structures
- Database Management System (DBMS)
- Database, Spatial
- Digital Elevation Model (DEM)
- Discrete versus Continuous Phenomena
- Elevation
- Extensible Markup Language (XML)
- Geometric Primitives
- Index, Spatial
- Integrity Constraints
- Layer
- Linear Referencing
- Network Data Structures
- Object Orientation (OO)
- Open Standards
- Raster
- Scalable Vector Graphics (SVG)
- Spatiotemporal Data Models
- Structured Query Language (SQL)
- Tessellation
- Three-Dimensional GIS
- Topology
- Triangulated Irregular Networks (TIN)
- Virtual Reality Modeling Language (VRML)
- Design Aspects
- Geocomputation
- Geospatial Data
- Accuracy
- Address Standard, U.S.
- Attributes
- BLOB
- Cadastre
- Census
- Census, U.S.
- Computer-Aided Drafting (CAD)
- Coordinate Systems
- Data Integration
- Datum
- Digital Chart of the World (DCW)
- Digital Elevation Model (DEM)
- Framework Data
- Gazetteers
- Geodesy
- Geodetic Control Framework
- Geography Markup Language (GML)
- Geoparsing
- Georeference
- Global Positioning System (GPS)
- Interoperability
- LiDAR
- Linear Referencing
- Metadata, Geospatial
- Metes and Bounds
- Minimum Mapping Unit (MMU)
- National Map Accuracy Standards (NMAS)
- Natural Area Coding System (NACS)
- Photogrammetry
- Postcodes
- Precision
- Projection
- Remote Sensing
- Scale
- Semantic Network
- Spatial Data Server
- Standards
- State Plane Coordinate System
- TIGER
- Topographic Map
- Universal Transverse Mercator (UTM)
- Organizational and Institutional Aspects
- Address Standard, U.S.
- Association of Geographic Information Laboratories for Europe (AGILE)
- Canada Geographic Information System (CGIS)
- Census, U.S.
- Chorley Report
- Coordination of Information on the Environment (CORINE)
- COSIT Conference Series
- Data Access Policies
- Data Warehouse
- Digital Chart of the World (DCW)
- Digital Earth
- Digital Library
- Distributed GIS
- Enterprise GIS
- Environmental Systems Research Institute, Inc. (ESRI)
- ERDAS
- Experimental Cartography Unit (ECU)
- Federal Geographic Data Committee (FGDC)
- Framework Data
- Geomatics
- Geospatial Intelligence
- GIS/LIS Consortium and Conference Series
- Google Earth
- GRASS
- Harvard Laboratory for Computer Graphics and Spatial Analysis
- IDRISI
- Intergraph
- Interoperability
- Land Information Systems
- Life Cycle
- Location-Based Services (LBS)
- Manifold GIS
- MapInfo
- Metadata, Geospatial
- MicroStation
- National Center for Geographic Information and Analysis (NCGIA)
- National Geodetic Survey (NGS)
- National Mapping Agencies
- Open Geospatial Consortium (OGC)
- Open Source Geospatial Foundation (OSGF)
- Open Standards
- Ordnance Survey (OS)
- Quantitative Revolution
- Software, GIS
- Spatial Data Infrastructure
- Spatial Decision Support Systems
- Standards
- U.S. Geological Survey (USGS)
- University Consortium for Geographic Information Science (UCGIS)
- Web GIS
- Web Service
- Societal Issues
- Access to Geographic Information
- Copyright and Intellectual Property Rights
- Critical GIS
- Cybergeography
- Data Access Policies
- Digital Library
- Economics of Geographic Information
- Ethics in the Profession
- Geographic Information Law
- Historical Studies, GIS for
- Liability Associated With Geographic Information
- Licenses, Data and Software
- Location-Based Services (LBS)
- Privacy
- Public Participation GIS (PPGIS)
- Qualitative Analysis
- Quantitative Revolution
- Spatial Literacy
- Loading...
Get a 30 day FREE TRIAL
-
 Watch videos from a variety of sources bringing classroom topics to life
 -
Read modern, diverse business cases
-
Explore hundreds of books and reference titles

Read next

More like this
Sage Recommends
We found other relevant content for you on other Sage platforms.
Have you created a personal profile? Login or create a profile so that you can save clips, playlists and searches