Entry
Reader's guide
Entries A-Z
Subject index
Appendix A: Data on Race and Ethnicity in the United States, 1820 to the Present
Introduction to Appendix A
The fourteen tables in this Appendix offer insight into the patterns of race and ethnicity, stretching back to 1820 with population projections into 2050. Even a casual examination of these data will confirm the dynamic nature of race and ethnicity in the United States in a period covering 230 years.
Immigrants, Refugees, and Naturalizations
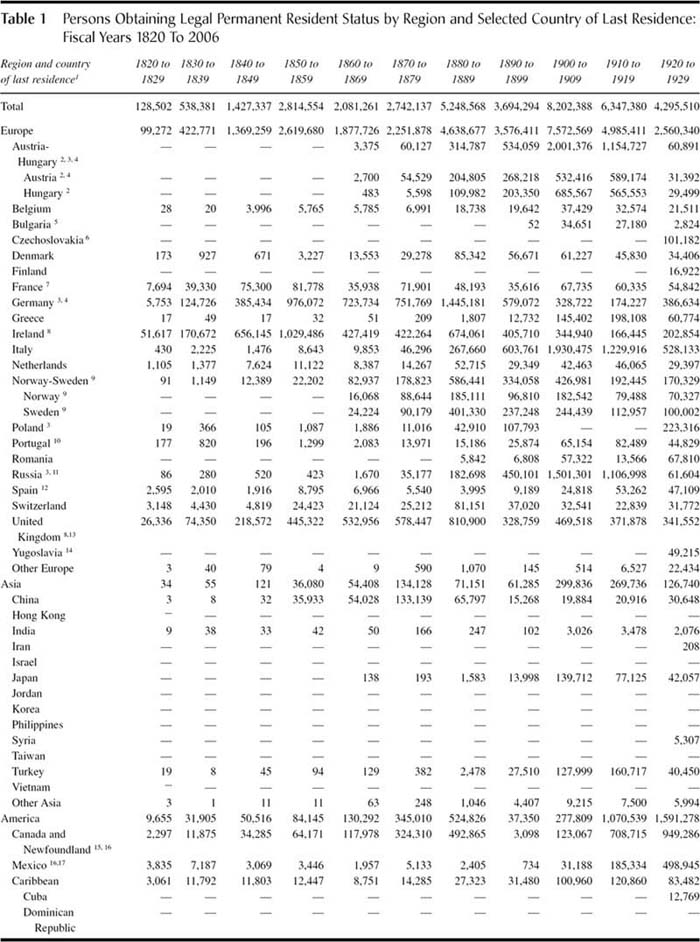
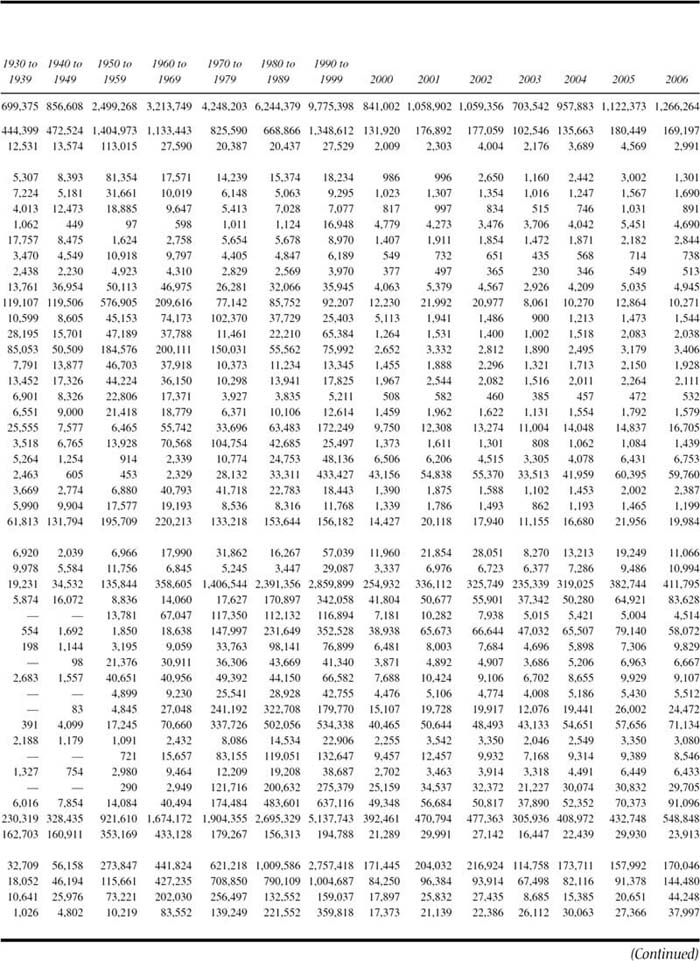
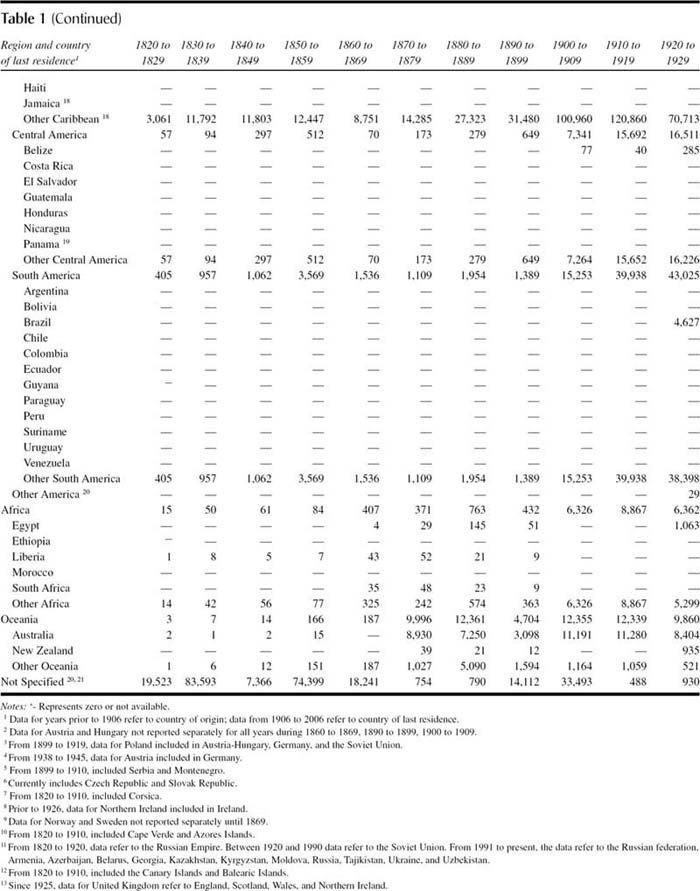
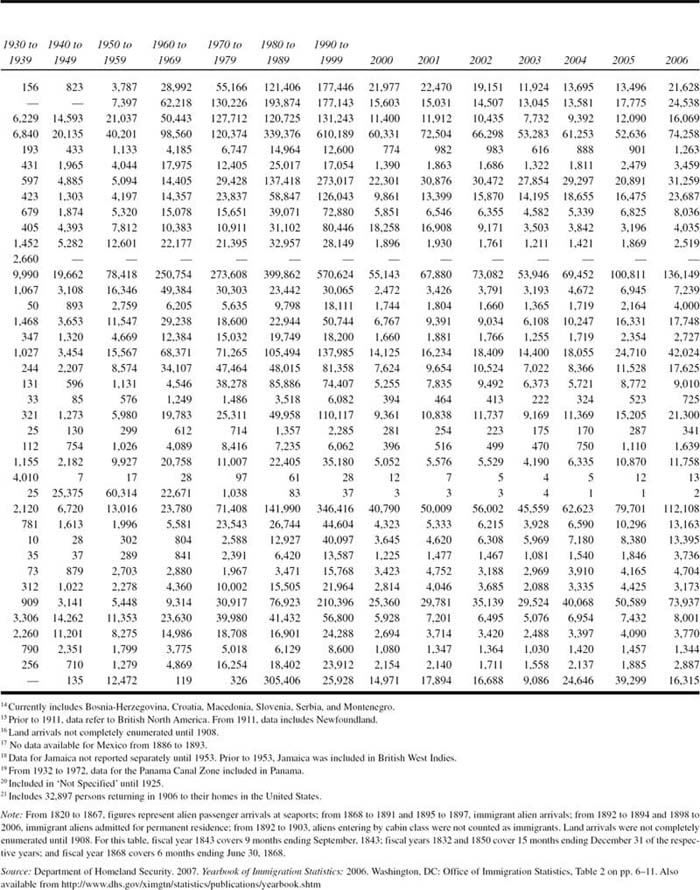
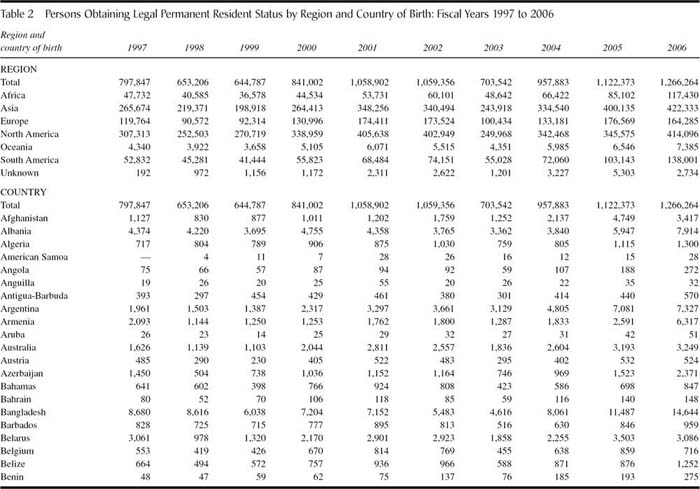
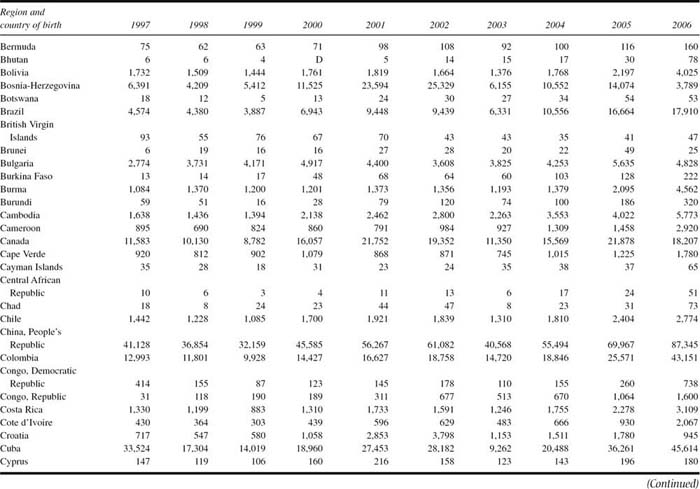
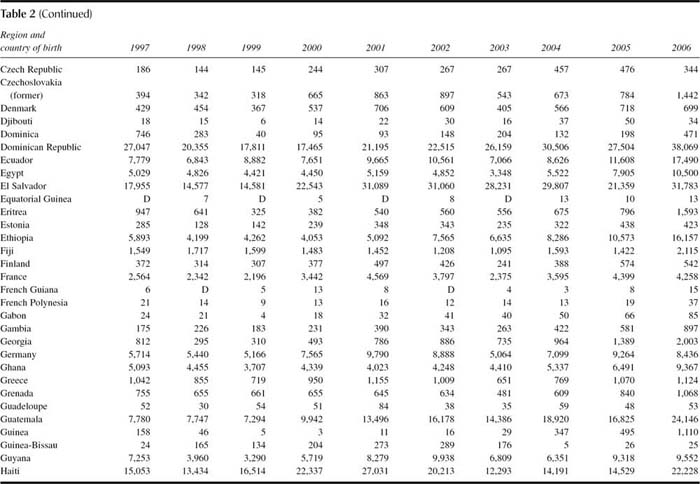
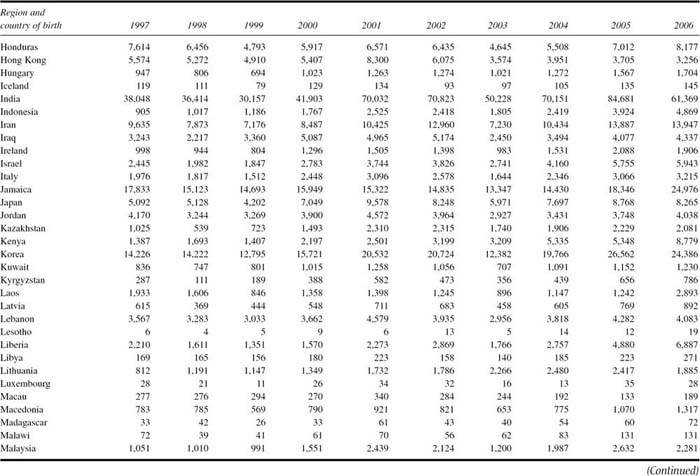
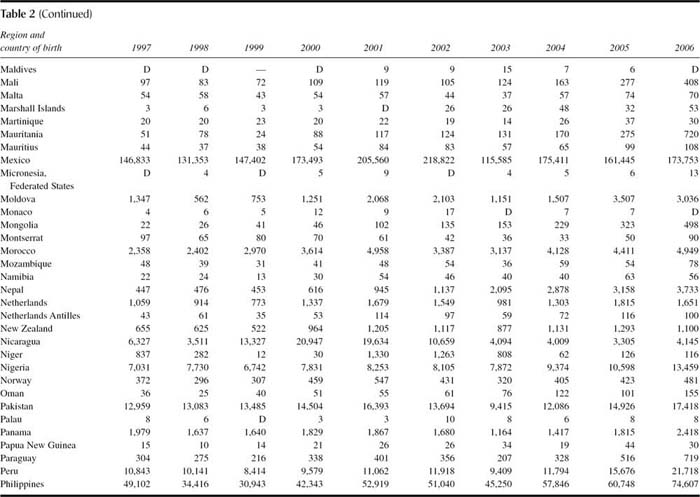
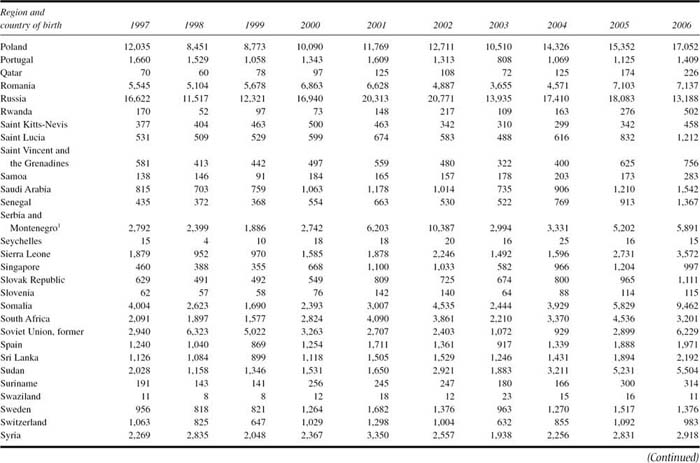
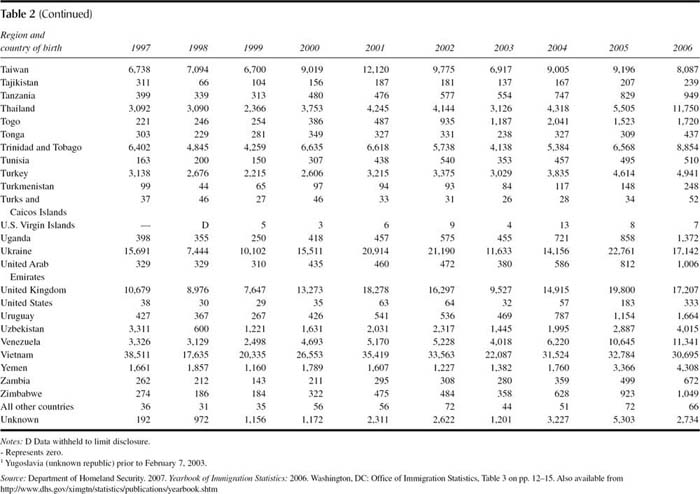
The first six tables summarize data from the Office of Immigration Statistics of the Department of Homeland Security. Historical data are presented from 1820 by decade and for recent years annually of the number of people who are granted legal permanent resident status. This would consist of what most people consider to be immigrants—people who enter the country legally who intend to remain here and are not tourists, foreign students, or diplomats. This group of legal permanent residents would include those known as green card recipients. Once here, foreign students and refugees can apply to legal permanent resident status, and if it is granted, they then become immigrants.
Tables 1 and 2 may seem similar, but there is an important distinction between them. One identifies groups by virtue of “last residence” while the other gives “country of birth.” Many immigrants granted entry to the United States enter from residence in a country other than that of their birth. For example, Table 1 shows 83,628 immigrants with a last residence of China in 2006, and 4,514 from Hong Kong. Yet in Table 2 we see that 87,345 immigrants were born in China that same year while only 3,216 were actually born in Hong Kong.
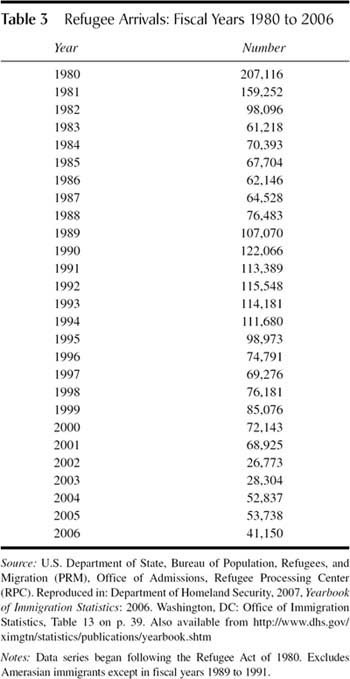
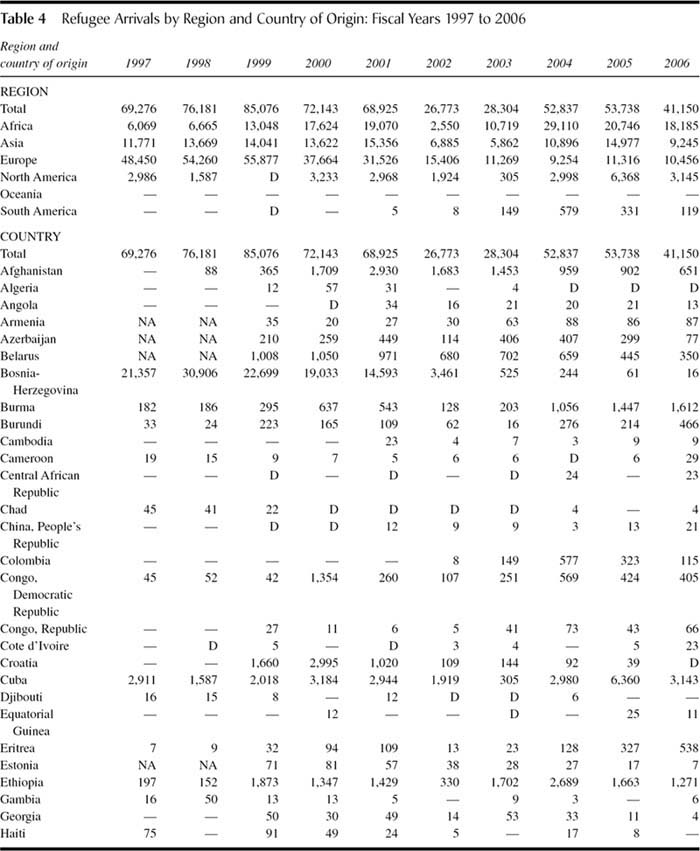
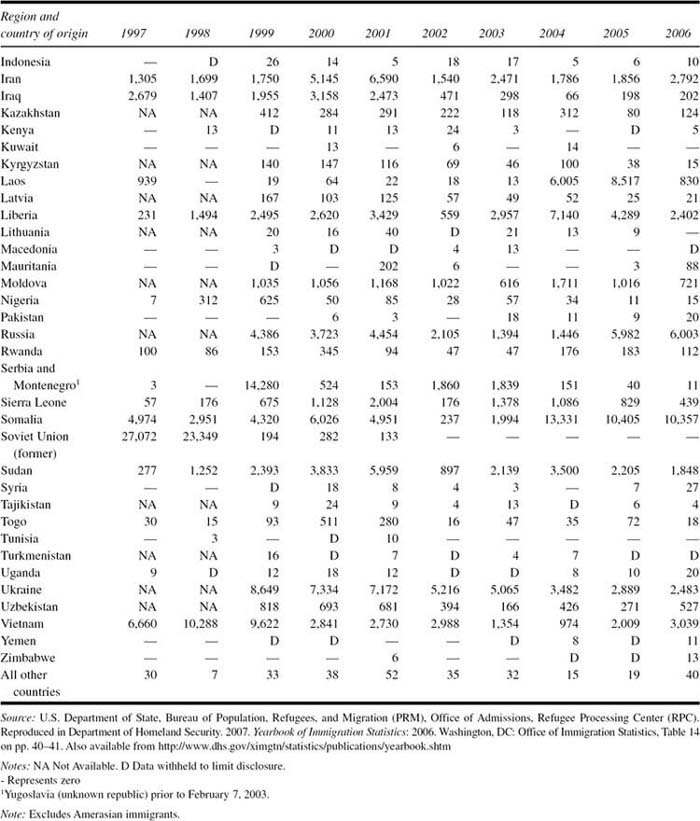
Data on refugees (Tables 3 and 4) account for persons granted entry in order to avoid persecution in their country of origin, and they have applied for admission while still living outside the United States. Besides actual persecution, refugee status may be granted based on a well-founded fear of persecution because of race, religion, nationality, membership in a particular social group, or political opinion. Refugees may typically bring spouses and children with them. The first official refugees were granted entry in 1948 in the aftermath of World War II and the domination of Eastern Europe by the Soviet Union.
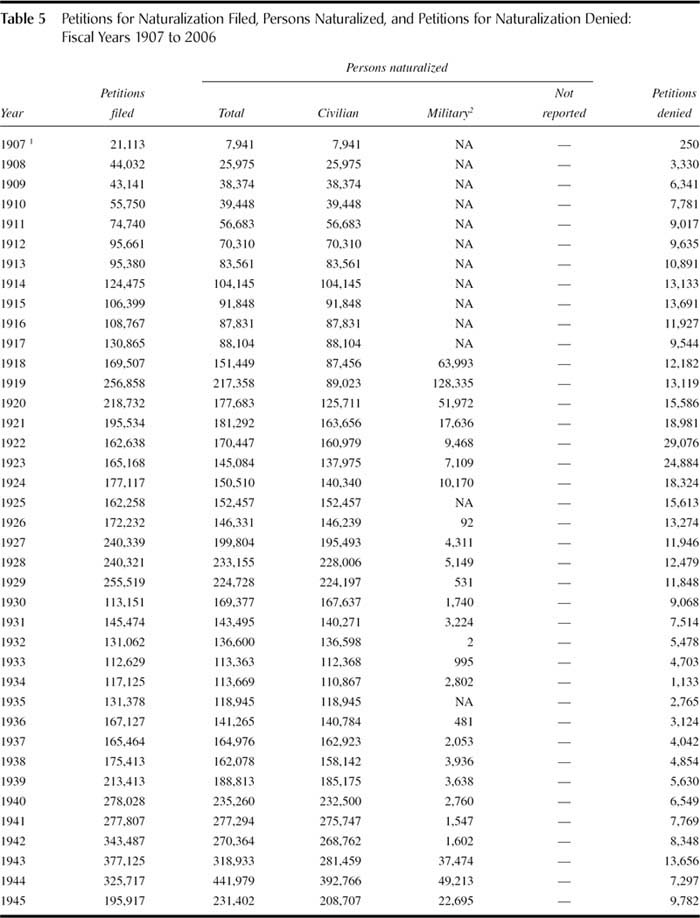
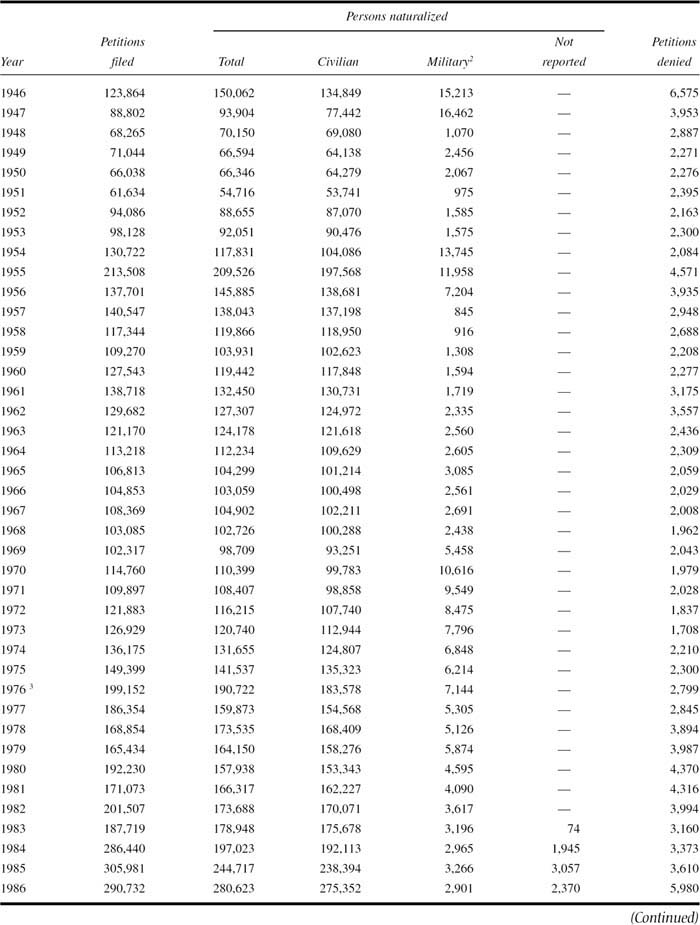
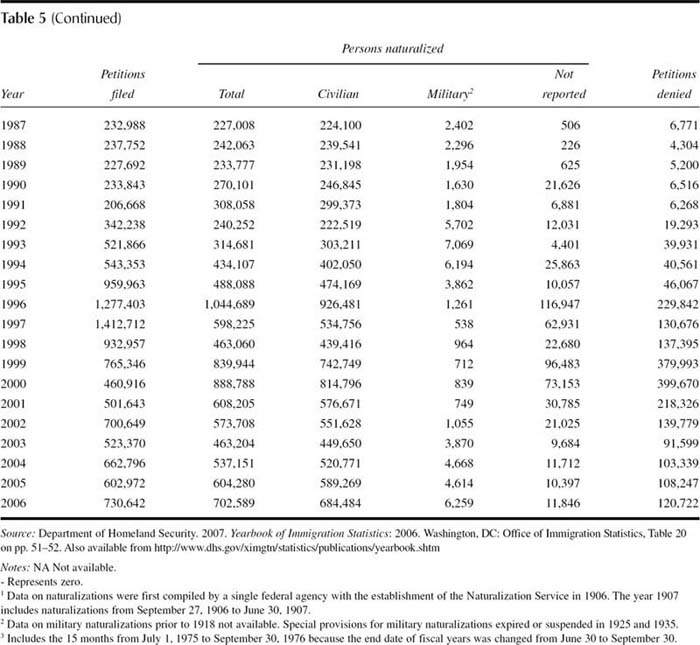
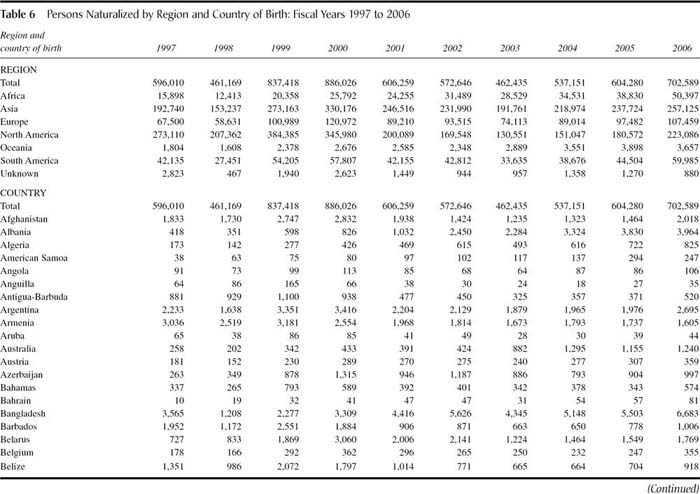
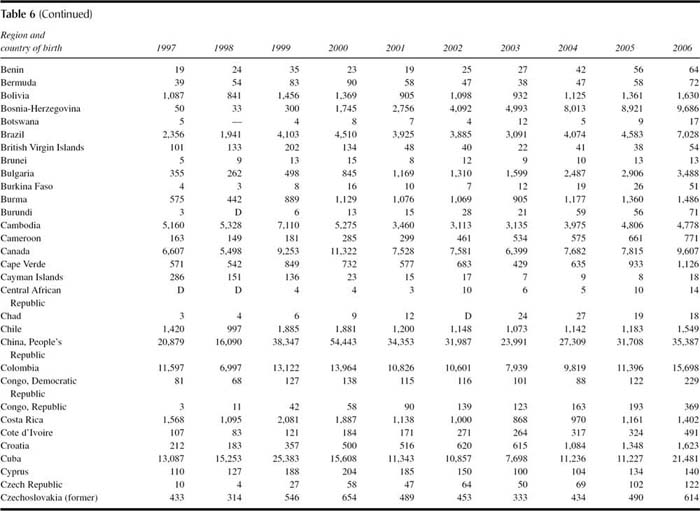
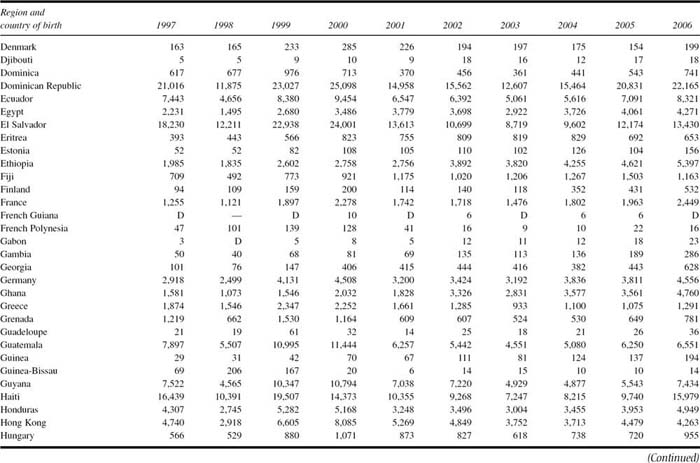
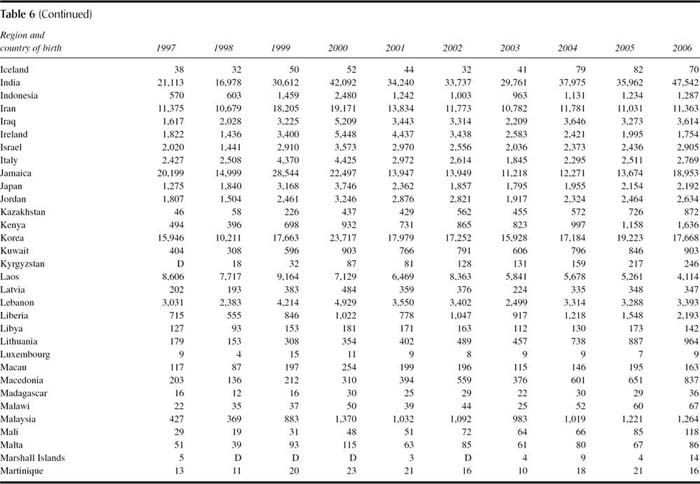
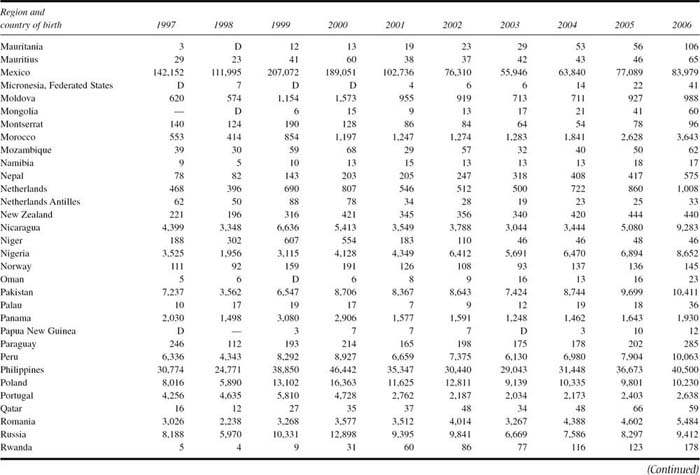
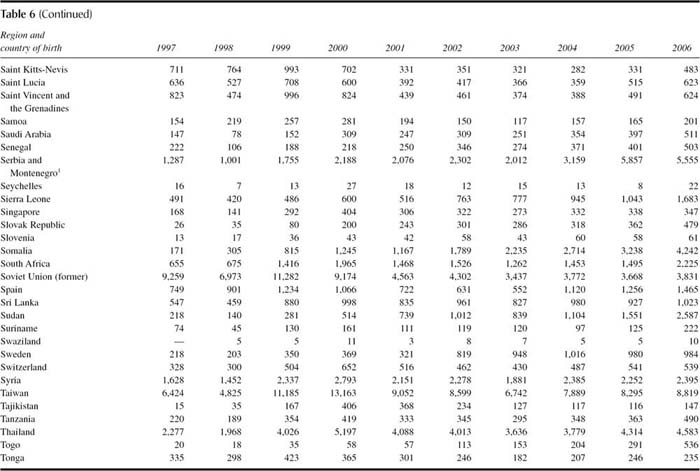
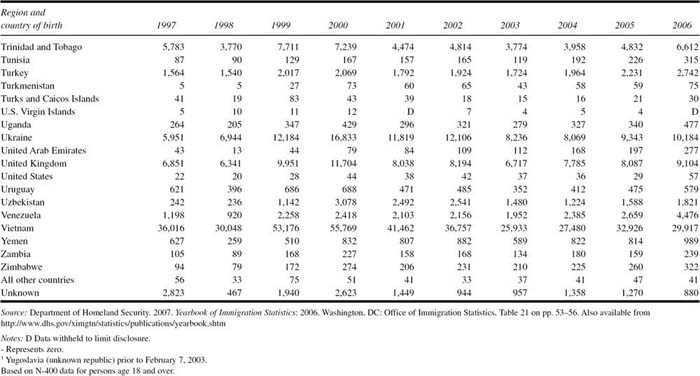
Naturalization data (Tables 5 and 6) refer to person's age 18 and older who become citizens of the United States. The naturalization process has changed over the generations, but recently legal permanent residents have been permitted to apply for citizenship status after five years in the country (although they are not required to do so). Typically, spouses of U.S. citizens may apply after 3 years. Foreign-born children automatically (that is, without applying) become citizens if one parent is a citizen or becomes one while they are still under 18 years of age. On July 30, 2007, the citizenship application fee was raised to $675. In 2006, 702,589 people were naturalized and therefore became eligible to vote and to apply for U.S. passports.
For all these tables relating to nation of origin or birth, the changing political boundaries and names of countries requires special caution as one examines data from further back in history.
The American Community Survey
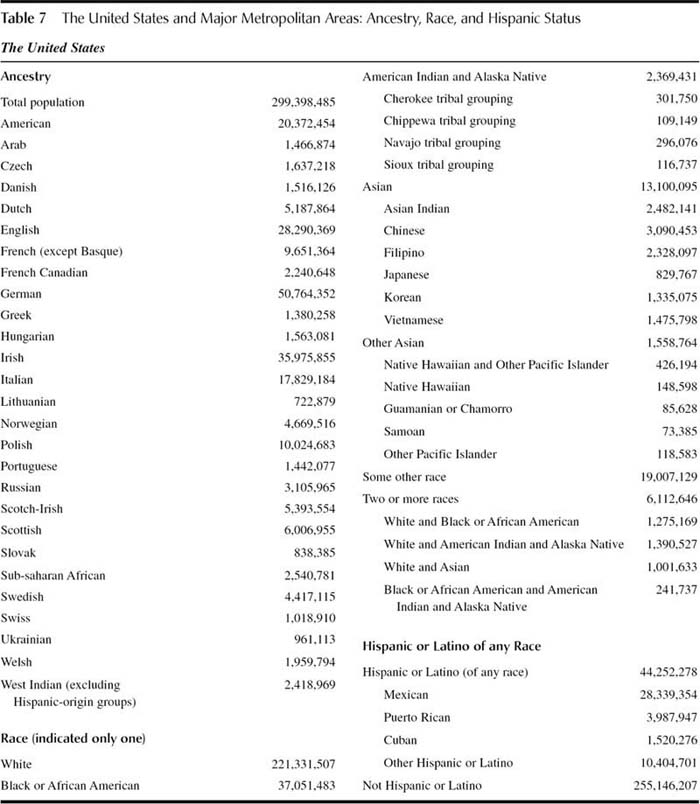
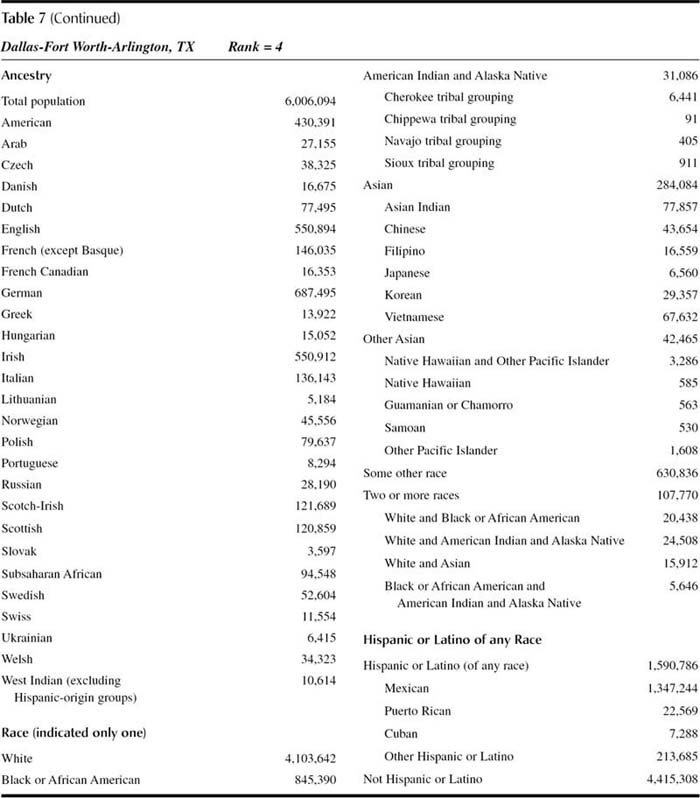
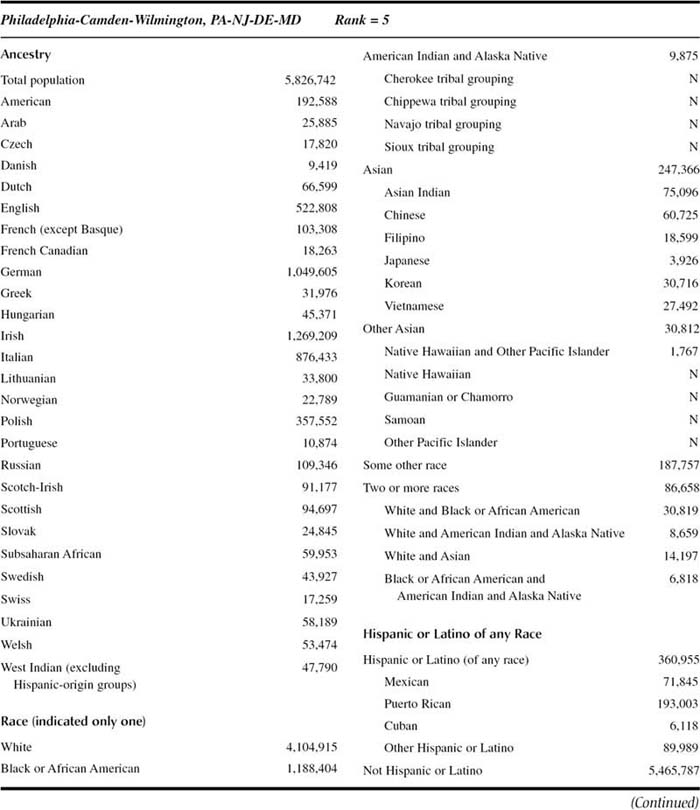
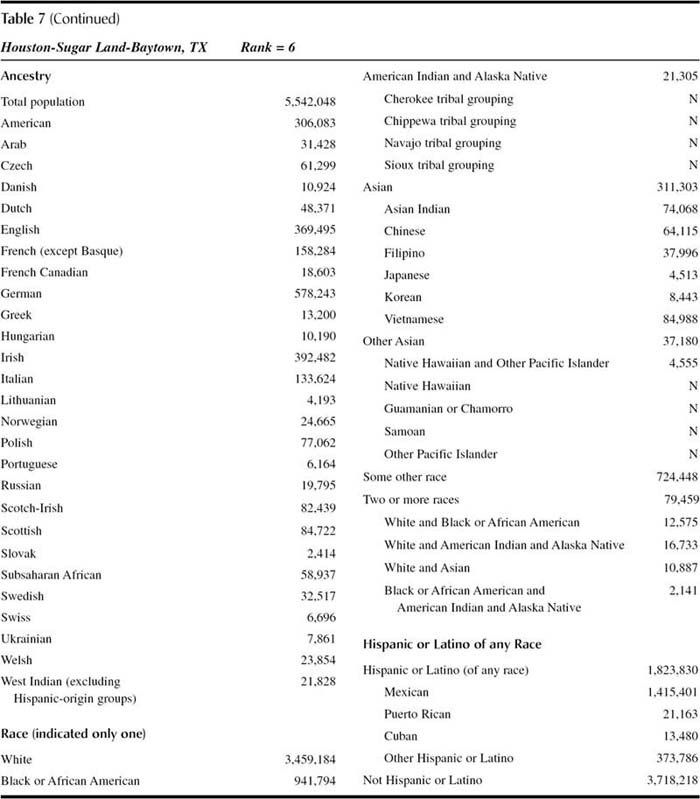
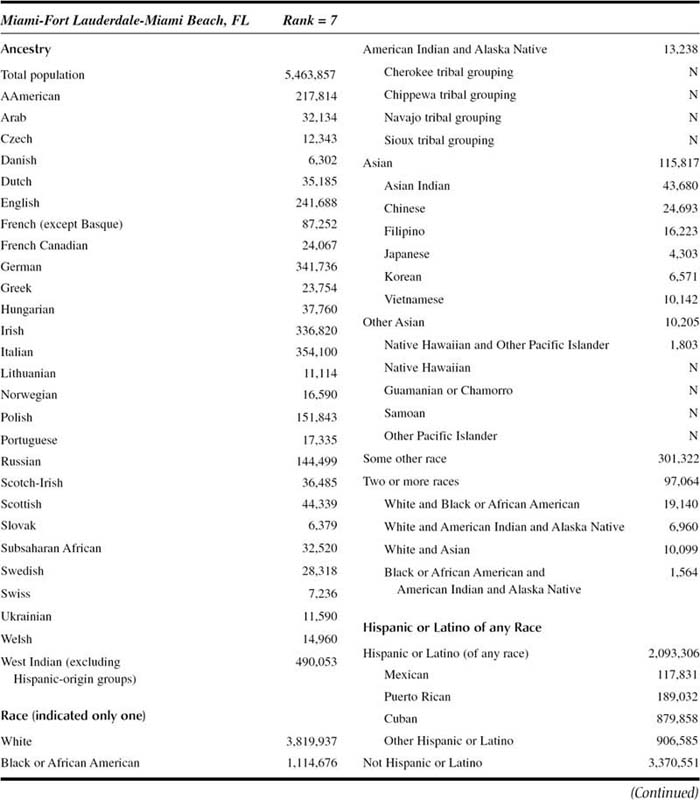
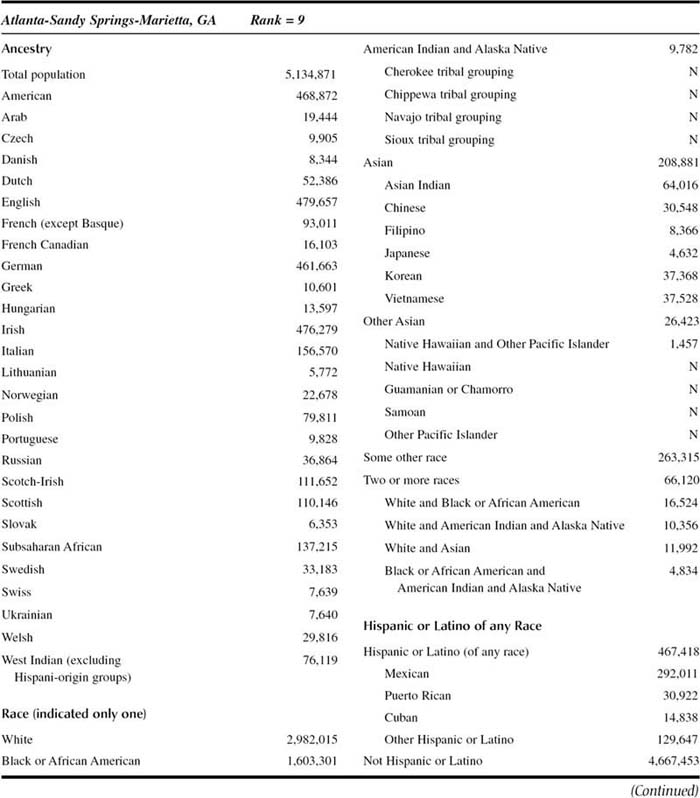
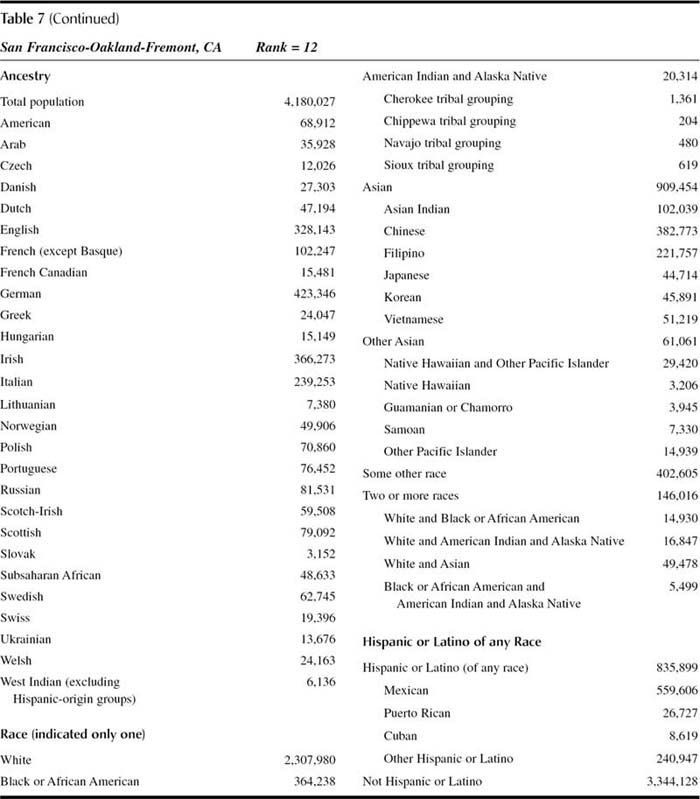
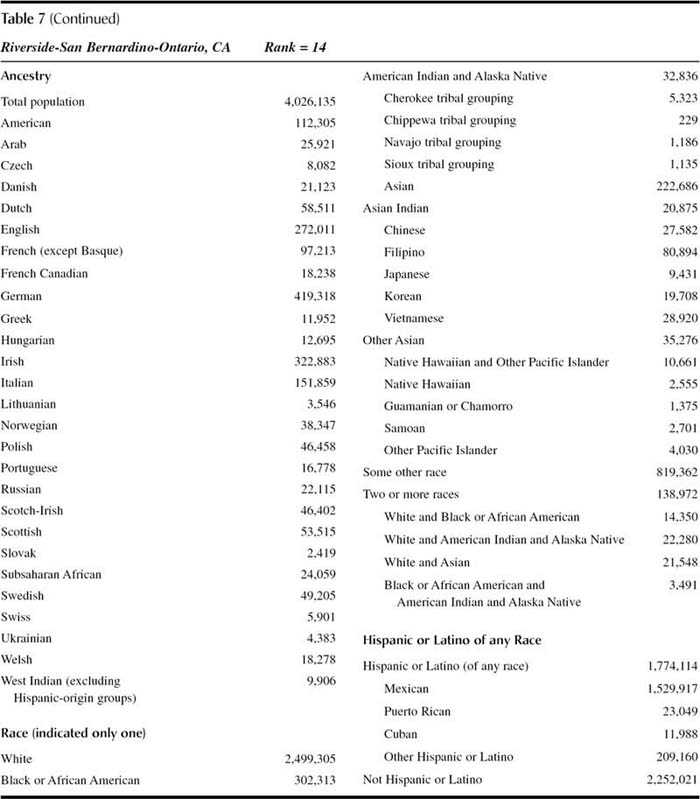
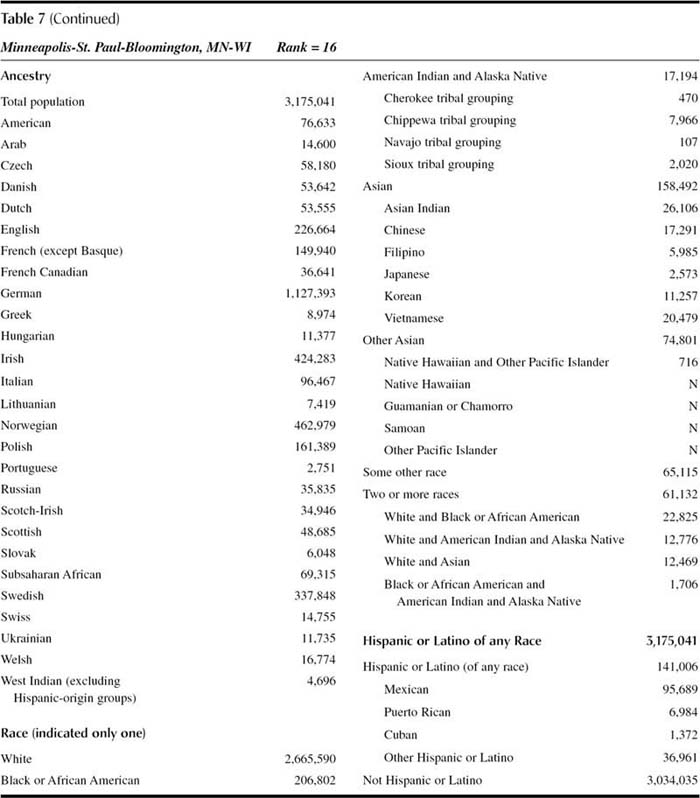
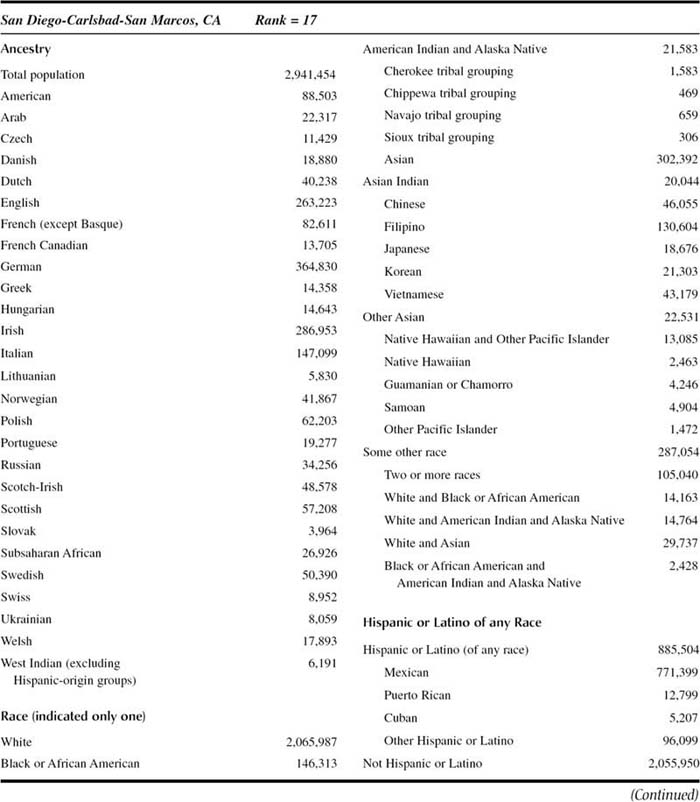
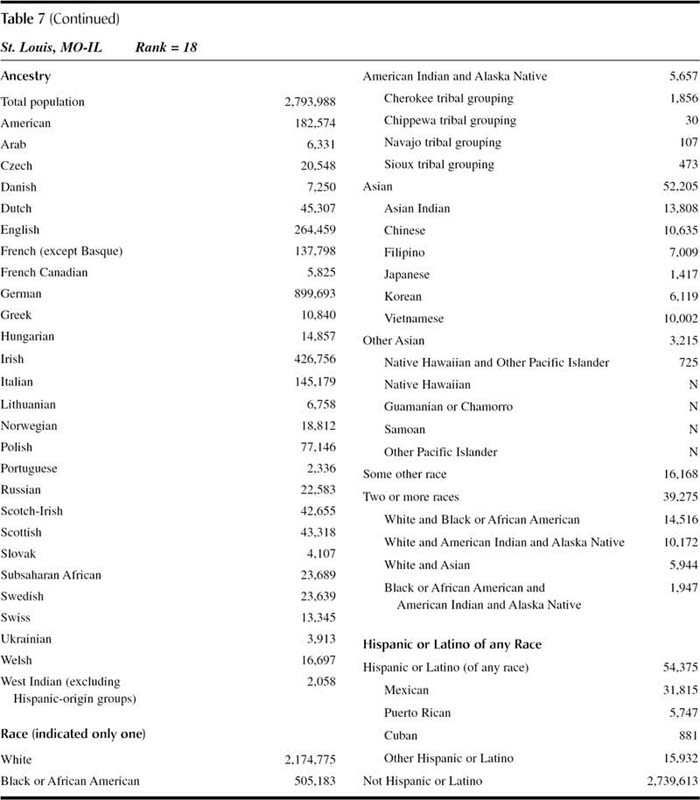
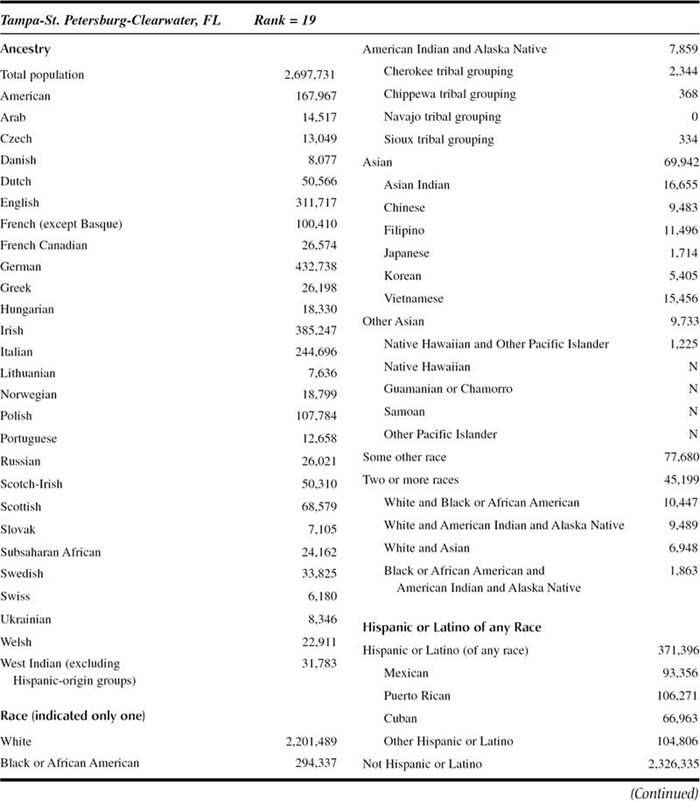
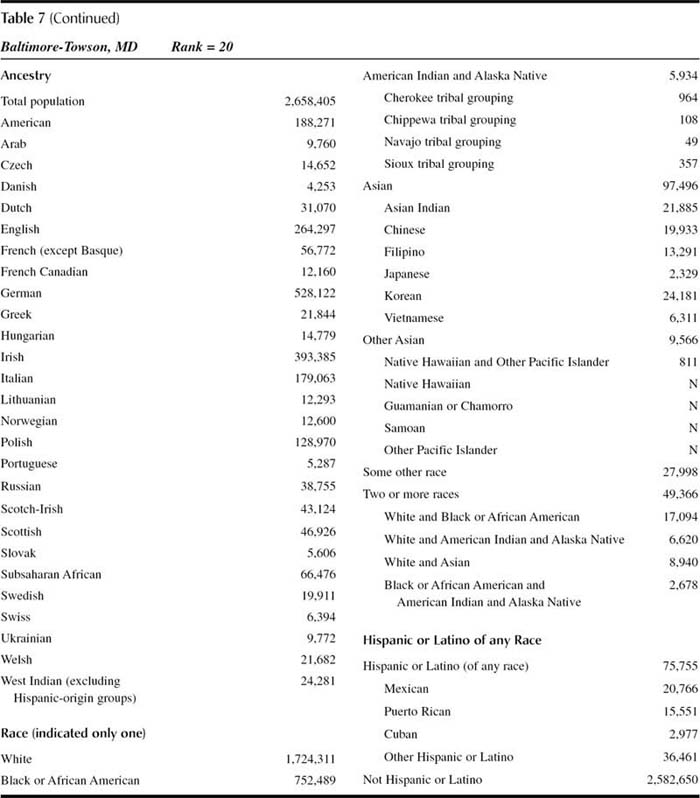
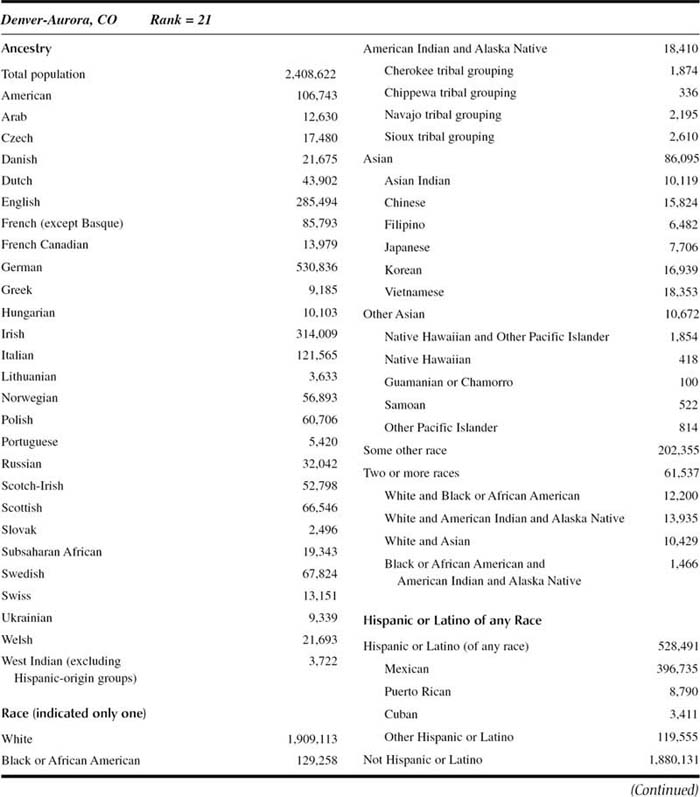
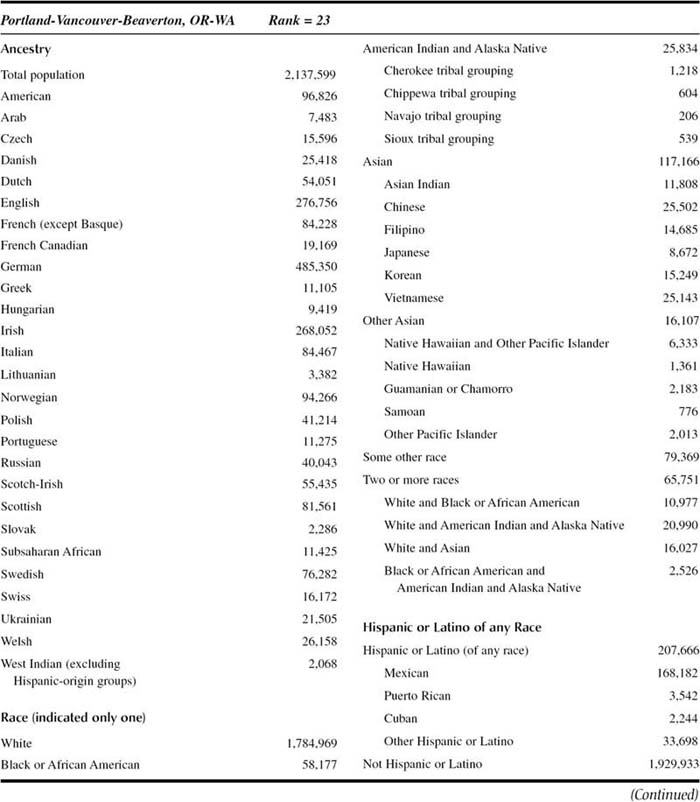
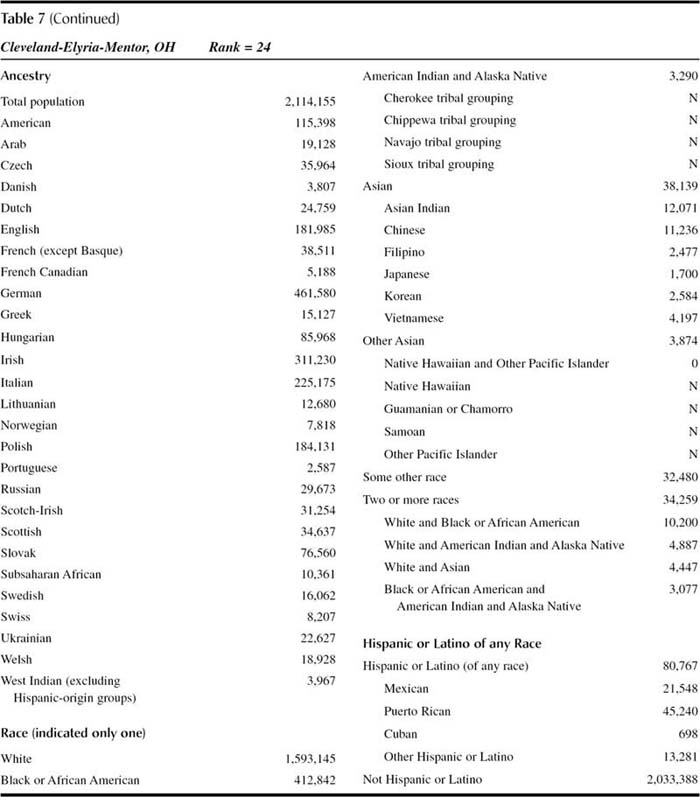
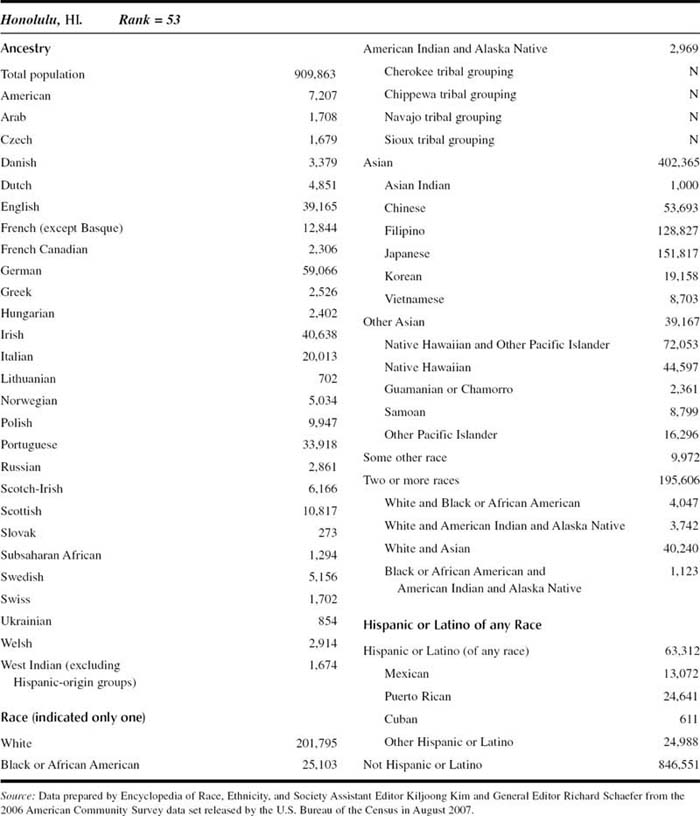
A contemporary picture of U.S. racial and ethnic diversity can be found in our analysis of data from the American Community Survey (ACS). The 2006 ACS data are based on a U.S. Census sample of 3 million housing-unit addresses, collected from all 3,141 U.S. counties, American Indian and Alaska Native areas, and Native Hawaiian areas. These data were released August 27, 2007, and include profiles of many racial and ethnic groups, such as African Americans, Chinese Americans, and Mexican Americans. In addition, profiles for 72 ancestry groups, from Afghani to Welsh, are also available.
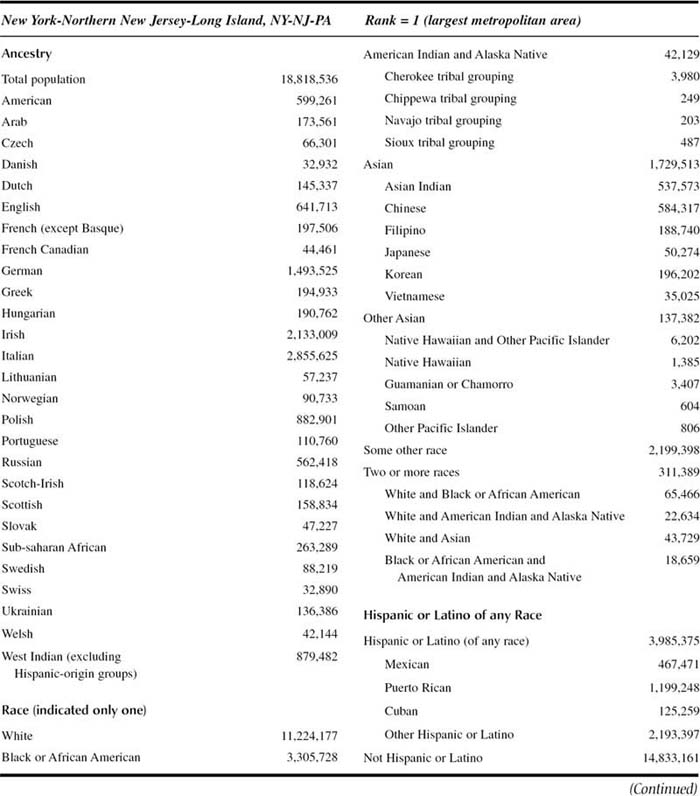
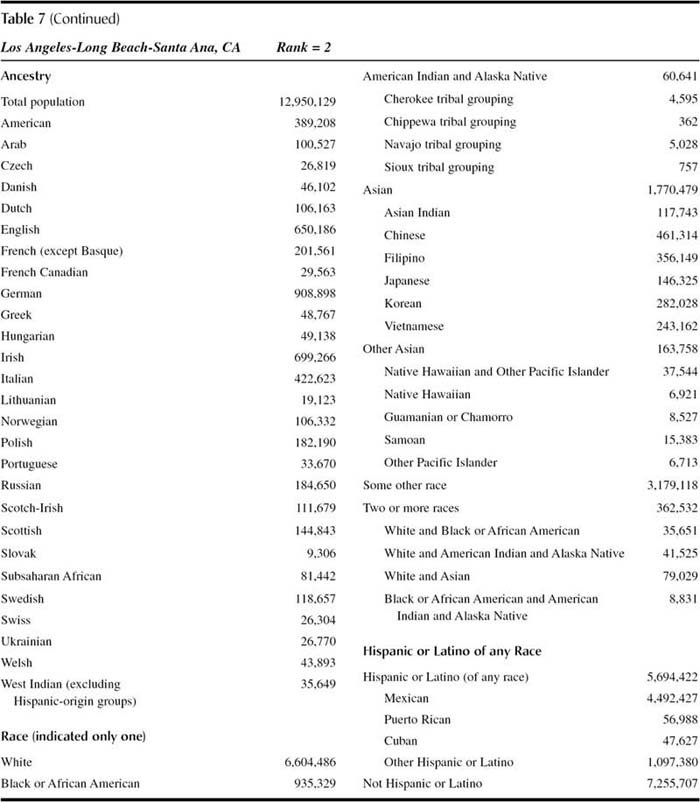
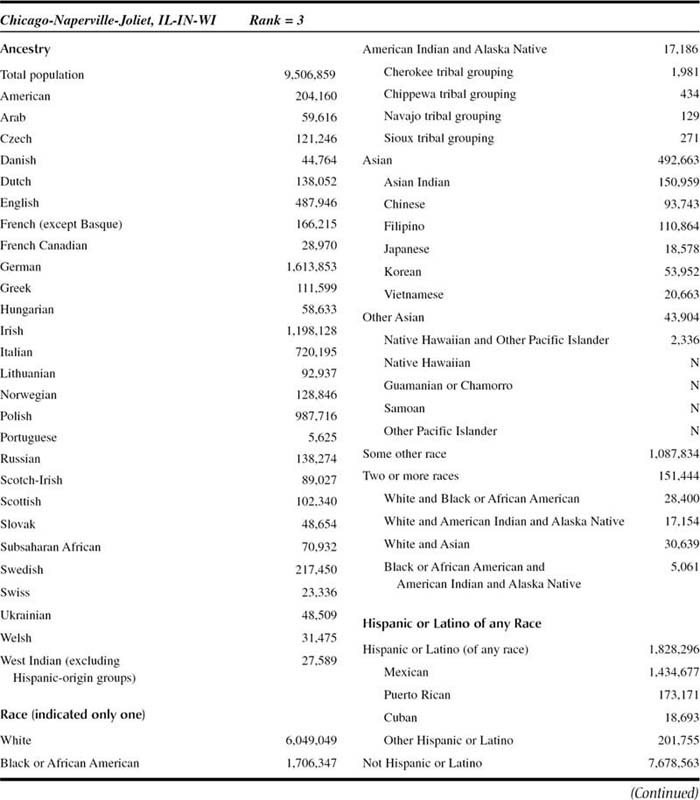
The first data set taken from the ACS (Table 7) shows the major racial and ethnic groups for the United States as a whole as well as for the 24 largest metropolitan areas, ranked from largest to smallest. We have added one additional metropolitan area, Honolulu, ranked as number 53, because of its distinctive pattern of diversity compared to the rest of the nation.
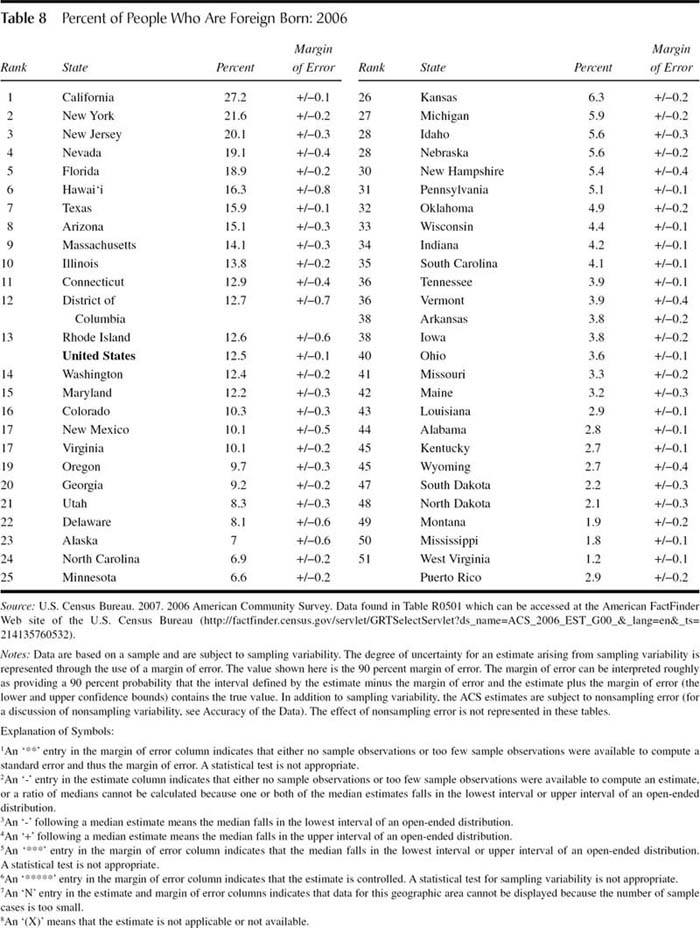
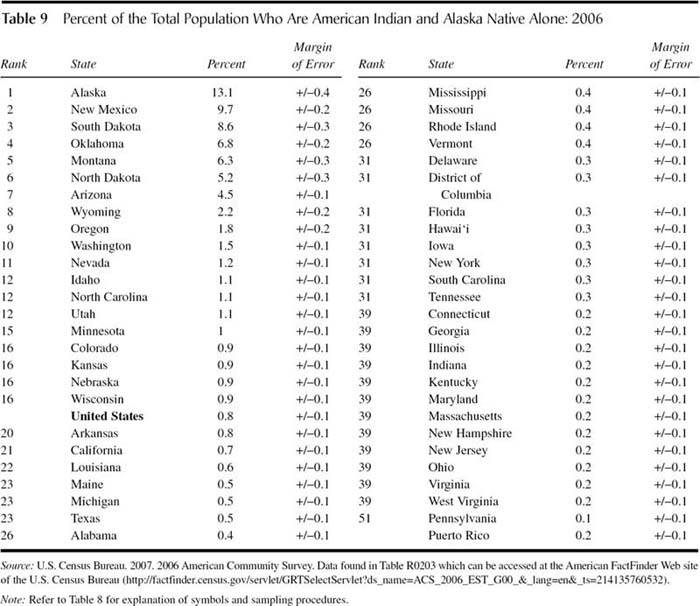
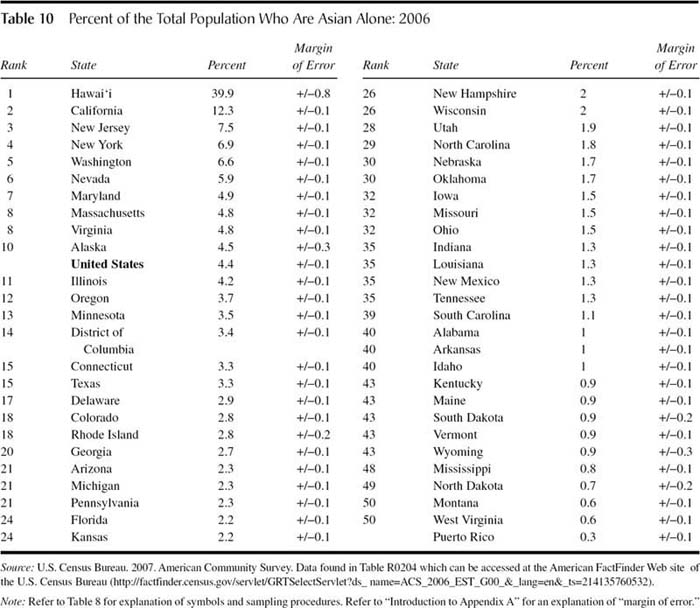
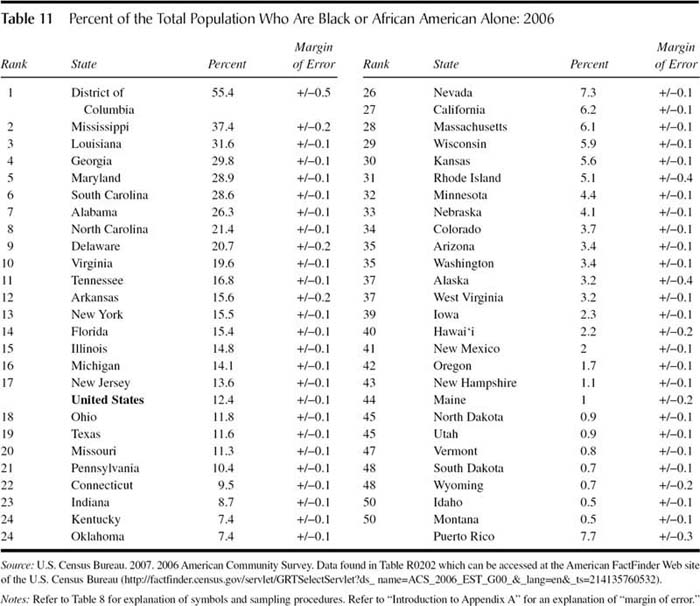
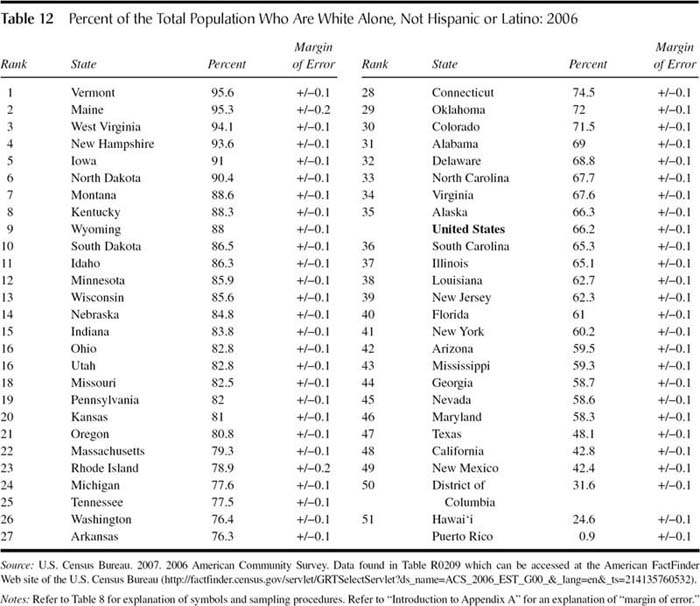
Ranking tables from the ACS (Tables 8–12) provide an overview of data at the state level for the proportions of foreign-born, American Indian and Alaska Native, Asian American, African American, or White non-Hispanic people in the 2006 U.S. population. Since the data are based on a sample, we show margins of error. These estimates offer a margin of error, that is, points at the upper and lower bounds of the confidence interval as “wings” or “arms” extending to either side of the estimated proportion or percentage. Typically, the span of this margin of error is less than 1 percent. So, for example, in Table 8, we see that California has 27.2 percent foreign-born population with a margin of error of +/-0.1 percent. This means that, if we surveyed all California residents instead of a sample of the population, the actual percent of foreign-born residents would most likely be between 27.1 and 27.3 percent.
Projections
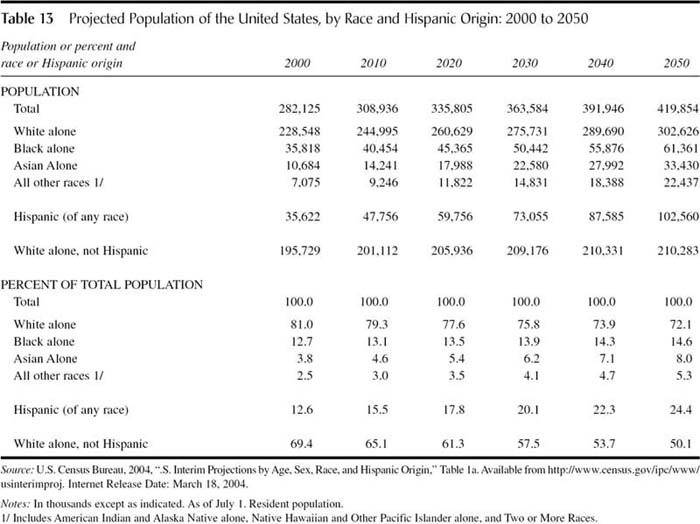
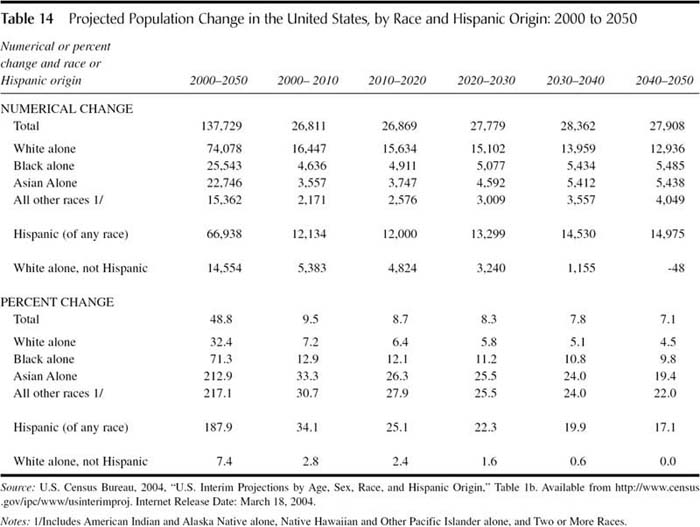
Tables 13 and 14 use assumptions about the components of population change (fertility, mortality, and international migration) to project the population by race and ethnic status from the revised Census 2000 population of 282.1 million forward to 2010, 2020, 2030, 2040, and 2050. To formulate these projections, the U.S. Census Bureau makes assumptions about levels of in-migration (both legal immigration and unauthorized in-migration) of the foreign born to the United States and about rates of emigration from the United States.
While there are always reporting errors and assumptions in official data relating to nationality, race, and ethnicity, the U.S. Census data are unique in providing a picture that is so historically rich and detailed.


- Biographies
- Baldwin, James
- Black Elk
- Boas, Franz
- Carmichael, Stokely
- Chávez, César
- Chin, Vincent
- Collins, Patricia Hill
- Deloria, Vine, Sr.
- Douglass, Frederick
- Drake, St. Clair
- Du Bois, William Edward Burghardt
- Fanon, Frantz
- Frazier, E. Franklin
- hooks, bell
- Huerta, Dolores
- Jackson, Jesse, Jr.
- Johnson, Charles S.
- King, Martin Luther, Jr.
- Kitano, Harry H. L.
- Lee, Spike
- Lincoln, Abraham
- Malcolm X
- Mandela, Nelson
- Marshall, Thurgood
- Newton, Huey
- Park, Robert E.
- Parks, Rosa
- Peltier, Leonard
- Robinson, Cedric
- Robinson, Jackie
- Samora, Julian
- Thorpe, Jim
- Truth, Sojourner
- Tubman, Harriet
- Washington, Booker T.
- Washington, Harold
- Wells-Barnett, Ida B.
- Williams, Fannie Barrier
- Wilson, William Julius
- Community and Urban Issues
- American Apartheid
- Colonias
- Gautreaux Decision
- Apartheid
- Asian Americans, New York City
- Barrio
- Black Metropolis
- Blockbusting
- Chicago School of Race Relations
- Chinatowns
- Code of the Street
- Colonialism
- Community Cohesion
- Community Empowerment
- Crown Heights, Brooklyn
- Culture of Poverty
- Discrimination in Housing
- East Harlem
- Ethnic Enclave, Economic Impact of
- Ethnic Succession
- Gangs
- Gentrification
- Ghetto
- Harlem
- Homelessness
- Housing Audits
- Hull House School of Race Relations
- Hurricane Katrina
- National Urban League
- Public Housing
- Redlining
- Resegregation
- School Desegregation
- Segregation
- Sundown Towns
- Urban Riots
- White Flight
- Zoot Suit Riots
- Concepts and Theories
- “Boat People”
- “Marielitos”
- “Us and Them”
- “Welfare Queen”
- “Wetbacks”
- Colonias
- Desi
- Hafu
- Hispanic Versus Latino
- Invisible Man
- La Raza
- Acculturation
- Afrocentricity
- Americanization
- Anti-Semitism
- Assimilation
- Asylum
- Authoritarian Personality
- Aztlán
- Barrio
- Black Bourgeoisie
- Black Nationalism
- Black Power
- Blockbusting
- Blood Quantum
- Body Image
- Boycott
- Brain Drain
- Caste
- Chinatowns
- Citizenship
- Civil Disobedience
- Civil Religion
- Code of the Street
- Colonialism
- Color Blindness
- Color Line
- Community Cohesion
- Community Empowerment
- Contact Hypothesis
- Cosmopolitanism
- Critical Race Theory
- Cultural Capital
- Cultural Relativism
- Culture of Poverty
- Deficit Model of Ethnicity
- Diaspora
- Digital Divide
- Dillingham Flaw
- Double Consciousness
- Environmental Justice
- Ethnic Enclave, Economic Impact of
- Ethnic Group
- Ethnic Succession
- Ethnicity, Negotiating
- Ethnocentrism
- Ethnonational Minorities
- Ethnoviolence
- Eugenics
- Familism
- Feminism
- Feminism, Black
- Feminism, Latina
- Genocide
- Gentrification
- Gerrymandering
- Ghetto
- Glass Ceiling
- Globalization
- Guest Workers
- Hapa
- Hate Crimes
- Hate Crimes in Canada
- Higher Education: Racial Battle Fatigue
- Holocaust
- Holocaust Deniers and Revisionists
- Homelessness
- Hourglass Economy
- Housing Audits
- Identity Politics
- Informal Economy
- Intercultural Communication
- Internal Colonialism
- Internalized Racism
- Internment Camps
- Islamophobia
- Jim Crow
- Kinship
- Kwanzaa
- Labeling
- Labor Market Segmentation
- Machismo
- Marginalization
- Marxism and Racism
- Melting Pot
- Minority/Majority
- Model Minority
- Multiracial Identity
- Native American Identity
- Nativism
- Nikkeijin
- Nisei
- One-Drop Rule
- Orientalism
- Pan-Asian Identity
- Pan-Indianism
- Panethnic Identity
- People of Color
- Peoplehood
- Pipeline
- Pluralism
- Political Economy
- Privilege
- Race
- Race, Social Construction of
- Racetalk
- Racial Formation
- Racial Identity
- Racial Identity Development
- Racial Profiling
- Racialization
- Racism
- Racism, Aversive
- Racism, Cultural
- Racism, Unintentional
- Red Power
- Redlining
- Refugees
- Remittances
- Resegregation
- Restrictive Covenants
- Return Migration
- Reverse Discrimination
- Rites of Passage
- Sacred Versus Secular
- Sansei
- Scapegoats
- Segregation
- Self-Fulfilling Prophecy
- Separate but Equal
- Sexual Harassment
- Social Capital
- Social Darwinism
- Social Distance
- Sovereignty, Native American
- Spanglish
- Split Labor Market
- Stereotype Threat
- Stereotypes
- Sundown Towns
- Symbolic Ethnicity
- Symbolic Religiosity
- Talented Tenth
- Third-Generation Principle
- Tracking
- Transnational People
- Underclass
- Urban Legends
- Veil
- Victim Discounting
- Victimization
- WASP
- White Flight
- White Privilege
- White Racism
- Whiteness
- Xenophobia
- Criminal Justice
- Apartheid, Laws
- Crime and Race
- Criminal Processing
- Death Penalty
- Deviance and Race
- Drug Use
- Gangs
- Hate Crimes
- Hate Crimes, Canada
- Homicide
- Incarcerated Parents
- Internment Camps
- Jim Crow
- Juvenile Justice
- Labeling
- Lynching
- Pachucos/Pachucas
- PATRIOT Act of 2001
- Police
- Prisons
- Racial Profiling
- Victim Discounting
- Victimization
- Economics and Stratification
- “Welfare Queen”
- Declining Significance of Race, The
- Affirmative Action in the Workplace
- Alien Land Acts
- Americans with Disabilities Act
- Apartheid
- Barrio
- Black Bourgeoisie
- Black Enterprise
- Black Power
- Boycott
- Bracero Program
- Brain Drain
- Caste
- Colonialism
- Color Line
- Culture of Poverty
- Digital Divide
- Discrimination
- Discrimination in Housing
- Discrimination, Environmental Hazards
- Discrimination, Measuring
- Domestic Work
- Double Consciousness
- Environmental Justice
- Equal Employment Opportunity Commission (EEOC)
- FUBU Company
- Gaming, Native American
- Gentrification
- Ghetto
- Glass Ceiling
- Globalization
- Guest Workers
- Health Disparities
- Homelessness
- Hourglass Economy
- Indian Gaming Regulatory Act of 1988
- Informal Economy
- Institutional Discrimination
- Internal Colonialism
- Labor Market Segmentation
- Labor Unions
- Maquiladoras
- Marxism and Racism
- Model Minority
- Operation Bootstrap
- Political Economy
- Public Housing
- Redlining
- Remittances
- Reparations, Slavery
- Repatriation of Mexican Americans
- Resegregation
- Reservation System
- Restrictive Covenants
- Return Migration
- Social Capital
- Social Darwinism
- Social Inequality
- Social Mobility
- Split-Labor Market
- Talented Tenth
- Transnational People
- Underclass
- Water Rights
- Wealth Distribution
- Welfare Reform
- Education
- Bell Curve, The
- Brown v. Board of Education
- Cisneros v. Corpus Christi School District
- Grutter v. Bollinger
- Hernandez v. Texas
- San Antonio Independent School District v. Rodriguez
- United States v. Fordice
- Affirmative Action in Education
- African American Studies
- Afrocentricity
- Antiracist Education
- Asian American Studies
- Asian American Studies, Mixed-Heritage
- Bilingual Education
- Biomedicine, African Americans and
- Black Intellectuals
- Brain Drain
- Chicago School of Race Relations
- Child Development
- Cultural Capital
- Digital Divide
- Discrimination
- Educational Performance and Attainment
- Educational Stratification
- English Immersion
- Fraternities and Sororities
- Head Start and Immigrants
- Higher Education
- Higher Education: Racial Battle Fatigue
- Hull House School of Race Relations
- Individuals with Disabilities Education Act of 1990
- Intelligence Tests
- Intercultural Communication
- Latina/o Studies
- Mexican American Legal Defense and Educational Fund (MALDEF)
- Model Minority
- Multicultural Education
- Native American Education
- Pipeline
- Resegregation
- Reverse Discrimination
- School Desegregation
- School Desegregation, Attitudes Concerning
- Science Faculties, Women of Color on
- Segregation
- Self-Fulfilling Prophecy
- Separate but Equal
- Social Capital
- Spanglish
- Talented Tenth
- Testing
- Title IX
- Tracking
- Gender and Family
- “Welfare Queen”
- Loving v. Virginia
- Abortion
- African American Women and Work
- African Americans, Migration of
- Aging
- Body Image
- Canada, Aboriginal Women
- Child Development
- Civil Rights Movement, Women and
- Culture of Poverty
- Domestic Violence
- Domestic Work
- Familism
- Family
- Feminism
- Feminism, Black
- Feminism, Latina
- Gender and Race, Intersection of
- Hip-Hop and Rap, Women and
- Homelessness
- Hull House School of Race Relations
- Immigration and Gender
- Incarcerated Parents
- Indian Child Welfare Act of 1978
- Institutional Discrimination
- Intermarriage
- Kinship
- Kwanzaa
- Leisure
- Lesbian, Gay, Bisexual, and Transgender
- Machismo
- Parenting
- Rites of Passage
- Science Faculties, Women of Color on
- Sexual Harassment
- Sexuality
- Social Support
- Social Work
- Title IX
- Transracial Adoption
- Veil
- Welfare Reform
- Whiteness and Masculinity
- Global Perspectives
- Burakumin
- Hafu
- Apartheid
- Apartheid, Laws
- Argentina
- Asylum
- Australia
- Australia, Indigenous People
- Back to Africa Monument
- Balkans
- Belize
- Borderlands
- Bracero Program
- Brain Drain
- Brazil
- Britain's Irish
- Canada
- Canada, Aboriginal Women
- Canada, First Nations
- Cape Verde
- Caribbean
- Caste
- China
- Citizenship
- Colombia
- Colonialism
- Cosmopolitanism
- Creole
- Cross-Frontier Contacts
- Cuba
- Cuba: Migration and Demography
- Diaspora
- Dillingham Flaw
- Dominican Republic
- Ethnic Conflict
- Ethnocentrism
- Ethnonational Minorities
- Europe
- Foreign Students
- France
- Genocide
- Global Perspectives
- Globalization
- Guest Workers
- Haiti
- Hate Crimes in Canada
- Hawai'i, Race in
- Holocaust
- Holocaust Deniers and Revisionists
- Hong Kong
- India
- Intercultural Communication
- International Convention on the Elimination of All Forms of Racial Discrimination
- Ireland
- Jamaica
- Japan
- Kenya
- Latin America, Indigenous People
- London Bombing (July 7, 2005)
- Maquiladoras
- Marxism and Racism
- Mexico
- Muslims in Canada
- Muslims in Europe
- Nigeria
- Nikkeijin
- Northern Island, Racism in
- Orientalism
- Peru
- Puerto Rico
- Race, Comparative Perspectives
- Race, UNESCO Statements on
- Racism
- Refugees
- Remittances
- Roma
- Russia
- Sami
- Santería
- Singapore
- South Africa, Republic of
- Taiwan
- Transnational People
- Trinidad
- Turkey
- United Kingdom
- Veil
- Xenophobia
- Zapatista Rebellion
- Zimbabwe
- Zionism
- Health and Social Welfare
- “Welfare Queen”
- Abortion
- Adoption
- Aging
- Americans with Disabilities Act
- Biomedicine, African Americans and
- Body Image
- Census, U.S.
- Child Development
- Cuba: Migration and Demography
- Discrimination, Environmental
- Drug Use
- Environmental Justice
- Eugenics
- Familism
- Family
- Health Disparities
- Health, Immigrant
- HIV/AIDS
- Hurricane Katrina
- Indian Child Welfare Act of 1978
- Individuals with Disabilities Education Act of 1990
- Leisure
- Life Expectancy
- Medical Experimentation
- Native American Health Care
- Native Americans, Environment and
- Social Support
- Social Work
- Welfare Reform
- Immigration and Citizenship
- “Boat People”
- “Marielitos”
- “Wetbacks”
- Colonias
- Acculturation
- Alien Land Acts
- Americanization
- Assimilation
- Asylum
- Bilingual Education
- Border Patrol
- Borderlands
- Brain Drain
- Chinese Exclusion Act
- Citizenship
- Colonialism
- Cosmopolitanism
- Cross-Frontier Contacts
- Dawes Act of 1887
- Deficit Model of Ethnicity
- Diaspora
- Dillingham Flaw
- Domestic Work
- English Immersion
- Ethnic Enclave, Economic Impact of
- Ethnic Succession
- Ethnonational Minorities
- Foreign Students
- Gentlemen's Agreement (1907–1908)
- Guest Workers
- Haitian and Cuban Immigrations: A Comparison
- Head Start and Immigrants
- Health, Immigrant
- Illegal Immigration Reform and Immigrant Responsibility Act of 1996
- Immigrant Communities
- Immigration and Gender
- Immigration and Nationality Act of 1965
- Immigration and Naturalization Service (INS)
- Immigration and Race
- Immigration Reform and Control Act of 1986
- Immigration, Economic Impact of
- Immigration, U.S.
- McCarran-Walter Act of 1952
- Minority Rights
- National Origins Systems
- Operation Bootstrap
- PATRIOT Act of 2001
- Proposition 187
- Refugees
- Remittances
- Repatriation of Mexican Americans
- Return Migration
- Symbolic Ethnicity
- Third-Generation Principle
- Transnational People
- Voting Rights
- Xenophobia
- Legislation, Court Decisions, and Treaties
- Brown v. Board of Education
- Cisneros v. Corpus Christi School District
- Dred Scott v. Sandford
- Gautreaux Decision
- Grutter v. Bollinger
- Hernandez v. Texas
- Loving v. Virginia
- Plessy v. Ferguson
- San Antonio Independent School District v. Rodriguez
- United States v. Fordice
- Alaska Natives, Legislation Concerning
- Alien Land Acts
- Americans with Disabilities Act
- Apartheid, Laws
- Blockbusting
- Bureau of Indian Affairs
- Chinese Exclusion Act
- Dawes Act of 1887
- Dillingham Flaw
- Emancipation Proclamation
- Gentlemen's Agreement (1907–1908)
- Illegal Immigration Reform and Immigrant Responsibility Act of 1996
- Immigration and Nationality Act of 1965
- Immigration Reform and Control Act of 1986
- Indian Child Welfare Act of 1978
- Indian Gaming and Regulatory Act of 1988
- Individuals with Disabilities Education Act of 1990
- McCarran-Walter Act of 1952
- Native American Graves Protection and Repatriation Act of 1990
- Native American Identity, Legal Background
- Operation Bootstrap
- PATRIOT Act of 2001
- Proposition 187
- Repatriation of Mexican Americans
- Separate but Equal
- Title IX
- Trail of Broken Treaties
- Treaty of Guadalupe Hidalgo (1848)
- Voting Rights
- Media, Sports, and Entertainment
- Organizations
- American Indian Movement
- American Jewish Committee
- Anti-Defamation League
- ASPIRA
- Back to Africa Movement
- Black Panther Party
- Brown Berets
- Bureau of Indian Affairs
- Census, U.S.
- Chicago Movement
- Congress of Racial Equality (CORE)
- Father Divine Peace Mission Movement
- Fraternities and Sororities
- Gangs
- Japanese American Citizens League
- Ku Klux Klan
- La Raza Unida Party
- Labor Unions
- Mexican American Legal Defense and Educational Fund (MALDEF)
- Nation of Islam
- National Association for the Advancement of Colored People (NAACP)
- National Congress of American Indians
- National Council of La Raza
- National Indian Youth Council
- National Rainbow Coalition
- National Urban League
- Operation PUSH
- Pachucos/Pachucas
- Puerto Rican Armed Forces of National Liberation (FALN)
- Puerto Rican Legal Defense and Education Fund
- Religion, Minority
- Southern Christian Leadership Council (SCLC)
- Student Nonviolent Coordinating Committee (SNCC)
- Young Lords
- Prejudice and Discrimination
- “Us and Them”
- “Welfare Queen”
- American Apartheid
- American Dilemma, An
- Birth of a Nation, The
- Invisible Man
- Affirmative Action in Education
- Affirmative Action in the Workplace
- Anti-Semitism
- Antiracist Education
- Apartheid
- Authoritarian Personality
- Aztlán
- Black Metropolis
- Body Image
- Civil Rights Movement
- Civil Rights Movement, Women and
- Colonialism
- Color Line
- Contact Hypothesis
- Crime and Race
- Critical Race Theory
- Deficit Model of Ethnicity
- Discrimination
- Discrimination in Housing
- Discrimination, Environmental Hazards
- Discrimination, Measuring
- Double Consciousness
- Environmental Justice
- Ethnic Conflict
- Eugenics
- Hate Crimes
- Hate Crimes in Canada
- Health Disparities
- Higher Education: Racial Battle Fatigue
- Holocaust Deniers and Revisionists
- Housing Audits
- Immigration and Race
- Institutional Discrimination
- Intelligence Tests
- Intergroup Relations, Surveying
- Internal Colonialism
- Internalized Racism
- International Convention on the Elimination of All Forms of Racial Discrimination
- Interracial Friendships
- Jim Crow
- Ku Klux Klan
- Labeling
- Lynching
- Marginalization
- Marxism and Racism
- Medical Experimentation
- Military and Race
- Minority Rights
- Nativism
- Orientalism
- Popular Culture, Racism and
- Prejudice
- Privilege
- Racial Profiling
- Racialization
- Racism
- Racism, Aversive
- Racism, Cultural
- Racism, Types of
- Racism, Unintentional
- Racism, White
- Reparations, Slavery
- Reverse Discrimination
- Robbers Cave Experiment
- Scapegoats
- Segregation
- Self-Fulfilling Prophecy
- Slavery
- Social Darwinism
- Social Distance
- Social Inequality
- Stereotype Threat
- Stereotypes
- Sundown Towns
- White Supremacy Movement
- Whiteness
- Whiteness and Masculinity
- Whiteness, Measuring
- Xenophobia
- Public Policy
- American Apartheid
- American Dilemma, An
- Gautreaux Decision
- Abortion
- Affirmative Action in Education
- Affirmative Action in the Workplace
- Apartheid, Laws
- Asylum
- Bilingual Education
- Black Conservatives
- Black Metropolis
- Blockbusting
- Census, U.S.
- Citizenship
- Civil Disobedience
- Civil Rights Movement
- Community Empowerment
- Criminal Processing
- Death Penalty
- Digital Divide
- Equal Employment Opportunity Commission (EEOC)
- Gerrymandering
- Hate Crimes
- Health Disparities
- Homelessness
- Housing Audits
- Hurricane Katrina
- Intelligence Tests
- Juvenile Justice
- Ku Klux Klan
- Labor Unions
- Lynching
- Marginalization
- Marxism and Racism
- Medical Experimentation
- Native Americans, Environment and
- Nativism
- Orientalism
- Political Economy
- Proposition 187
- Public Housing
- Racial Profiling
- Redlining
- Refugees
- Reparations, Slavery
- Reverse Discrimination
- Segregation
- Self-Fulfilling Prophecy
- Separate but Equal
- Sexual Harassment
- Slavery
- Sovereignty, Native American
- Testing
- Title IX
- Voting Rights
- White Supremacy Movement
- Racial, Ethnic, and Nationality Groups
- Burakumin
- Desi
- Afghan Americans
- African Americans
- Africans in the United States
- Albanian Americans
- Aleuts
- Amish
- Arab Americans
- Armenian Americans
- Asian Americans
- Assyrian Americans
- Australia, Indigenous People
- Bangladeshi Americans
- Belgian Americans
- Blackfeet
- Bosnian Americans
- Brazilian Americans
- Britain's Irish
- Bulgarian Americans
- Cambodian Americans
- Canada, First Nations
- Canadian Americans
- Caribbean Americans
- Central Americans in the United States
- Cherokee
- Cheyenne
- Chinese Americans
- Choctaw
- Creole
- Croatian Americans
- Cuban Americans
- Cypriot Americans
- Czech Americans
- Danish Americans
- Dominican Americans
- Dutch Americans
- Egyptian Americans
- Estonian Americans
- Filipino Americans
- Finnish Americans
- French Americans
- Georgian Americans
- German Americans
- Greek Americans
- Guatemalan Americans
- Haitian Americans
- Haole
- Hawaiians
- Hispanics
- Hmong Americans
- Honduran Americans
- Hopi
- Hungarian Americans
- Hutterites
- Icelandic Americans
- Indian Americans
- Indonesian Americans
- Iranian Americans
- Iraqi Americans
- Irish Americans
- Issei
- Italian Americans
- Jamaican Americans
- Japanese Americans
- Jewish Americans
- Jewry, Black American
- Jordanian Americans
- Korean Americans
- Kurdish Americans
- Laotian Americans
- Latin America, Indigenous People
- Latvian Americans
- Lebanese Americans
- Lithuanian Americans
- Mennonites
- Menominee
- Mexican Americans
- Muslim Americans
- Myanmarese Americans
- Native Americans
- Navajo
- Nicaraguan Americans
- Nigerian Americans
- Nisei
- Norwegian Americans
- Ojibwa
- Pacific Islanders
- Pakistani Americans
- Palestinian Americans
- Panamanian Americans
- Peruvian Americans
- Polish Americans
- Portuguese Americans
- Pueblos
- Puerto Rican Americans
- Roma
- Romanian Americans
- Salvadoran Americans
- Sami
- Samoan Americans
- Sansei
- Schmiedeleut
- Serbian Americans
- Sicilian Americans
- Sioux
- Slovak Americans
- Slovene Americans
- South Americans in the United States
- Spanish Americans
- Sri Lankan Americans
- Swedish Americans
- Syrian Americans
- Thai Americans
- Tibetan Americans
- Tlingit
- Tongan Americans
- Turkish Americans
- Ugandan Americans
- Ukrainian Americans
- United Kingdom, Immigrants and Their Descendants in the United States
- Vietnamese Americans
- West Indian Americans
- Religion
- Amish
- Civil Religion
- Father Divine Peace Mission Movement
- Hutterites
- Islamophobia
- Jewish Americans
- Jewry, Black American
- Mennonites
- Mormons, Race and
- Muslim Americans
- Muslims in Canada
- Muslims in Europe
- Nation of Islam
- Native American Graves Protection and Repatriation Act of 1990
- Peyote
- Religion
- Religion, African Americans
- Religion, Minority
- Religious Freedom Restoration Act of 1993
- Religious Movements, New
- Roman Catholics
- Sacred Sites, Native Americans
- Sacred Versus Secular
- Santería
- Schmeideleut
- Southern Christian Leadership Council (SCLC)
- Symbolic Religiosity
- Veil
- Sociopolitical Movements and Conflicts
- La Raza
- Abolitionism: The Movement
- Abolitionism: The People
- African Americans, Migration of
- Alamo, The
- American Indian Movement
- ASPIRA
- Aztlán
- Back to Africa Movement
- Black Nationalism
- Black Panther Party
- Black Power
- Boycott
- Brown Berets
- Chicano Movement
- Civil Disobedience
- Civil Rights Movement
- Civil Rights Movement, Women and
- Cross-Frontier Contacts
- Crown Heights, Brooklyn
- Environmental Justice
- Father Divine Peace Mission Movement
- Feminism
- Feminism, Black
- Feminism, Latina
- Harlem Renaissance
- Jewish-Black Relations: A Historical Perspective
- Jewish-Black Relations: The Contemporary Period
- Kennewick Man
- Ku Klux Klan
- La Raza Unida Party
- London Bombings (July 7, 2005)
- Military and Race
- Multicultural Social Movements
- Nation of Islam
- Puerto Rican Armed Forces of National Liberation (FALN)
- Red Power
- Sand Creek Massacre
- Sovereignty, Native American
- Terrorism
- Trail of Broken Treaties
- Voting Rights
- Water Rights
- White Supremacy Movement
- Wounded Knee (1890 and 1973)
- Young Lords
- Zapatista Rebellion
- Zionism
- Zoot Suit Riots
- Loading...
Get a 30 day FREE TRIAL
-
 Watch videos from a variety of sources bringing classroom topics to life
 -
Read modern, diverse business cases
-
Explore hundreds of books and reference titles
Read next

More like this
Sage Recommends
We found other relevant content for you on other Sage platforms.
Have you created a personal profile? Login or create a profile so that you can save clips, playlists and searches