
Entry
Reader's guide
Entries A-Z
Subject index
Percentile Rank
There are many ways to measure and evaluate things, but one of the most common is by comparison. Percentile ranks indicate the percentage of scores lower than any given value on a scale from 1–99. For example, if 100 students took a history test, a percentile rank of 36 would mean that the student's score was better than that of 36 other students. If 200 students had taken the test, a percentile rank of 36 would indicate that the student had scored higher than 72 others.
Percentile ranks are based on cumulative frequencies, which are the number of scores equal to or less than a given value. Cumulative frequencies are found by placing all of the scores in order from lowest to highest and adding the number of scores (i.e., frequency) for each score or range of scores beginning with the smallest. To illustrate, Table 1 (which is the basis for the example illustrating the procedure outlined below) shows a simple frequency distribution (a display of the number of occurrences of each of the scores) for 50 people on a test with 20 questions. In the first three columns, X indicates the value of the scores, f is the frequency of each score, and cf is the cumulative frequency. Thus, you can see that 3 people answered 8 questions correctly, and a total of 18 people answered 8 or fewer questions correctly (i.e., the cumulative frequency, cf, for X = 8 is 18).
Calculation of Percentile Ranks in Simple Frequency Distributions
Calculation of percentile ranks (PR) in a simple frequency distribution is based on the assumption that each score is the midpoint of a range of possible scores (e.g., for X = 8, the interval from 7.5 to 8.5). Finding the percentile rank of a score thus involves finding the cumulative frequency for the midpoint of the interval (cfmp) corresponding to the score of interest and involves the following steps:
| Table 1 Percentile Ranks for Scores in a Simple Frequency Distribution | |||||
|---|---|---|---|---|---|
| X | f | cf | cfmp | cfmp/F | PR |
| 20 | 1 | 50 | 49.5 | 0.99 | 99 |
| 19 | 1 | 49 | 48.5 | 0.97 | 97 |
| 18 | 2 | 48 | 47 | 0.94 | 94 |
| 17 | 0 | 46 | 46 | 0.92 | 92 |
| 16 | 1 | 46 | 45.5 | 0.91 | 91 |
| 15 | 0 | 45 | 45 | 0.90 | 90 |
| 14 | 3 | 45 | 43.5 | 0.87 | 87 |
| 13 | 2 | 42 | 41 | 0.82 | 82 |
| 12 | 5 | 40 | 37.5 | 0.75 | 75 |
| 11 | 7 | 35 | 31.5 | 0.63 | 63 |
| 10 | 6 | 28 | 25 | 0.50 | 50 |
| 9 | 4 | 22 | 20 | 0.40 | 40 |
| 8 | 3 | 18 | 16.5 | 0.33 | 33 |
| 7 | 5 | 15 | 12.5 | 0.25 | 25 |
| 6 | 2 | 10 | 9 | 0.18 | 18 |
| 5 | 4 | 8 | 6 | 0.12 | 12 |
| 4 | 2 | 4 | 3 | 0.06 | 6 |
| 3 | 1 | 2 | 1.5 | 0.03 | 3 |
| 2 | 0 | 1 | 1 | 0.02 | 2 |
| 1 | 1 | 1 | 0.5 | 0.01 | 1 |
| 0 | 0 | 0 | 0 | 0 | 1 |
Find the cumulative frequency for the midpoint of the interval (cfmp) of the score of interest by averaging the cumulative frequency of the score with the cumulative frequency of the score below it. For example, for X = 8 in Table 1,

Divide the cfmp by the total frequency (F) of the distribution. Thus, for X = 8,
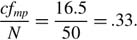
- Multiply the resulting proportion by 100 and round to the nearest whole number to find the percentile rank (e.g., 0.33 × 100 = 33).
For ease of computation, the formula that summarizes this procedure (in which N is the total number of scores) can be simplified as follows:
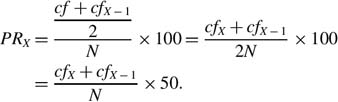
In Table 1, note that the percentile ranks of scores of both 0 and 1 are shown as 1, even though no one received a score lower than 1. This is true because by convention, percentile ranks are reported on a scale from 1–99.
Calculation of Percentile Ranks in Grouped Frequency Distributions
When frequencies are reported in tables with intervals greater than one (sometimes referred to as grouped frequency distributions), percentile ranks are estimated based on the assumption that the scores are evenly distributed throughout the interval. For example, Table 2 is an excerpt from a frequency distribution of 200 scores on a 100-point scale. Although the intervals typically are depicted using whole numbers (e.g., 61–65), this is shorthand for intervals that extend beyond the values shown to their real limits (i.e., 60.5–65.5). The computational formula for percentile rank of a score (PRX)
...
- Classroom Achievement
- Acceleration
- Alternative Academic Assessment
- Bell Curve
- Direct Instruction
- Educational Technology
- Failure, Effects of
- Gifted and Talented Students
- Goals
- Grade Retention
- Grading
- Halo Effect
- Home Environment and Academic Intrinsic Motivation
- Homework
- Intelligence and Intellectual Development
- Intelligence Quotient (IQ)
- Intelligence Tests
- Literacy
- Media Literacy
- Parental Expectations
- Personalized System of Instruction
- Precision Teaching
- Reading Comprehension Strategies
- Rubrics
- Spelling
- Test Anxiety
- Classroom Management
- Calculator Use
- Cheating
- Contingency Contracts
- Cooperative Learning
- Curriculum Development
- Discovery Learning
- Distance Learning
- Early Intervention Programs
- Educational Technology
- Effective Teaching, Characteristics of
- Mainstreaming
- Montessori Schools
- School Design
- School Resources
- Students' Rights
- Time-Out
- Token Reinforcement Programs
- Virtual Schools
- Vocational Education
- Cognitive Development
- Cognitive Development and School Readiness
- Conservation
- Deductive Reasoning
- Egocentrism
- Equilibration
- Field Independence–Field Dependence
- Flashbulb Memories, the Nature of
- Inductive Reasoning
- Intelligence and Intellectual Development
- Literacy
- Long-Term Memory
- Measurement and Cognitive Development
- Metacognition and Learning
- Moral Development
- Motivation and Emotion
- Object Permanence
- Perceptual Development
- Piaget's Theory of Cognitive Development
- Schemas
- Short-Term Memory
- Spelling
- Vygotsky's Cultural-Historical Theory of Development
- Zone of Proximal Development
- Ethnicity, Race, and Culture
- African Americans
- American Indians and Alaska Natives
- Asian Americans
- Bilingual Education
- Bilingualism
- Communication Disorders
- Cultural Deficit Model
- Cultural Diversity
- Culture
- Diversity
- Ethnicity and Race
- Head Start
- Hispanic Americans
- Identity Development
- Immigration
- Multicultural Classrooms
- Multicultural Education
- Families
- Gender and Gender Development
- Health and Well-Being
- Abstinence Education
- Athletics
- Attention Deficit Hyperactivity Disorder
- Autism Spectrum Disorders
- Behavior Disorders
- Brain-Relevant Education
- Communication Disorders
- Conduct Disorders
- Diagnostic and Statistical Manual of Mental Disorders
- Disabilities
- Drug Abuse
- Dyslexia
- Eating Disorders
- Extracurricular Activities
- HIV/AIDS
- Learning Disabilities
- Malnutrition and Development
- Mental Health Care in Schools
- Mental Retardation
- Obesity
- School Counseling
- Sex Education
- Special Education
- Suicide
- Human Development
- Acculturation
- Aggression
- Androgyny
- Anxiety
- Aptitude
- Athletics
- Attachment
- Attachment Disorder
- Autism Spectrum Disorders
- Behavior Disorders
- Creativity
- Early Intervention Programs
- Egocentrism
- Emotion and Memory
- Emotional Development
- Empathy
- Equilibration
- Erikson's Theory of Psychosocial Development
- Extracurricular Activities
- Friendship
- Gifted and Talented Students
- Head Start
- Identity Development
- Individual Differences
- Individuals with Disabilities Education Act
- Intelligence and Intellectual Development
- Intrinsic versus Extrinsic Motivation
- Kohlberg's Stages of Moral Development
- Mainstreaming
- Maslow's Hierarchy of Basic Needs
- Maturation
- Mental Retardation
- Metacognition and Learning
- Moral Development
- Motivation
- Motivation and Emotion
- Motor Development
- Myelination
- Neuroscience
- Peer Influences
- Perceptual Development
- Physical Development
- Piaget's Theory of Cognitive Development
- Risk Factors and Development
- School Violence and Disruption
- Self-Determination
- Self-Efficacy
- Self-Esteem
- Special Education
- Test Anxiety
- Vygotsky's Cultural-Historical Theory of Development
- Intelligence and Intellectual Development
- Language Development
- Learning and Memory
- Adult Learning
- Assistive Technology
- Aversive Stimuli
- Behavior Modification
- Bloom's Taxonomy of Educational Objectives
- Brain-Relevant Education
- Classical Conditioning
- Cognitive and Cultural Styles
- Cognitive View of Learning
- Cooperative Learning
- Discovery Learning
- Discrimination
- Distance Learning
- Divergent Thinking
- Educational Technology
- Emotion and Memory
- Episodic Memory
- Explicit Memory
- Flashbulb Memories, the Nature of
- Habituation
- Intrinsic versus Extrinsic Motivation
- Learning
- Learning Communities
- Learning Disabilities
- Learning Strategies
- Learning Style
- Lifelong Learning
- Long-Term Memory
- Malnutrition and Development
- Maturation
- Memory
- Metacognition and Learning
- Mnemonics
- Motivation and Emotion
- Observational Learning
- Older Learners
- Operant Conditioning
- Peer-Assisted Learning
- Perceptual Development
- Premack Principle
- Reinforcement
- Rosenthal Effect
- Shaping
- Short-Term Memory
- Social Learning Theory
- Stimulus Control
- Working Memory
- Organizations
- Peers and Peer Influences
- Public Policy
- Abstinence Education
- Assistive Technology
- Bilingual Education
- Charter Schools
- Child Abuse
- Early Child Care and Education
- English as a Second Language
- Ethics and Research
- Gangs
- Grade Retention
- Head Start
- High-Stakes Testing
- Home Education
- Immigration
- Inclusion
- Individualized Education Program
- Individuals with Disabilities Education Act
- Institutional Review Boards
- Intelligence Tests
- Least Restrictive Placement
- Mainstreaming
- No Child Left Behind
- Poverty
- School Design
- School Violence and Disruption
- Sex Education
- Special Education
- Students' Rights
- Testing
- Tracking
- Vouchers
- Research Methods and Statistics
- T Scores
- Case Studies
- Confidence Interval
- Correlation
- Cross-Sectional Research
- Descriptive Statistics
- Ethics and Research
- Ethnography
- Experimental Design
- External Validity
- Field Experiments
- Frequency Distribution
- Generalizability Theory
- Inferential Statistics
- Internal Validity
- Longitudinal Research
- Mean
- Median
- Meta-Analysis
- Mode
- Naturalistic Observation
- Normal Curve
- Percentile Rank
- Qualitative Research Methods
- Quantitative Research Methods
- Random Sample
- Regression
- Scientific Method
- Standard Deviation and Variance
- Standard Scores
- Stanine Scores
- Statistical Significance
- Social Development
- Teaching
- Aptitude Tests
- Constructivism
- Contingency Contracts
- Criterion-Referenced Testing
- Curriculum Development
- Direct Instruction
- Educational Technology
- Effective Teaching, Characteristics of
- Emotion and Memory
- English as a Second Language
- Evaluation
- Expert Teachers
- Explicit Teaching
- Goals
- Grade Retention
- Grade-Equivalent Scores
- Grading
- Home Education
- Homework
- Instructional Objectives
- Learning Objectives
- Parent–Teacher Conferences
- Personalized System of Instruction
- PRAXIS™
- Precision Teaching
- Rubrics
- Scaffolding
- School Readiness
- Sex Education
- Students' Rights
- Teaching Strategies
- Tracking
- Testing, Measurement, and Evaluation
- Acceleration
- Alternative Academic Assessment
- Aptitude Tests
- Assessment
- Bell Curve
- Certification
- Criterion-Referenced Testing
- Essay Tests
- Evaluation
- External Validity
- Generalizability Theory
- Grade Retention
- Grade-Equivalent Scores
- Grading
- High-Stakes Testing
- Intelligence Tests
- Measurement
- Measurement of Cognitive Development
- Mental Age
- Multiple-Choice Tests
- Norm-Referenced Tests
- Percentile Rank
- Personality Tests
- Reliability
- Rubrics
- Standardized Tests
- Stanford–Binet Test
- Test Anxiety
- Testing
- Validity
- Theory
- Applied Behavior Analysis
- Behavior Modification
- Bloom's Taxonomy of Educational Objectives
- Classical Conditioning
- Cognitive Behavior Modification
- Cognitive View of Learning
- Constructivism
- Continuity and Discontinuity in Learning
- Cultural Deficit Model
- Dynamical Systems
- Erikson's Theory of Psychosocial Development
- Generalizability Theory
- Kohlberg's Stages of Moral Development
- Learned Helplessness
- Maslow's Hierarchy of Basic Needs
- Neuroscience
- Piaget's Theory of Cognitive Development
- Premack Principle
- Psychoanalytic Theory
- Psychosocial Development
- Reciprocal Determinism
- Rosenthal Effect
- Schemas
- Social Learning Theory
- Theory of Mind
- Vicarious Reinforcement
- Loading...
Get a 30 day FREE TRIAL
-
 Watch videos from a variety of sources bringing classroom topics to life
 -
Read modern, diverse business cases
-
Explore hundreds of books and reference titles

Read next

More like this
Sage Recommends
We found other relevant content for you on other Sage platforms.
Have you created a personal profile? Login or create a profile so that you can save clips, playlists and searches