Entry
Entries A-Z
Subject index
Structural Equation Modeling
The complex analysis of quantitative data in much contemporary education research and evaluation is conducted using structural equation models (SEM), also referred to as covariance structure analysis, covariance structure modeling, or analysis of covariance structures, which permit the simultaneous prediction of several outcome variables. Generally, this form of data analysis is undertaken using specialized statistical software, including the Statistical Analysis System (SAS, particularly PROC CALIS), EQS, M-PLUS, LISREL, and AMOS. SEM is appropriate when causal interpretations are desired, measuring the effects of exogenous variables (e.g., student demographic characteristics or parental socioeconomic status) on endogenous (dependent, or outcome) variables, such as student achievement, and the effects of endogenous variables on other endogenous variables. SEM analyses can be conducted for a single group (for example, all eighth-grade students in a district) or for subgroups to be able to make comparisons in model characteristics across groups (for example, comparing model results for male and female eighth graders).
In SEM, one equation is estimated for each dependent (endogenous) variable using predictors that can be exogenous (independent) or endogenous in another equation. The model estimates both the direct effects of independent variables on the endogenous variables and the indirect effects of independent variables mediated through other endogenous variables. Variables may be either observed, that is, already present in the data set, or latent, in which case the variable is constructed as a linear combination of observed variables through a process of confirmatory factor analysis. This combination of traits separates SEM from other linear models methods—simple and multiple regression and correlation, analysis of variance, analysis of covariance, and multivariate analysis of variance and covariance—and from other methods of simultaneous equation estimation used commonly in econometrics and related disciplines. SEM frequently is referred to as causal modeling, because it is used to rule out alternative explanations through complex combinations of variable paths. However, like other linear models methods, SEM results are sensitive to problems associated with lack of normality (particularly kurtosis), missing data, and outliers. Furthermore, it is highly debatable whether causation in the experimental science sense is achieved.
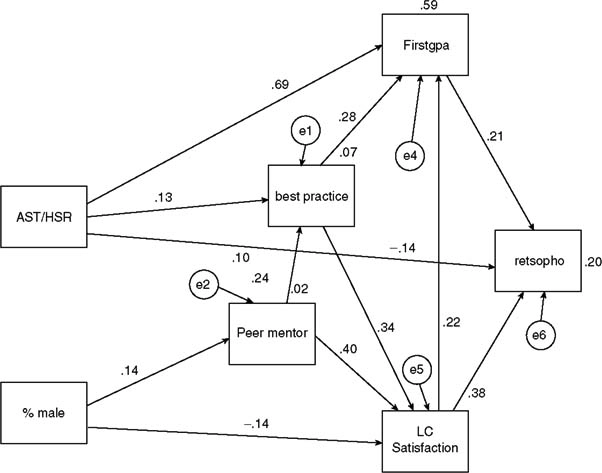
The most fundamental form of SEM is path analysis, in which all variables are observed and none are latent. An example from research on undergraduates at a research-extensive large Midwestern land grant institution is shown in Figure 1, where “ACT/HSR” denotes the average of standardized values for ACT composite score and high school rank, “%male” is the percentage of a learning team who are male, “best practice” denotes the mean factor score for student perceptions of the extent to which the learning team experienced best practices, “peer mentor” represents the mean factor score for student and learning community coordinator evaluation of team peer mentors, “firstgpa” is mean first-year cumulative grade point average for the team, “LC satisfaction” is mean learning team student satisfaction with their learning community experience, and “retsopho” measures the percentage of students in each learning team persisting to the second fall semester.
Figure 1. Effects of Learning Team Characteristics on First-Year Undergraduate Retention: Evidence From Structural Equation Models
...
- Loading...
Get a 30 day FREE TRIAL
-
 Watch videos from a variety of sources bringing classroom topics to life
 -
Read modern, diverse business cases
-
Explore hundreds of books and reference titles

Read next

More like this
Sage Recommends
We found other relevant content for you on other Sage platforms.
Have you created a personal profile? Login or create a profile so that you can save clips, playlists and searches