
Entry
Entries A-Z
Subject index
S-Curve Theory
The S-curve is a graphic of a frequency distribution that visualizes growth and change. The growth of most organisms follows an S-curve. Growth processes do not simply reach a limit and then stop. Instead, they often follow one of two configurations with respect to limits. The first is a pattern of exponential (even superexponential) growth up to a turning point and then a pattern of slowing growth. The pattern exhibits a slow-slow-quickquick-slow progression: an S-curve. When a young tree is very small, it tends to grow only a few inches each year, but as time passes, it accelerates in both height and girth, until it reaches its natural limit, declines, and dies.
The second growth pattern also resembles an S-curve, but it extends the upward growth by tracing another S-curve back down. The overall pattern becomes a bell-shaped curve and may indicate the phenomenon of overshoot and decline. An example might be population growth in many historic empires. The failing empires outgrow their capacity to provide food or energy and subsequently break down.
These generic patterns of growth were adopted in social science research to frame the diffusion of innovation theory. The French sociologist, Gabriel Tarde, carried out the original diffusion research in 1903 and plotted the S-shaped curve. Modern diffusion research is traceable to the 1943 study by two sociologists, Bruce Ryan and Neal Gross, of the diffusion of hybrid corn among Iowa farmers. Everett M. Rogers, more than any other individual, has been responsible for synthesizing the theories and findings of diffusion research and formulating a unified theory. Rogers discusses four prominent theories of diffusion. His rate of adoption theory concerns us here. This theory visualizes the pattern of the adoption of an innovation as an S-shaped curve, with potential for stabilization and/or ultimate decline.
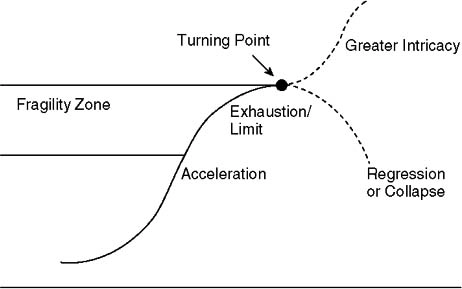
Figure 1 displays a typical S-curve for the adoption of an innovation. The simple S-curve, however, is an incomplete view of the process. It is more helpful to think of the “S” in terms of Hughes's second growth pattern as the front half of a “bell-shaped” curve. The “S” outlines the developmental stages of the change, but the process can easily revert at the “turning point” when operational or ideological doubt sets in. An educational change process would start with innovators, often aided by formal change agents, and progress through a period of acceleration and rapid growth when the early and late majorities join the process, to a period of saturation—stabilization or exhaustion—when only the laggards remain to be converted. At this point, if a school staff is able to reenergize the process—deal with the increasing complexity and reinforce existing commitments—the innovation will likely succeed. If not, the process will shrink to safe levels or finally collapse.
Figure 1. Innovation Adoption Curve
- at-risk students
- chaos theory
- ethos, of organizations
- instructional interventions
- leadership, theories of
- leadership styles
- learning, theories of
- learning environments
- problem solving
- psychology, types of
- psychometrics
- research methods
- standardized testing
- testing and test theory development
- underachievers, in schools
- validity and reliability
- variables
Further Readings and References
...
- Loading...
Get a 30 day FREE TRIAL
-
 Watch videos from a variety of sources bringing classroom topics to life
 -
Read modern, diverse business cases
-
Explore hundreds of books and reference titles

Read next

More like this
Sage Recommends
We found other relevant content for you on other Sage platforms.
Have you created a personal profile? Login or create a profile so that you can save clips, playlists and searches