
Entry
Entries A-Z
Subject index
J-Curve Theory
The J-curve is a graphic of a frequency distribution that visualizes change process, growth, or achievement. The J-curve most often is used to represent what happens when change is introduced into a relatively stable or traditional system. Participants in stable or traditional organizations may range from those who want no change of any kind to those who feel that drastic change is needed. In a school, the reasons for change might range from mandated programs from the district or the demand from the state to raise low or falling standardized test scores to the desire of the school staff to implement an academic program that is more responsive to the needs of all the students in the school.
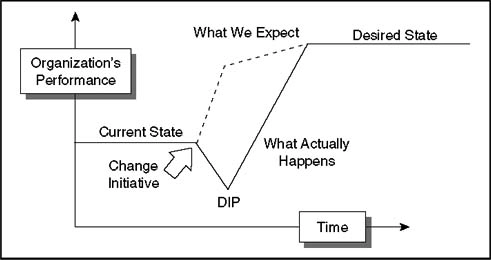
The J-curve (see Figure 1) characterizes what happens to an organization when unrealistic expectations impede a planned change effort. The program may run into serious community opposition or lack of teacher support or budgetary shortcomings or any of the other countless obstacles that can slow or kill a comprehensive change effort or even a single program. The change initiative hits what Michael Fullan calls the “implementation dip” and Karl Albrecht calls the “valley of despair.” Things go down rather than up because the existing culture of the organization has been disturbed. The change effort could well fail at this point as change-induced frustration and instability make apparent the gap between expectations and results. On the other hand, as Albrecht tells us, a change's sponsor, if using realistic expectations and an understanding of the J-curve, can successfully emerge from the valley of despair. David Viney suggests that management can survive the dip by pursuing three key aims: managing expectations, minimizing the depth of the dip, and making sure you surface again.
Figure 1. The J-Curve
The J-curve also has been used to measure highly skewed distributions of conforming behavior, such as religious commitment or driver stopping habits at stop signs, and exponential growth where, after a slow start, the pace of change is very rapid, like the growth of bacteria in a culture. In education, a distribution of scores on a test that is very easy or very difficult would result in a J-curve. Such a test would be easy, of course, if all students were well prepared to take it. Here the J-curve would represent, according to “Word Spy” in 2004, grade distribution in an educational system built upon the belief that most students can succeed. Most students in this kind of school would occupy the rising part of the curve, not the center of a normal distribution (bell curve). Indeed, J-curve adherents labor to change the system until most students are learning at a high level. The J-curve belief is that achievement is a function of time and motivation.
- at-risk students
- conditioning theory
- ethos, of organizations
- instructional interventions
- intelligence
- learning, theories of
- learning environments
- locus of control
- problem solving
- psychology, types of
- psychometrics
- research methods
- standardized testing
- testing and test theory development
- underachievers, in schools
- validity and reliability
- variables
Further Readings and References
...
- Loading...
Get a 30 day FREE TRIAL
-
 Watch videos from a variety of sources bringing classroom topics to life
 -
Read modern, diverse business cases
-
Explore hundreds of books and reference titles

Read next

More like this
Sage Recommends
We found other relevant content for you on other Sage platforms.
Have you created a personal profile? Login or create a profile so that you can save clips, playlists and searches