Entry
Reader's guide
Entries A-Z
Subject index
Trend Lines
Trend lines, also called lines of progress or celeration lines, are drawn through charted data to summarize the relationship between two variables. The two variables usually represent changes in performance over time (see Figure 1, panels A and B), but the relationship between any two variables can be summarized with trend lines (panels C and D). Trend lines have been used to describe patterns within phases of a study and to predict values beyond the immediate data set (panels A and B). Because accepted “theoretical” or “mathematical” justifications do not exist for predicting values (extrapolating) beyond the data set used to estimate the trend, experience and empirically demonstrated success must be used in deciding whether the data are orderly enough to warrant predictions.
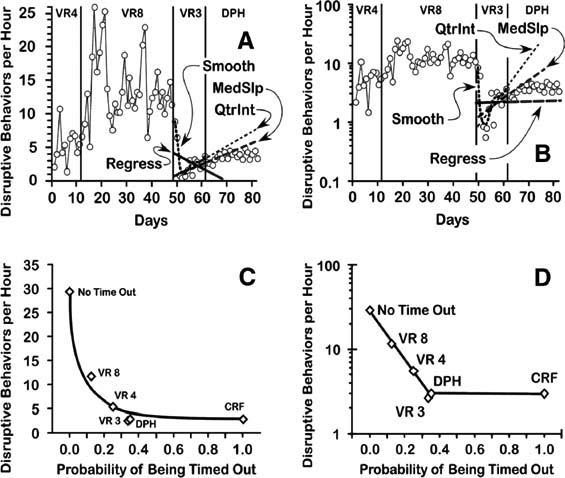
Figure 1 Examples of Trend Lines
Note: Panel A: Equal interval chart of an individual's disruptive behaviors under various schedules of time-out. DPH indicates disruptions per hour; MedSlp, median slope; QtrInt, use of the quarterintersect method; Smooth, use of the smoothing method. Panel B: The same individual's record presented on a ratio (semilogarithmic) chart. The various trend lines labeled in Panel B refer to the data in phase 3–VR3. Panel C: Free-hand curvilinear trend drawn through mean rates of disruptions as a function of the probability of being timed out. CRF indicates continuous reinforcement; VR, variable ratio. Panel D: The same means presented on a ratio chart, described with phase detail, using two straight-line trends.
General Approaches for Estimating Trends
Approaches used to estimate trends differ primarily in whether they attempt to describe a trend using straight lines or curves and whether they employ a freehand method or are based on mathematical models.
Describing Trends as Straight Lines
The following methods are generally based on the assumption that the overall trend in the data is best described by a simple linear (straight-line) function.
Freehand or Focus. The freehand method relies on simple visual inspection of the data. The process of finding an appropriate line can be “focused” by imposing a straight line over the data (perhaps printed on a plastic sheet), then moving the line up and down at different angles until what appears to be a satisfactory solution has been found. An attempt is usually made to find a line that evenly divides the data on or above the line (or on or below the line). The freehand method can also be used to draw curved lines through the data when a straight-line solution appears inappropriate. In such a case, a straight-line “focusing aid” can still be helpful by highlighting patterns in the data that deviate from a straightline model.
The freehand method allows the analyst to take into consideration factors (such as common patterns of learning) that might be overlooked by more explicit mathematical models. Several studies suggest that the freehand method can be faster to employ and more accurate in predictions than other methods, but the experience of the analyst can be an important factor.
...
- Assessment - Adult Clinical Applications
- Behavioral Case Formulation
- Behavioral Working Alliance
- Behaviorology
- Computers and Behavioral Assessment
- Descriptive and Functional Analyses
- Intensive Behavior Therapy Unit
- Philosophical Aspects of Behaviorism
- Private Events
- Private Practice of Behavioral Treatment
- Psychoneuroimmunology
- Role Playing
- Self-Monitoring
- Setting Events
- Termination
- Therapeutic Relationship
- Treatment Compliance in Cognitive Behavior Therapy
- Assessment - Child Clinical Applications
- Assessment - Educational Applications
- ABC Charts and Scatterplots
- Archival Records
- Behavior Rating Scales
- Behavioral Assessment
- Behavioral Assessment Interviews
- Behavioral Consultation
- Behavioral Observations (Event/Interval)
- Changing Criterion Design
- Curriculum-Based Assessment
- Direct Observation
- Dynamic Indicators of Basic Early Literacy Skills (DIBELS)
- Early-Risk Screening for School-Related Behavior Disorders
- Functional Behavioral Assessment of Problem Behavior
- Individualized Education Program (IEP)
- Program Evaluation
- Rate and Frequency
- Standard Celeration Chart System
- Trend Line
- Visual Analysis of Graphic Data
- Autobiographies and Biographies - Adult Clinical Applications
- Agras, W. Stewart
- Azrin, Nathan H.
- Barlow, David H.
- Beck, Aaron T.
- Bellack, Alan S.
- Cautela, Joseph R.
- Davison, Gerald C.
- Emmelkamp, Paul M. G.
- Foa, Edna B.
- Franks, Cyril M.
- Goldiamond, Israel
- Hersen, Michel
- Kanfer, Frederick H.
- Kazdin, Alan E.
- Lazarus, A. A.
- Lewinsohn, Peter A.
- Marks, Isaac M.
- Marshall, William L.
- Meichenbaum, Donald H.
- Miltenberger, Raymond G.
- Paul, Gordon L.
- Pavlov, Ivan P.
- Skinner, Burrhus Frederic
- Suinn, Richard M.
- Turner, Samuel M.
- Wolpe, Joseph
- Biographies - Child Clinical Applications
- Biographies - Educational Applications
- Major Techniques - Adult Clinical Applications
- Anger Management
- Anxiety/Anger Management Training
- Applied Relaxation and Tension
- Behavioral Approaches to Schizophrenia
- Behavioral Approaches to Sexual Deviation
- Behavioral Assessment
- Behavioral Gerontology
- Behavioral Group Work
- Behavioral Medicine
- Behavioral Treatment for Aggression in Couples
- Behavioral Treatment for the Addictions
- Behavioral Weight Control Treatments
- Biofeedback
- Cognitive Behavior Therapy
- Coping With Depression
- Coverant Control
- Covert Sensitization Conditioning
- Dialectical Behavior Therapy
- Eating Disorders
- Electrical Aversion
- Eye Movement Desensitization and Reprocessing
- Flooding
- Functional Analytic Psychotherapy
- Manualized Behavior Therapy
- Memory Rehabilitation After Traumatic Brain Injury
- Modeling
- Motivational Interviewing
- Multimodal Behavior Therapy
- Operant Conditioning
- Organizational Behavior Management
- Panic Control Treatment
- Pharmacotherapy and Behavior Therapy
- Private Practice of Behavioral Treatment
- Progressive Muscular Relaxation
- Psychoneuroimmunology
- Rational-Emotive Behavior Therapy
- Relapse Prevention
- Relaxation Strategies
- Role Playing
- Self-Control Therapy
- Self-Management
- Social Skills Training
- Stampfl's Therapist Directed Implosive (Flooding) Therapy
- Systematic Desensitization
- Termination
- Therapeutic Relationship
- Token Economy
- Trauma Management Therapy
- Treatment Compliance in Cognitive Behavior Therapy
- Major Techniques - Child Clinical Applications
- Adolescent Anger Management
- Antecedent Control Procedures
- Anxiety Management
- Assertiveness Training
- Aversive Conditioning
- Avoidance Training
- Behavior Management for Improving Academic and Classroom Behavior
- Behavioral Consultation
- Behavioral Contracting
- Behavioral Family Therapy
- Behavioral Group Therapy With Children and Youth
- Behavioral Weight Control Therapy With Children
- Bell and Pad Bladder Training
- Biofeedback
- Cognitive Restructuring
- Contingency Management
- Counterconditioning
- Discrete Trial Therapy
- Drug Abuse Prevention Strategies
- Exposure and Response Prevention
- Extinction
- Flooding
- Full-Spectrum Home Training for Simple Bed-Wetting
- Function Communication Training
- Habit Reversal
- In Vivo Desensitization
- Life Skills Training
- Manualized Behavior Therapy
- Modeling
- Multisystemic Therapy
- Negative Reinforcement
- Overcorrection
- Pain Management
- Parent Training
- Parent-Child Interaction Therapy
- Peer Intervention
- Pharmacotherapy
- Point System
- Positive Reinforcement
- Premack Principle
- Punishment
- Relapse Prevention
- Relaxation Training in Children
- Response Blocking
- Response Cost
- Self-Injury and Suicide
- Shaping
- Social and Interpersonal Skills Training
- Social Competence Treatment: Externalizing Disorders
- Sport Skill Training
- Systematic Desensitization With Children and Adolescents
- Time-Out
- Token Economy
- Major Techniques - Educational Applications
- Applied Behavior Analysis
- Behavior Management
- Classroom Management
- Direct Instruction
- Direct Instruction Mathematics
- Function-Based Approach to Behavior Support: Logic, Practices, and Systems
- Functional Analysis
- Person-Centered Planning
- Positive Behavior Support
- Progress Monitoring: Conceptual, Methodological, and Practical Applications
- School Emergency Procedures
- Schoolwide Discipline
- Single-Subject Research Design
- Wraparound
- Minor Techniques - Adult Clinical Applications
- Acceptance and Commitment Therapy
- Applied Tension
- Arousal Training
- Autogenic Training
- Aversion Relief
- Behavior Activation
- Behavior Rehearsal
- Behavioral Approaches to Gambling
- Behavioral Assessment
- Behavioral Contracting
- Behavioral Treatment of Cigarette Smoking
- Behavioral Treatment of Insomnia
- Behaviorology
- Bibliotherapy
- Breathing Retraining
- Cognitive Behavior Therapy With Religious Beliefs and Practices
- Cognitive Restructuring
- Cognitive-Behavioral Approach to Bipolar Disorder
- Competing Response Training
- Controlled Drinking
- Covert Positive Reinforcement
- Covert Rehearsal
- Covert Reinforcer Sampling
- Cue-Controlled Relaxation
- Differential Reinforcement of Other Behavior
- Exposure
- Extinction and Habituation
- Group Behavioral Therapy for Depression
- Guided Mastery
- Habit Reversal
- Homework
- Intensive Behavior Therapy Unit
- Job Club Method
- Masturbatory Retraining
- Mindfulness Meditation
- Motivational Enhancement Therapy
- Noncontingent Reinforcement
- Orgasmic Reconditioning
- Overcorrection
- Paradoxical Intention
- Person-Centered Planning
- Private Practice of Behavioral Treatment
- Problem-Solving Therapy
- Reinforcement
- Relational Frame Therapy
- Response Prevention
- Schedule-Induced Behavior
- Self-Control
- Self-Control Desensitization
- Self-Monitoring
- Self-Statement Modification
- Setting Events
- Shadowing
- Social Effectiveness Training
- Spouse-Aided Therapy
- Squeeze Technique
- Stress Inoculation Training
- Termination
- Therapeutic Relationship
- Thought-Stopping
- Video Feedback
- Virtual Reality Therapy
- Minor Techniques - Child Clinical Applications
- 3-5-10-15 Method for Spelling
- Aromatic Ammonia
- Attention Training Procedures
- Beat the Buzzer
- Behavioral Rehearsal
- Chore and Allowance Program for Children
- Competing Response Training
- Compliance Training
- Contingent Exercise
- Contingent Restraint
- Correspondence Training
- Covert Conditioning With Children and Adolescents
- Differential Reinforcement of Incompatible Behavior
- Differential Reinforcement of Low Rates of Behavior
- Differential Reinforcement of Other Behavior
- Discrimination Training
- Donald M. Baer
- Errorless Compliance Training
- Escape Training
- Facial Screening
- Fading
- Feedback
- Five-Step Procedure for Stealing
- Generalized Conditioned Punisher
- Generalized Conditioned Reinforcer
- Goal Setting
- Good Behavior Game
- Graduated Extinction
- Group Contingency
- Habituation
- Home-Based Reinforcement
- Homework
- Imaginal Procedures
- Lemon Juice Therapy
- Marking Time-Out
- Massed Practice
- Negative Practice
- Noncontingent Reward (Reinforcement)
- Positive Practice
- Problem-Solving Training
- Prompt
- Public Posting
- Regulated Breathing
- Reinforced Practice
- Restitution
- Retention Control Training
- Ritual Prevention
- Role Playing
- Self-Instruction Training
- Self-Monitoring
- Self-Praise
- Sensory Extinction
- Somatic Control Strategies
- Spontaneous Recovery
- Sticker/Star Chart
- Stimulus Control
- Stimulus Discrimination Training
- Task Analysis
- Thought Stopping
- Transfer of Stimulus Control
- Vicarious Conditioning
- Vicarious Extinction
- Vicarious Punishment
- Vicarious Reinforcement
- Virtual Reality Therapy With Children
- Water Misting
- Write-Say Method
- Minor Techniques - Educational Applications
- Academic Interventions
- Active Student Responding
- Active Supervision
- Augmentative and Alternative Communication
- Beginning Reading
- Behavior Intervention Planning
- Behavioral Contracting
- Behavioral Momentum
- Behavioral Objectives
- Behavioral Rehearsal
- Chaining
- Choral Responding
- Classwide Peer Tutoring
- Corporal Punishment
- Cross-Age Tutoring
- Detention
- Differential Reinforcement
- Differential Reinforcement of Other Behavior
- Discrete Trial Instruction
- Discrimination Training
- Error Correction
- Errorless Learning
- Extinction
- Fading
- Functional Communication Training
- General Case Programming
- Incidental Teaching
- Learned Helplessness
- Long-Term Objectives
- Mainstreaming
- Mastery Learning
- Negative Reinforcement
- Noncontingent Reinforcement as a Treatment for Problem Behavior in the Classroom
- Operant Conditioning
- Opportunity to Respond
- Pacing
- Peer Tutoring
- Pivotal Response Training
- Positive Peer Reporting
- Positive Reinforcement
- Precision Teaching
- Precorrection
- Preference and Reinforcer Identification
- Premack Principle
- Programmed Instruction
- Prompting
- Schedules of Reinforcement
- Self-Assessment
- Self-Instruction
- Self-Management
- Shaping to Teach New Behaviors
- Short-Term Objectives
- Social Skills Instruction
- Suspension
- Task Analysis
- Task Interspersal
- Teaching Schoolwide Expectations
- Teaching Students Self-Control
- Time Delay Instructional Procedure
- Time-Out
- Token Economy
- Research - Adult Clinical Applications
- Research - Educational Applications
- Attention-Deficit/Hyperactivity Disorder (ADHD)
- Autism Spectrum Disorders
- Conduct Disorders
- Effective Learning Environments
- Evidence-Based Practice
- Individuals with Disabilities Education Act (IDEA)
- Learning Disabilities
- Project Follow Through and Direct Instruction
- Self-Determination
- Sleep Deprivation
- Speech and Language Disorders
- Research and Theoretical - Child Clinical Applications
- Applied Behavior Analysis
- Behavior Therapy
- Behavioral Pediatrics
- Case Conceptualization
- Classical Conditioning
- Cognitive Behavior Therapy: Child Clinical Applications
- Empirically Supported Treatments for Childhood Disorders
- Functional Analysis
- Generalization
- Maintenance
- Operant Conditioning
- Paradigmatic Behavior Therapy
- Research Designs
- Schedules of Reinforcement
- Theoretical and Conceptual Issues - Adult Clinical Applications
- Applied Behavior Analysis
- Association for Advancement of Behavior Therapy
- Behavior Therapy and Neuropsychology
- Behavior Therapy Theory
- Behavior Training
- Behavioral Analytic Approach to Supervision
- Behavioral Consultation
- Behavioral Social Work
- Behavioral Sport Psychology
- Behavioral Treatment in Natural Environments
- Behavioral Treatments of Minorities
- Behavioral Working Alliance
- Classical Conditioning
- Contextualism
- Cultural Differences in Cognitive Therapy
- Efficacy, Effectiveness, and Patient-Focused Research
- Historical Antecedents of Behavior Modification and Therapy
- Kantor's Interbehaviorism
- Philosophical Aspects of Behaviorism
- Private Events
- Schedules of Reinforcement
- Therapeutic Relationship
- Treatment Compliance in Cognitive Behavior Therapy
- Treatment Failures in Behavior Therapy
- Theoretical Issues - Educational Applications
- Acquisition
- Antecedent
- Baseline
- Beginning Reading Instruction
- Behavioral Dimensions
- Behavioral Fluency
- Character Education
- Coercive Cycles in Families
- Consequence
- Contextual Fit
- Contextualism and Behavior Analysis
- Contingencies in Educational Settings
- Deprivation
- Establishing Operations
- Ethical Issues Regarding Behavior Management in the Schools
- Functional Relation
- Functions of Behavior
- Generalization
- Maintenance
- Operant
- Phases of Learning
- Preventing Escalated Behavior: Strategies for Defusing Problem Behavior
- Problem-Solving Consultation Model
- Punishment
- Response Class Theory
- Response Cost
- Rule-Governed Behavior
- Rules
- Satiation
- Setting Event
- Social Competence
- Stimulus Control
- Systems of Care
- Testable Hypothesis
- Zero Tolerance
- Loading...
Get a 30 day FREE TRIAL
-
 Watch videos from a variety of sources bringing classroom topics to life
 -
Read modern, diverse business cases
-
Explore hundreds of books and reference titles

Read next

More like this
Sage Recommends
We found other relevant content for you on other Sage platforms.
Have you created a personal profile? Login or create a profile so that you can save clips, playlists and searches