Entry
Reader's guide
Entries A-Z
Subject index
Bell-Shaped Curve
A BELL-SHAPED CURVE is associated with the well known normal distribution where most people achieve ratings or scores in the middle range, while a few appear at either end of the range. Politicians have adopted the bell-shaped curve in support of their election bids through the science of polling. Faith in poll results has allowed elected officials and rival candidates to obtain rapid results on the mood of the electorate on social issues.
European mathematicians found that large collections of numbers and their averages exhibit a statistical distribution, which is approximated by a normal probability distribution, often called the Gaussian Distribution. The mean and standard deviation are key parameters that, if known, contain all the information defined by the data set. This means that the original data sets need no longer be kept as these two parameters completely describe the relationship of the measurements or samples. Today, this curve is frequently referred to as the Bell Curve and its predictive power is derived from the technique of random sampling.
George Gallup, for example, predicted the surprising Roosevelt victory of 1936 more accurately than other leading polls, such as the massive survey conducted by the Literary Digest. Based on the predictive power of random sampling. Gallup knew his Bell Curve-based statistical approach would produce much more accurate polling results. Gallup's 3,000 randomly selected interviews turned out to be more powerful than the 10 million people polled by the Literary Digest using a survey technique called quota sampling.
Since then, social scientists have used the statistics of normal distributions to determine the relationships between voting and variables such as education, socioeconomic class, age, and gender. Numerous studies have shown that the highly educated tend to vote more. The college graduate is more likely to participate in politics than a high school graduate, just as a white-collar employee will vote more than a blue-collar worker.
Elections are won or lost based on the votes of the middle class and the elites in society. It is in these classes where the most highly educated people are found. A strong correlation is found between education and level of political knowledge, attitude towards government, and interest in voting. The notion of correlation assesses the strength of relationship between variables; social scientists look for sources of correlation among groups of people within society.
A bell-shaped curve, or standard deviation diagram, showing the majority in the middle and fringe elements on the edges.
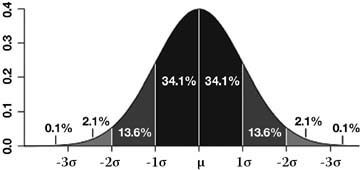
Because the types of polling questions asked tend to vary, the raw scores are not a meaningful measurement. Instead, the standard deviation is used. It provides a level of standardization similar to the measurement of time in seconds. One standard deviation translates into a result at either the 16th or 84th percentile, while two standard deviations places the result way outside the normal distribution of responses at the 2nd and 98th percentiles.
A standard deviation greater than two indicates a response on the fringe, with respect to a given issue. The standard deviation thus can be thought of as the average of the differences from the mean. Most polls authorized by politicians are done with a random sample size of about 500–1,000 people, which assures one standard deviation of accuracy, assuring confidence that the bulk of the constituent's views are reflected.
...
- Ballot Issue Campaigns
- Campaigns, Elections, and the Law
- Abortion
- Advertising, Campaign
- Affirmative Action
- African-American Suffrage
- At-Large Election
- Bell-Shaped Curve
- Campaigns Around the World
- Civil Rights
- Coattail Effect
- Colonialism
- Congressional Elections
- Crime
- Currency
- Defense
- Domestic Policy
- Economy
- Education
- Eight-Hour Day
- Election Boards
- Election Judges
- Election Laws, Federal Elections
- Election Laws, State and Local Elections
- Election Outcome Forecasting Models
- Election Types
- Election Verification Exit Poll (EVEP)
- Electoral College
- Electoral Triangle
- Electors
- Environment
- Expansionism
- Fairness Doctrine
- Farm Issues in Campaigns
- Federal Election Assistance Commission
- Federal Election Commission
- Federal Elections Bill (Force Bill)
- Feminism
- Fifteenth Amendment
- First Amendment
- Foreign Policy
- Free Trade
- Gay Rights
- General Elections
- Get-Out-the-Vote (GOTV) Drives
- Government Spending
- Gun Control
- Healthcare
- High and Low Stimulus Elections
- Homeland Security
- Immigration
- Independent Voters
- Isolationism
- Jim Crow Laws
- Ku Klux Klan
- Landslides, Election
- Law and Order
- League of Nations
- Limited Government
- Literacy Test
- McCain-Feingold Campaign Finance Reform
- Midterm Elections
- Minimum Wage
- National Debt
- Nineteenth Amendment
- Nonpartisan Election
- Nonvoters
- Panama Canal
- Patriotism
- Period Effect
- Political Districts
- Popular Sovereignty, Doctrine of
- Primaries, State and Local Elections
- Primary Elections
- Protectionism
- Racial Justice
- Realignment
- Reconstruction
- Red States
- Religious Issues in Campaigns
- Rural Vote
- School Integration
- Senior Citizen Issues
- Slavery
- Social Concerns
- Social Security
- Social Security Reform
- Special Election
- Special Interests
- Stalking Horse
- Suffrage
- Taxes
- Technology
- Travel
- Twelfth Amendment
- Twenty-Fourth Amendment
- Twenty-Second Amendment
- Twenty-Sixth Amendment
- Twenty-Third Amendment
- United Nations
- Veterans
- Vietnam
- War and Peace
- War on Terrorism
- Watergate
- Welfare and Poverty
- Winner-Take-All System
- Corruption in American Campaigns and Elections
- Candidate Image
- Challengers to Incumbents
- Cognitive Dissonance
- Corruption and Democratic Elections
- Cross-Pressures, Sociopolitical
- Dealignment
- Demagogues in Political Campaigns
- Divided Government and Electoral Behavior
- Efficacy, Political
- Internet Use in Political Campaigns
- Literacy Test
- Machine Politics and Political Bosses
- Majority Rule
- Military Hero
- Negative Campaigning
- New Hampshire Primary
- Political Alienation
- Political Cynicism
- Presidential Approval Ratings
- Recall
- Electoral Behavior of Various Groups
- African-American Vote
- Age and Voting Behavior
- Arab-American (Muslim) Vote
- Asian-American Vote
- Catholic Vote
- Divided Government and Electoral Behavior
- Farm Vote
- Get-Out-the-Vote (GOTV) Drives
- Hispanic Vote
- Jewish Vote
- Labor Vote
- Marital Status and Voting Behavior
- Military Vote
- Occupation and Voting Behavior
- Political Elites
- Polling and Election Studies Organizations
- Protestant Vote
- Race and Voting Behavior
- Religion and Voting Behavior
- Social Groups and Electoral Behavior
- Local Campaigns and Elections
- Media Role
- Bandwagon Effect
- Candidate Image
- Cross-Pressures, Sociopolitical
- Dealignment
- Determinant of Vote Choice
- Early Voting
- Favorite Son Candidate
- Gatekeeping
- Get-Out-the-Vote (GOTV) Drives
- Horse Race, Media Coverage of
- Internet Use in Political Campaigns
- Issue Coverage by the Media
- Local Media Coverage of Campaigns
- Media Polls
- Media, Control by Campaign Organizations
- Media, Role in Campaigns
- Pack Journalism
- Political Cartoons
- Political Culture
- Political Cynicism
- Political Editorials
- Political Ephemera
- Political Socialization
- Technology
- People
- Anderson, John
- Bryan, William Jennings
- Crossley, Archibald
- Curley, James Michael
- Daley, Richard J.
- Debs, Eugene
- Field, Mervin
- Gallup, George
- Hall, Gus
- Hanna, Marcus
- Harris, Lou
- LaFollette, Robert M.
- Long, Huey P.
- Mitofsky, Warren
- Nader, Ralph
- Pendergast, Tom
- Perot, Ross
- Plunkett, George Washington
- Roper, Elmo
- Thurmond, J. Strom
- Tweed, William
- Wallace, George C.
- Wallace, Henry A.
- Zogby, John
- Political Parties and Interest Groups
- American Communist Party
- American Independent Party
- American Party
- Anti-Federalists
- Anti-Masonic Party
- Bull Moose Party
- Competitive Seats
- Conservatism
- Constitutional Union Party
- Conventions, National Nominating Party
- Democratic National Committee
- Democratic Party
- Democratic State Party Organizations
- Democratic-Republican Party
- Direct Democracy
- Efficacy, Political
- Electoral Behavior
- Federalist Party
- Fifteenth Amendment
- First Amendment
- Focus Groups
- Get-Out-the-Vote (GOTV) Drives
- Green Party
- Greenback-Labor Party
- Interest in Politics
- Know-Nothing Party
- Liberal Republican Party
- Liberalism
- Libertarian Party
- Liberty Party
- Multiparty System
- National Labor Reform Party
- National Republican Party
- Northern Democrats
- Participatory Democracy
- Partisanship
- Party Image
- Party Platforms
- Patronage System
- People's Party
- Pluralist Politics
- Political Action Committees
- Political Clubs
- Political Culture
- Political Elites
- Political Parties in American Elections
- Populists and Populist Movements
- Presidential Campaign Party Caucuses
- Progressive Party
- Prohibitionist Party
- Reform Party
- Religious Issues in Campaigns
- Representative Democracy
- Representative Role Types
- Republican National Committee
- Republican National Party Finance Committees
- Republican Party
- Republican State Party Organizations
- Right-Wing Candidates
- Safe Seats
- Social-Labor Party
- Socialist Party
- Southern Democratic Party
- State Campaign Committees
- States' Rights Party (Dixiecrats)
- Tammany Hall
- Third Parties
- Two-Party System
- Whig Party
- Political Theory and Democratic Elections
- Anti-Communism
- Corruption and Democratic Elections
- Democratic “Rules of the Game”
- Democratic National Committee
- Democratic National Party Finance Committees
- Democratic Party
- Democratic State Party Organizations
- Democratic-Republican Party
- Direct Democracy
- Fairness Doctrine
- Free Soil Party
- Issue Evasion
- Issue Framing
- Issue Ownership Theory
- Left-Wing Candidates
- Liberalism
- Machine Politics and Political Bosses
- Majority Rule
- Mandate
- Participatory Democracy
- Pluralist Politics
- Political Base
- Political Climate
- Political Culture
- Political Cynicism
- Political Ephemera
- Political Legitimacy and Democracy
- Political Socialization
- Political Theorists
- Polls and Public Opinion
- Bandwagon Effect
- Candidate Image
- Caucuses
- Challengers to Incumbents
- Coattail Effect
- Cognitive Dissonance
- Cross-Pressures, Sociopolitical
- Dark Horse Candidate
- Dealignment
- Determinants of Vote Choice
- Early Voting
- Efficacy, Political
- Electoral Behavior
- Exit Poll
- Favorite Son/Daughter
- First-Time Voters
- Get-Out-the-Vote (GOTV) Drives
- Incumbent
- Independent Voters
- Internet Polls
- Life-Cycle Effect
- Media Polls
- Nonvoters
- Plurality Vote
- Political Ideology and Voting
- Poll Tax
- Polling
- Polling and Election Studies Organizations
- Polling Place
- Polls, Pre-Election
- Presidential Approval Ratings
- Protest Voting
- Push Polls
- Rational Voter Model
- Recall
- Red States
- Retrospective Voting
- Rural Vote
- Single-Issue Voting
- Split Ticket Voting
- Straight Ticket Voting
- Suburban Vote
- Suffrage
- Undecided Voters
- Urban Vote
- Vote by Mail
- Voter Alienation
- Voter Apathy
- Voter Disenfranchisement
- Voter Expectations
- Voter Knowledge/Ignorance
- Voter Qualifications
- Voter Registration
- Voter Self-Interest
- Voter Turnout
- Voting
- Voting by Regions
- Voting Methods
- Voting Rights Act of 1965
- Voting, Incentives for
- Voting, Obstacles to
- Presidential Campaigns and Elections
- Campaign Finance, Federal Elections
- Campaigns, Presidential
- Court Cases, Federal Elections
- Elections Laws, Federal Elections
- Federal Election Assistance Commission
- Federal Election Commission
- Federal Elections Bill (Force Bill)
- Nomination Process, Presidential
- Presidential Approval Ratings
- Presidential Campaign Party Caucuses
- Presidential Debates
- Presidential Election of 1789
- Presidential Election of 1792
- Presidential Election of 1796
- Presidential Election of 1800
- Presidential Election of 1804
- Presidential Election of 1808
- Presidential Election of 1812
- Presidential Election of 1816
- Presidential Election of 1820
- Presidential Election of 1824
- Presidential Election of 1828
- Presidential Election of 1832
- Presidential Election of 1836
- Presidential Election of 1840
- Presidential Election of 1844
- Presidential Election of 1848
- Presidential Election of 1852
- Presidential Election of 1856
- Presidential Election of 1860
- Presidential Election of 1864
- Presidential Election of 1868
- Presidential Election of 1872
- Presidential Election of 1876
- Presidential Election of 1880
- Presidential Election of 1884
- Presidential Election of 1888
- Presidential Election of 1892
- Presidential Election of 1896
- Presidential Election of 1900
- Presidential Election of 1904
- Presidential Election of 1908
- Presidential Election of 1912
- Presidential Election of 1916
- Presidential Election of 1920
- Presidential Election of 1924
- Presidential Election of 1928
- Presidential Election of 1932
- Presidential Election of 1936
- Presidential Election of 1940
- Presidential Election of 1944
- Presidential Election of 1948
- Presidential Election of 1952
- Presidential Election of 1956
- Presidential Election of 1960
- Presidential Election of 1964
- Presidential Election of 1968
- Presidential Election of 1972
- Presidential Election of 1976
- Presidential Election of 1980
- Presidential Election of 1984
- Presidential Election of 1988
- Presidential Election of 1992
- Presidential Election of 1996
- Presidential Election of 2000
- Presidential Election of 2004
- Presidential Election of 2008
- Presidential Elections
- Presidential Primaries
- Scandals, Presidential Elections
- Reforming Campaigns and Elections
- Running Political Campaigns: Management, Organization, and Strategies
- Agenda Setting
- Balanced Ticket
- Bell-Shaped Curve
- Campaign Exploratory Committees
- Campaign Finance, Federal Elections
- Campaign Finance, Politics of
- Campaign Manager
- Campaign Reforms
- Campaign Spending
- Campaign Strategies
- Campaigns Around the World
- Candidate Image
- Canvassing Voters in Campaigns
- Caucuses
- Centrist Candidates
- Civil War and Realignment
- Dark Horse Candidate
- Delegates, Convention
- Demagogues in Political Campaigns
- Efficacy, Political
- Endorsements in Campaigns
- Fairness Doctrine
- Favorite Son Candidate
- Focus Groups
- Functional Theory of Political Campaign Discourse
- Fundraising, Federal Campaigns
- Fundraising, State Campaigns
- Generation Effect
- Get-Out-the-Vote (GOTV) Drives
- Great Depression and Realignment
- Internet Use in Political Campaigns
- Issue Evasion
- Issue Framing
- Left Wing Candidates
- Military Hero
- Pluralist Politics
- Political Base
- Political Cartoons
- Political Ephemera
- Proportional Representation
- Public Funding of Campaigns
- Red States
- Representative Role Types
- Rose Garden Strategy
- Special Interests
- Stalking Horse
- Targeting Strategies
- Veterans
- Social and Psychological Dynamics of Electoral Behavior
- African-American Vote
- Age and Voting Behavior
- Arab-American (Muslim) Vote
- Asian-American Vote
- Catholic Vote
- Conservatism
- Cross-Pressures, Sociopolitical
- Dealignment
- Determinants of Vote Choice
- Divided Government and Electoral Behavior
- Early Voting
- Educational Level and Voting Behavior
- Electoral Behavior
- Favorite Son Candidate
- Gender and Voting Behavior
- Gender Gap
- Hispanic Vote
- Income and Voting Behavior
- Issue Salience and Voting Behavior
- Jewish Vote
- Labor Vote
- Marital Status and Voting Behavior
- Military Vote
- Occupation and Voting Behavior
- Political Alienation
- Political Culture
- Political Cynicism
- Political Elites
- Political Ideology and Voting
- Political Socialization
- Polling and Election Studies Organizations
- Protestant Vote
- Psychological Reasons for Voting and Nonvoting
- Race and Voting Behavior
- Religion and Voting Behavior
- Social Groups and Electoral Behavior
- Travel
- Trust in Government
- Voter Self-Interest
- State and Congressional Campaigns and Elections
- Alabama
- Alaska
- Arizona
- Arkansas
- Battleground States
- Bellwether States
- Blue States
- California
- Campaigns, State
- Colorado
- Congressional Elections
- Connecticut
- Court Cases, State and Local Elections
- Delaware
- Democratic State Party Organizations
- District of Columbia
- Florida
- Georgia
- Hawaii
- Idaho
- Illinois
- Indiana
- Iowa
- Iowa Caucus
- Kansas
- Kentucky
- Louisiana
- Maine
- Maryland
- Massachusetts
- Michigan
- Minnesota
- Mississippi
- Missouri
- Montana
- Nebraska
- Nevada
- New Hampshire
- New Hampshire Primary
- New Jersey
- New Mexico
- New York
- North Carolina
- North Dakota
- Ohio
- Oklahoma
- Oregon
- Pennsylvania
- Red States
- Rhode Island
- Scandals, State and Local Elections
- South Carolina
- South Dakota
- Tennessee
- Texas
- Utah
- Vermont
- Virginia
- Washington
- West Virginia
- Wisconsin
- Wyoming
- Loading...
Get a 30 day FREE TRIAL
-
 Watch videos from a variety of sources bringing classroom topics to life
 -
Read modern, diverse business cases
-
Explore hundreds of books and reference titles

Read next

More like this
Sage Recommends
We found other relevant content for you on other Sage platforms.
Have you created a personal profile? Login or create a profile so that you can save clips, playlists and searches