Entry
Reader's guide
Entries A-Z
Subject index
Europe
Europe consists of countries that differ in history, geography, climate, political system, and health care system. Since the falling apart of the former Soviet Union and the former Yugoslavia, the number of countries has increased. Since May 2004, the European Union (EU) numbers 25 countries. In that year, the total population of the EU amounted to 457 million inhabitants. The EU does not include several countries—some in Western Europe (e.g., Norway, Switzerland), some in Eastern Europe (e.g., Rumania, Bulgaria), and many of the newly formed countries (e.g., Croatia, Belarus). The share of older persons (age 65 years and older) in the EU population is 16.4% on average. This share is expected to nearly double to 29.9% by 2050.
Figure 1 Populations Age 65 Years and Older in 2004 and Projections for 2025 and 2050 for Selected Countries
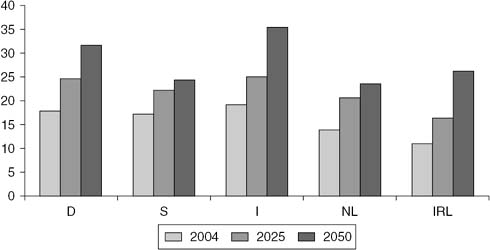
The heterogeneity across European countries manifests itself in the widely different shares of the population age 65 years and older as well as in the widely different rates of increase in this share (Figure 1). In 2004, the proportions of older persons ranged from 11.1% in Ireland to 19.2% in Italy. The expected increases by 2050 range from a modest 7.1 percentage points in Sweden to a spectacular 18.7 percentage points in Spain, resulting in a range from 22.1% in Luxembourg to 35.6% in Spain as the lowest and highest expected proportions, respectively, of the population age 65 years and older. Moreover, the share of the oldest-old population (age 80 years and older) is expected to nearly triple by 2050, with the highest proportion expected in Italy (14.1%).
The variety in these demographic projections stems from differences in fertility, mortality, and migration. Among these, fertility has the most impact. First, the post–World War II baby boom differed across countries in intensity and duration. For instance, in the Netherlands the baby boom lasted until 1970, whereas in other countries it was over before 1960. Second, the countries differ in their rates of decline in fertility since the 1960s. For instance, in the Netherlands the fertility rate dropped from 2.8% to 1.6%. This drop has been steepest in the Mediterranean countries. Migration is expected to have the greatest impact in the new EU member states, resulting in a decline of the total population and a relatively large increase in the proportion age 65 years and older. Although mortality at older ages shows consistent declines, the rate of decline is again different across countries and even shows increases in Denmark, the Netherlands, Norway, and several Eastern European countries. France shows the most consistent declines.
Morbidity and Disability
Availability of Data
Comparison of morbidity and disability across European countries is more difficult than comparison of mortality because each country shapes its health policy using its own concepts and measurement of health indicators. A few early international studies included European countries but were limited in scope or included only a selection of the older population. Only in the 1990s did a number of cross-national surveys that used common instruments and sampling methods become available. The best known is the European Community Household Panel survey, conducted in the noninstitutionalized population in 13 countries. For the assessment of health during older age, however, this survey is less suitable because in many countries a sizable proportion of older persons live in institutions.
...
- Aging and the Brain
- Alzheimer's Disease
- Apolipoprotein E
- Consortium to Establish a Registry for Alzheimer's Disease
- Creutzfeldt–Jakob Disease
- Delirium and Confusional States
- Imaging of the Brain
- Lewy Body Dementia
- Mental Status Assessment
- Mild Cognitive Impairment
- Neurobiology of Aging
- Neurological Disorders
- Pick's Disease
- Stroke
- Syncope
- Vascular Dementia
- Vascular Depression
- Diseases and Medical Conditions
- Accelerated Aging Syndromes
- Anemia
- Aneurysms
- Arrhythmias
- Arthritis and Other Rheumatic Diseases
- Calcium Disorders of Aging
- Cancer
- Cancer Prevention and Screening
- Cancer, Common Types of
- Cataracts
- Cellulitis
- Congestive Heart Failure
- Diabetes
- Ear Diseases
- Eye Diseases
- Foot Problems
- Fractures in Older Adults
- Gastrointestinal Aging
- HIV and AIDS
- Hypertension
- Iatrogenic Disease
- Immune Function
- Incontinence
- Infections, Bladder and Kidney
- Infectious Diseases
- Kidney Aging and Diseases
- Men's Health
- Menopause and Hormone Therapy
- Metabolic Syndrome
- Musculoskeletal Aging: Inflammation
- Musculoskeletal Aging: Osteoarthritis
- Oral Health
- Osteoporosis
- Pneumonia and Tuberculosis
- Pressure Ulcers
- Sarcopenia
- Shingles
- Skin Neoplasms, Benign and Malignant
- Spinal Stenosis
- Systemic Infections
- Temperature Regulation
- Thyroid Disease
- Valvular Heart Disease
- Venous Stasis Ulcers
- Wound Healing
- Drug-Related Issues
- Function and Syndromes
- Mental Health and Psychology
- Agitation
- Alcohol Use and Abuse
- Anxiety Disorders
- Behavioral Disorders in Dementia
- Bereavement and Grief
- Control
- Delirium and Confusional States
- Depression and Other Mood Disorders
- Emotions and Emotional Stability
- Expectations Regarding Aging
- Life Course Perspective on Adult Development
- Loneliness
- Memory
- Mental Status Assessment
- Mild Cognitive Impairment
- Motivation
- Personality Disorders
- Positive Attitudes and Health
- Posttraumatic Stress Disorder
- Pseudodementia
- Psychiatric Rating Scales
- Psychosocial Theories
- Schizophrenia, Paranoia, and Delusional Disorders
- Selective Optimization With Compensation
- Self-Care
- Self-Efficacy
- Self-Rated Health
- Stress
- Subjective Well-Being
- Successful Aging
- Suicide and the Elderly
- Vascular Depression
- Nutritional Issues
- Physical Status
- Allostatic Load and Homeostasis
- Biological Theories of Aging
- Biomarkers of Aging
- Body Composition
- Body Mass Index
- Cardiovascular System
- Compression of Morbidity
- Fluid and Electrolytes
- Hearing
- Men's Health
- Multiple Morbidity and Comorbidity
- Normal Physical Aging
- Perioperative Issues
- Pulmonary Aging
- Skin Changes
- Skin Neoplasms, Benign and Malignant
- Sleep
- Surgery
- Temperature Regulation
- Therapeutic Failure
- Vision and Low Vision
- Women's Health
- Prevention
- Sociodemographic and Cultural Factors
- Active Life Expectancy
- Africa
- African Americans
- Age–Period–Cohort Distinctions
- Asia
- Asian and Pacific Islander Americans
- Australia and New Zealand
- Canada
- Caregiving
- Centenarians
- Compression of Morbidity
- Critical Perspectives in Gerontology
- Demography of Aging
- Disasters and Terrorism
- Disclosure
- Early Adversity and Late-Life Health
- Economics of Aging
- Education and Health
- Elder Abuse and Neglect
- Environmental Health
- Epidemiology of Aging
- Ethical Issues and Aging
- Ethnicity and Race
- Europe
- Expectations Regarding Aging
- Global Aging
- Health Communication
- Hispanics
- Homelessness and Health in the United States
- Latin America and the Caribbean
- Life Course Perspective on Adult Development
- Living Arrangements
- Loneliness
- Longevity
- Marital Status
- Mexico
- Midlife
- Migration
- Multiple Morbidity and Comorbidity
- Native Americans and Alaska Natives
- Negative Interaction and Health
- Oldest Old
- Quality of Life
- Rural Health and Aging Versus Urban Health and Aging
- Social Networks and Social Support
- Socioeconomic Status
- Stress
- Successful Aging
- Work, Health, and Retirement
- Studies of Aging
- Aging in Manitoba Longitudinal Study
- Cardiovascular Health Study
- Clinical Trials
- Critical Perspectives in Gerontology
- Duke Longitudinal Studies
- Epidemiology of Aging
- Established Populations for Epidemiologic Studies of the Elderly
- Government Health Surveys
- Health and Retirement Study
- Hispanic Established Population for Epidemiologic Studies of the Elderly
- Honolulu–Asia Aging Study, Honolulu Heart Program
- Longitudinal Research
- Longitudinal Study of Aging
- MacArthur Study of Successful Aging
- National Health Interview Survey
- National Long Term Care Survey
- Normative Aging Study
- Qualitative Research on Aging
- Twin Studies
- Systems of Care
- Advance Directives
- Advocacy Organizations
- Aging Network
- Assisted Living
- Caregiving
- Complementary and Alternative Medicine
- Continuum of Care
- Death, Dying, and Hospice Care
- Elder Abuse and Neglect
- Ethical Issues and Aging
- Geriatric Profession
- Geriatric Team Care
- Gerontological Nursing
- Health and Public Policy
- Health Care System for Older Adults
- Home Care
- Institutional Care
- Legal Issues
- Long-Term Care
- Long-Term Care Insurance
- Managed Care
- Medicaid
- Medicare
- Minimum Data Set
- National Institute on Aging
- Nursing Roles in Health Care and Long-Term Care
- Outcome and Assessment Information Set (OASIS)
- Palliative Care and the End of Life
- Patient Safety
- Pets in Health Care Settings
- Rehabilitation Therapies
- Self-Care
- Social Work Roles in Health and Long-Term Care
- Telemedicine
- Loading...
Get a 30 day FREE TRIAL
-
 Watch videos from a variety of sources bringing classroom topics to life
 -
Read modern, diverse business cases
-
Explore hundreds of books and reference titles

Read next

More like this
Sage Recommends
We found other relevant content for you on other Sage platforms.
Have you created a personal profile? Login or create a profile so that you can save clips, playlists and searches