Entry
Reader's guide
Entries A-Z
Subject index
Demography of Aging
Whereas demography is the study of the size, composition, and territorial distribution of the population, demography of aging refers to the changing proportion of older adults in the population. In the United States, fertility trends during the 20th century declined steadily, with the notable exception of the post–World War II baby boom from 1946 to 1964. Mortality rates also declined throughout the century, but in a very different way. During the first half of the century, mortality declined fastest among the very young as improved sanitation and hygiene decreased the rates of infectious disease. During the second half of the cen tury, mortality declined fastest among middle-aged and older adults with improvements in surgical techniques and treatments for a variety of diseases, most notably cardiovascular disease. Both the fertility and mortality trends resulted in an older population as more people survived infancy and childhood during the early part of the century and aged longer due to decreased old age mortality. During the 21st century, the U.S. population will continue to age as the baby boomers begin to reach 65 years of age in 2011 and survive to mid-century.
Size and Location of the U.S. Population
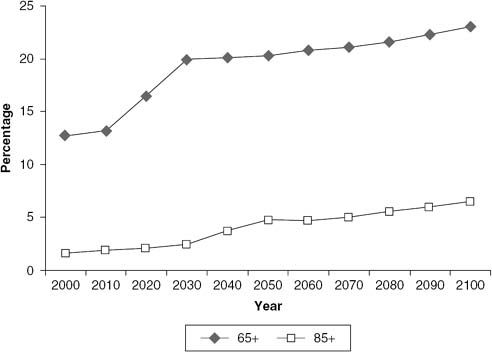
In the United States in 2000, persons age 65 years and older made up approximately 13% of the population. The age of 65 years is important because that is the time when people traditionally retire from paid employment to receive income through the Social Security program. By 2100, the population age 65 years and older will constitute approximately 23% of the population (Figure 1). Of particular concern is the potential growth in the population age 85 years and older because they are the most likely to require medical and social services. In 2000, those age 85 years and older represented approximately 2% of the population; by 2100, this proportion will more than triple to approximately 7%.
Older adults live in all 50 states and constitute approximately 13% of the U.S. population, but they are concentrated in certain areas. Table 1 shows the 10 states with the highest percentages of persons age 65 years and older in 2000 and those projected for 2030. Not surprisingly, Florida is the oldest state, with 17.6% of its residents age 65 years and older. Other states in the top 10 are diverse states such as West Virginia, Iowa, North Dakota, South Dakota, and Maine. By 2030, Florida will still be the oldest state, with 27.1% of its population age 65 years and older. New to the top 10 will be Wyoming, New Mexico, Montana, Vermont, and Delaware. States no longer in the top 10 will include Pennsylvania, Iowa, Rhode Island, Arkansas, and Connecticut. The age structure of these states can change due to both in-migration of retirees, as in Florida's case, and out-migration of young adults to urban areas for economic opportunity, as is probably the case with Iowa.
Figure 1 Older Adults' Projected Proportions of the U.S. Population, 2000 to 2100: Ages 65 Years and Older and 85 Years and Older
Life Expectancy
One of the major reasons for the explosive growth of the older population during the 20th century was the increase in the average life expectancy, which is the average number of years a person can expect to live from a specified age (usually birth). During the last half of the 20th century, life expectancy increased for both men and women, although women's life expectancy was longer than men's at every period. At birth, men and women in 1950 could expect to live 65.6 and 71.1 years, respectively. By 2000, they could expect to live 74.1 and 79.5 years, respectively (Figure 2). Life expectancy also differs by race/ethnicity (Figure 3). Average life expectancy for Whites at birth was 69.1 years in 1950. By 2000, it had grown to 77.4 years. Average life expectancy for African Americans at birth grew from 63.9 years in 1960 (1950 data not available) to 71.7 years in 2000; African Americans have participated in improvements in life expectancy, but not relative to Whites.
...
- Aging and the Brain
- Alzheimer's Disease
- Apolipoprotein E
- Consortium to Establish a Registry for Alzheimer's Disease
- Creutzfeldt–Jakob Disease
- Delirium and Confusional States
- Imaging of the Brain
- Lewy Body Dementia
- Mental Status Assessment
- Mild Cognitive Impairment
- Neurobiology of Aging
- Neurological Disorders
- Pick's Disease
- Stroke
- Syncope
- Vascular Dementia
- Vascular Depression
- Diseases and Medical Conditions
- Accelerated Aging Syndromes
- Anemia
- Aneurysms
- Arrhythmias
- Arthritis and Other Rheumatic Diseases
- Calcium Disorders of Aging
- Cancer
- Cancer Prevention and Screening
- Cancer, Common Types of
- Cataracts
- Cellulitis
- Congestive Heart Failure
- Diabetes
- Ear Diseases
- Eye Diseases
- Foot Problems
- Fractures in Older Adults
- Gastrointestinal Aging
- HIV and AIDS
- Hypertension
- Iatrogenic Disease
- Immune Function
- Incontinence
- Infections, Bladder and Kidney
- Infectious Diseases
- Kidney Aging and Diseases
- Men's Health
- Menopause and Hormone Therapy
- Metabolic Syndrome
- Musculoskeletal Aging: Inflammation
- Musculoskeletal Aging: Osteoarthritis
- Oral Health
- Osteoporosis
- Pneumonia and Tuberculosis
- Pressure Ulcers
- Sarcopenia
- Shingles
- Skin Neoplasms, Benign and Malignant
- Spinal Stenosis
- Systemic Infections
- Temperature Regulation
- Thyroid Disease
- Valvular Heart Disease
- Venous Stasis Ulcers
- Wound Healing
- Drug-Related Issues
- Function and Syndromes
- Mental Health and Psychology
- Agitation
- Alcohol Use and Abuse
- Anxiety Disorders
- Behavioral Disorders in Dementia
- Bereavement and Grief
- Control
- Delirium and Confusional States
- Depression and Other Mood Disorders
- Emotions and Emotional Stability
- Expectations Regarding Aging
- Life Course Perspective on Adult Development
- Loneliness
- Memory
- Mental Status Assessment
- Mild Cognitive Impairment
- Motivation
- Personality Disorders
- Positive Attitudes and Health
- Posttraumatic Stress Disorder
- Pseudodementia
- Psychiatric Rating Scales
- Psychosocial Theories
- Schizophrenia, Paranoia, and Delusional Disorders
- Selective Optimization With Compensation
- Self-Care
- Self-Efficacy
- Self-Rated Health
- Stress
- Subjective Well-Being
- Successful Aging
- Suicide and the Elderly
- Vascular Depression
- Nutritional Issues
- Physical Status
- Allostatic Load and Homeostasis
- Biological Theories of Aging
- Biomarkers of Aging
- Body Composition
- Body Mass Index
- Cardiovascular System
- Compression of Morbidity
- Fluid and Electrolytes
- Hearing
- Men's Health
- Multiple Morbidity and Comorbidity
- Normal Physical Aging
- Perioperative Issues
- Pulmonary Aging
- Skin Changes
- Skin Neoplasms, Benign and Malignant
- Sleep
- Surgery
- Temperature Regulation
- Therapeutic Failure
- Vision and Low Vision
- Women's Health
- Prevention
- Sociodemographic and Cultural Factors
- Active Life Expectancy
- Africa
- African Americans
- Age–Period–Cohort Distinctions
- Asia
- Asian and Pacific Islander Americans
- Australia and New Zealand
- Canada
- Caregiving
- Centenarians
- Compression of Morbidity
- Critical Perspectives in Gerontology
- Demography of Aging
- Disasters and Terrorism
- Disclosure
- Early Adversity and Late-Life Health
- Economics of Aging
- Education and Health
- Elder Abuse and Neglect
- Environmental Health
- Epidemiology of Aging
- Ethical Issues and Aging
- Ethnicity and Race
- Europe
- Expectations Regarding Aging
- Global Aging
- Health Communication
- Hispanics
- Homelessness and Health in the United States
- Latin America and the Caribbean
- Life Course Perspective on Adult Development
- Living Arrangements
- Loneliness
- Longevity
- Marital Status
- Mexico
- Midlife
- Migration
- Multiple Morbidity and Comorbidity
- Native Americans and Alaska Natives
- Negative Interaction and Health
- Oldest Old
- Quality of Life
- Rural Health and Aging Versus Urban Health and Aging
- Social Networks and Social Support
- Socioeconomic Status
- Stress
- Successful Aging
- Work, Health, and Retirement
- Studies of Aging
- Aging in Manitoba Longitudinal Study
- Cardiovascular Health Study
- Clinical Trials
- Critical Perspectives in Gerontology
- Duke Longitudinal Studies
- Epidemiology of Aging
- Established Populations for Epidemiologic Studies of the Elderly
- Government Health Surveys
- Health and Retirement Study
- Hispanic Established Population for Epidemiologic Studies of the Elderly
- Honolulu–Asia Aging Study, Honolulu Heart Program
- Longitudinal Research
- Longitudinal Study of Aging
- MacArthur Study of Successful Aging
- National Health Interview Survey
- National Long Term Care Survey
- Normative Aging Study
- Qualitative Research on Aging
- Twin Studies
- Systems of Care
- Advance Directives
- Advocacy Organizations
- Aging Network
- Assisted Living
- Caregiving
- Complementary and Alternative Medicine
- Continuum of Care
- Death, Dying, and Hospice Care
- Elder Abuse and Neglect
- Ethical Issues and Aging
- Geriatric Profession
- Geriatric Team Care
- Gerontological Nursing
- Health and Public Policy
- Health Care System for Older Adults
- Home Care
- Institutional Care
- Legal Issues
- Long-Term Care
- Long-Term Care Insurance
- Managed Care
- Medicaid
- Medicare
- Minimum Data Set
- National Institute on Aging
- Nursing Roles in Health Care and Long-Term Care
- Outcome and Assessment Information Set (OASIS)
- Palliative Care and the End of Life
- Patient Safety
- Pets in Health Care Settings
- Rehabilitation Therapies
- Self-Care
- Social Work Roles in Health and Long-Term Care
- Telemedicine
- Loading...
Get a 30 day FREE TRIAL
-
 Watch videos from a variety of sources bringing classroom topics to life
 -
Read modern, diverse business cases
-
Explore hundreds of books and reference titles

Read next

More like this
Sage Recommends
We found other relevant content for you on other Sage platforms.
Have you created a personal profile? Login or create a profile so that you can save clips, playlists and searches