
Summary
Contents
Subject index
Analyzing the relationship between globalization and cultures is the core objective of this volume. In it leading experts track cultural trends in all regions of the world, covering issues ranging from the role of cultural difference in politics and governance to heritage conservation, artistic expression, and the cultural industries. The book also includes a data section that consolidates the recently commenced but still inchoate work of cultural indicators.
5C. Conflict + Cooperation
5C. Conflict + Cooperation
- Arms
- Conflict Resolution + Peacekeeping
- Current Conflicts + Issues/Tensions
- Human Rights
- Terrorism
- Trafficking + Corruption
- Piracy
Arms
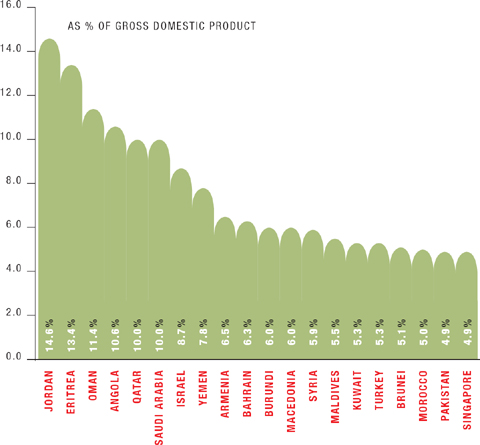
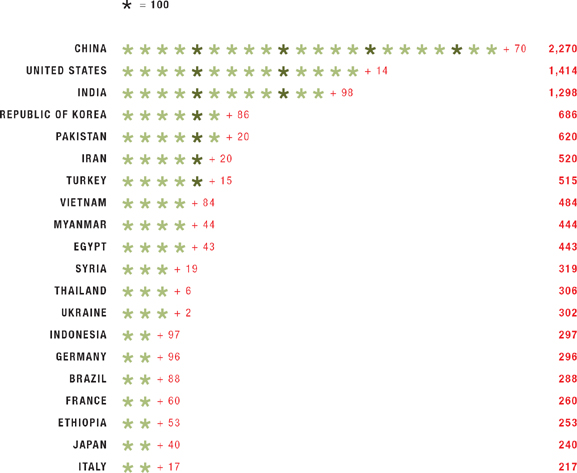
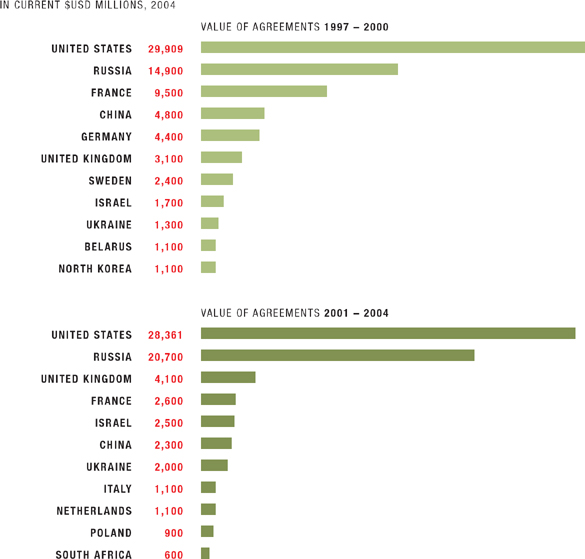
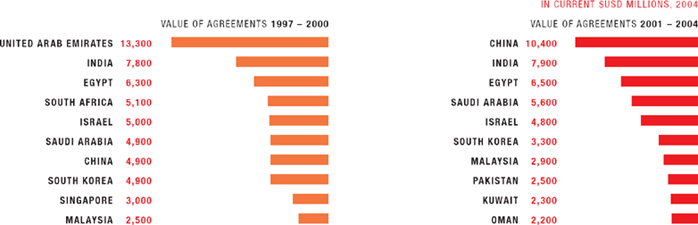
– 15 largest arms producing companies by sales 2003 – regional military expenditure estimates 1995–2004 – us companies with largest department of defense contract awards for work in iraq 2002–june 2004 in $usd current 2004 millions – 15 countries with the highest military expenditures by purchasing power parity 2004 – nations with highest military expenditures 25 % of gross domestic product 2004 – 20 nations with largest total armed forces 2002 – leading suppliers of arms transfer agreements with developing nations 1997–2004 – network analysis: global trade in arms – leading developing nation recipients of arms transfer agreements 1997–2004
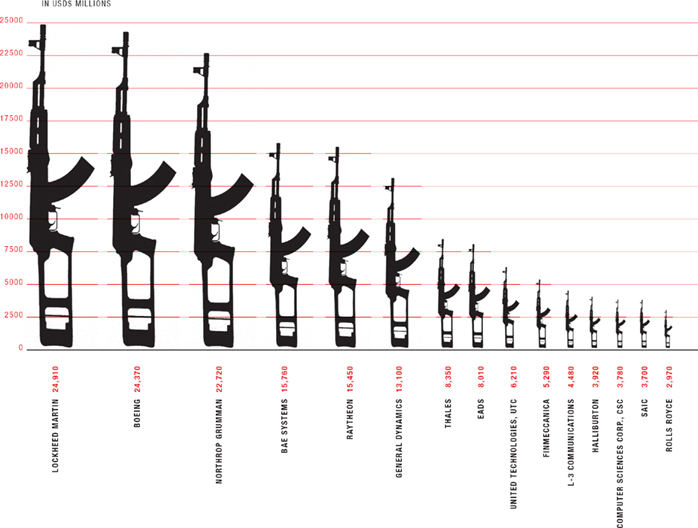
1. 15 LARGEST ARMS-PRODUCING COMPANIES BY SALES 2003
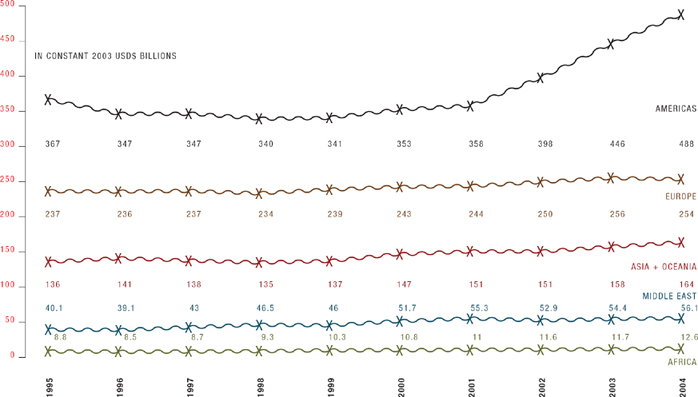
2. MILITARY EXPENDITURE ESTIMATES BY REGION 1995 – 2004
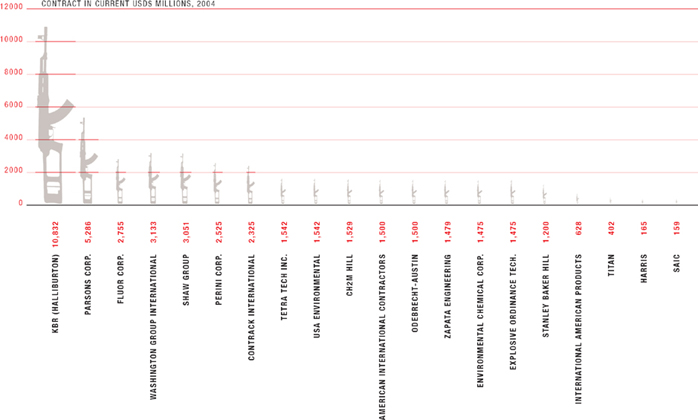
3. US COMPANIES WITH LARGEST DEPARMENT OF DEFENSE CONTRACT AWARDS FOR WORK IN IRAQ 2002 – JUNE 2004
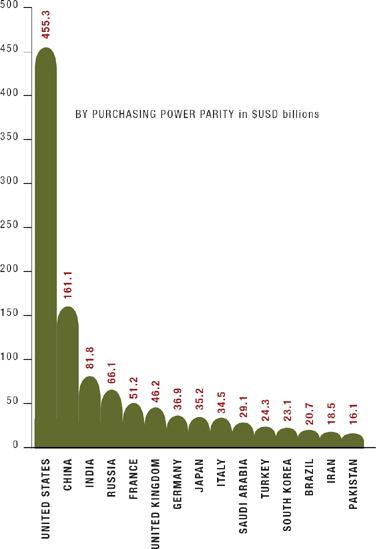
4. 15 COUNTRIES WITH THE HIGHEST MILITARY EXPENDITURES 2004
5. NATIONS WITH LARGEST MILITARY EXPENDITURES 2004
6. 20 NATIONS WITH LARGEST TOTAL ARMED FORCES 2002
7a. LEADING SUPPLIERS OF ARMS TRANSFER AGREEMENTS WITH DEVELOPING NATIONS 1997 – 2004
7b. LEADING DEVELOPING NATION RECIPIENTS OF ARMS TRANSFER AGREEMENTS 1997 – 2004
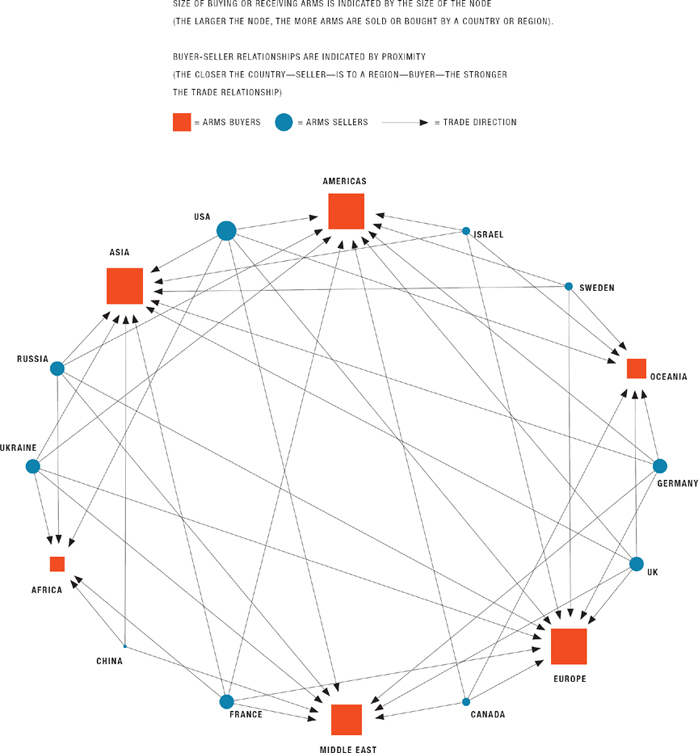
8. NETWORK ANALYSIS: GLOBAL TRADE IN ARMS
Conflict Resolution + Peacekeeping
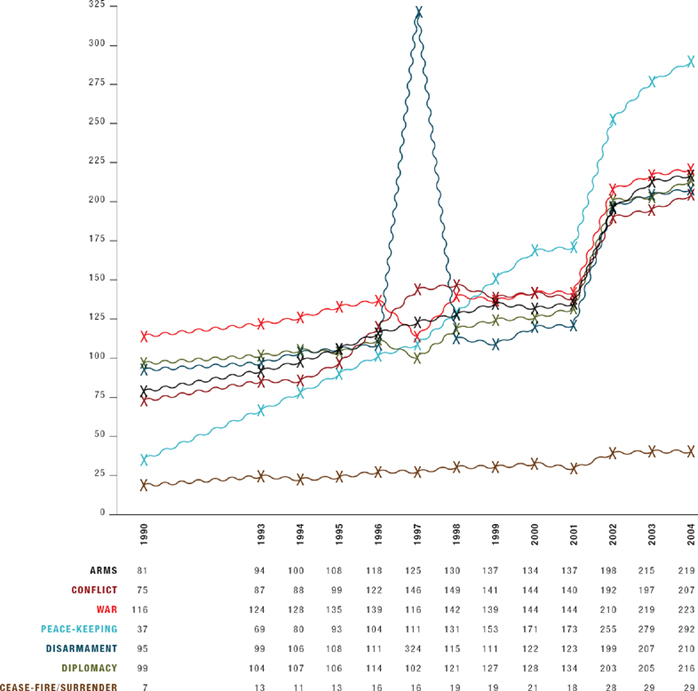
–# of conflict resolution by typology of conflict – # of organizations by area of concern – # of peace missions by type of organization 1995–2004 – multilateral peace missions by region 2004 – comparison of active peacekeeping ingo's by revenue 2002–2004 – food for peace: top 10 recipients 1995 + 2004 – total troop strength of un peacekeeping operations 1995–2004 – leading troop contributors to un peacekeeping missions 2004 – current un peacekeeping operations 2004
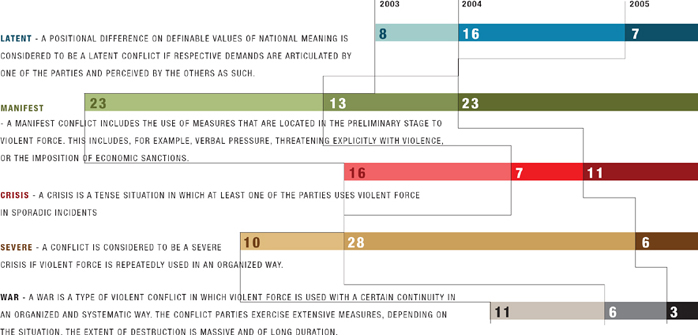
1. # OF CONFLICT RESOLUTIONS BY TYPOLOGY OF CONFLICT
2. # OF ORGANIZATIONS BY AREA OF CONCERN
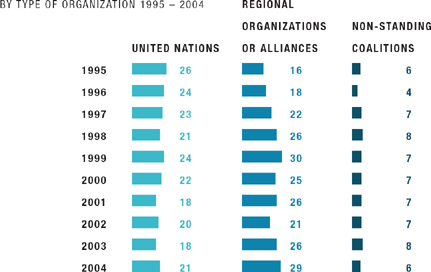
3. # OF PEACE MISSIONS
4. MULTILATERAL PEACE MISSIONS 2004
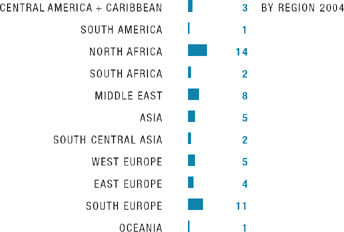
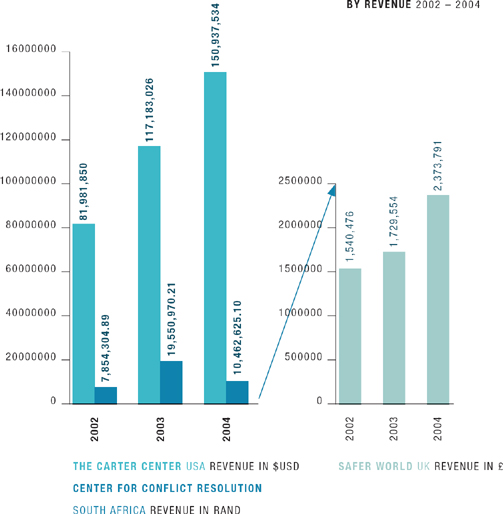
5. COMPARISON OF ACTIVE PEACEKEEPING INGOs
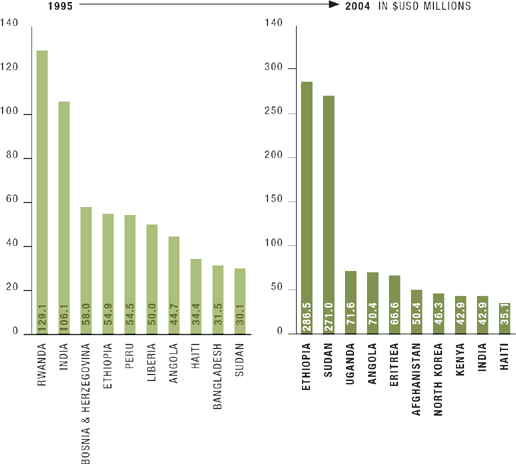
6. FOOD FOR PEACE: TOP 10 RECIPIENTS
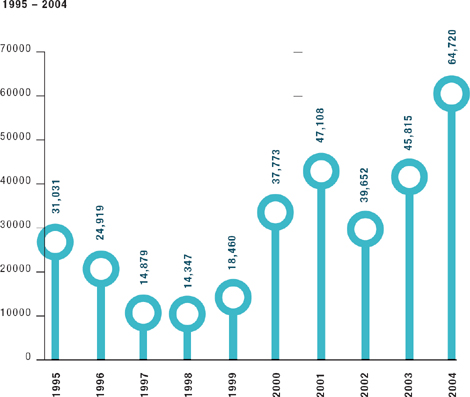
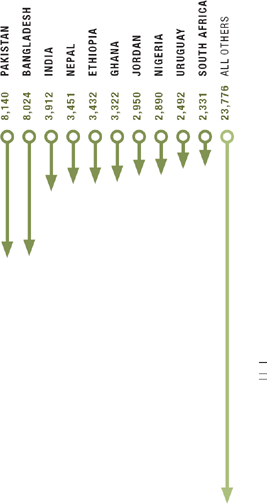
7. TOTAL TROOP STRENGTH OF UN PEACEKEEPING OPERATIONS
8. LEADING TROOP CONTRIBUTORS TO UN PEACEKEEPING MISSIONS 2004
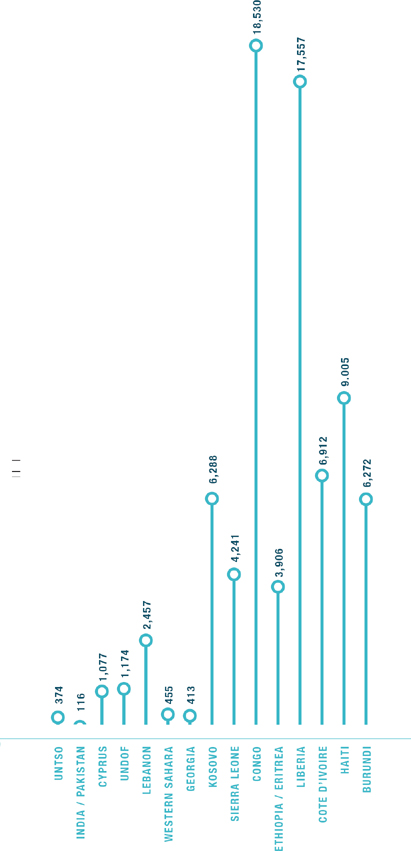
9. CURRENT UN PEACEKEEPING OPERATIONS 2004
Current Conflicts + Issues/Tensions
–the peace and conflict ledger 2005 – global trends in political discrimination 1950–2003 – global trends in economic discrimination 1950–2003 – global trends in political discrimination of minorities 1950–2003 – global trends in violent conflicts 1946–2004 – type of armed conflict worldwide 1946–2004 – evolution of different types of armed conflicts from 1964 to 2004 – levels of internationalized internal armed conflict 1946–2004 – # of deaths current ongoing conflict through 2005 - top 15 conflicts: average # of casualties per year through 2005
1. THE PEACE + CONFLICT LEDGER 2005
The Peace and Conflict Ledger lists the 161 larger countries in the world—all those with populations greater than 500,000 in 2005—and rates each country on seven indicators of capacity for building peace and managing potentially destabilizing political crises. We rate a country's peace-building capacity high insofar as it has managed to avoid outbreaks of armed conflicts while providing reasonable levels of human security, shows no active policies of political or economic discrimination against minorities, successfully managed movements for self-determination, maintained stable democratic institutions, attained substantial human and material resources, and is free of serious threats from its neighboring countries. Countries are listed by world region and, within each region, first, according to countries with current or recent episodes of armed conflict and, second, from lowest (red) to highest (green) peace-building capacity. Because many global trends in the qualities of peace have steadily improved since the early 1990s, some minor changes have been made to the Ledger to increase our ability to report differences among countries on certain indicators. These changes do not affect comparison of the current Ledger with previous editions of Peace and Conflict.
...
- Loading...
Get a 30 day FREE TRIAL
-
 Watch videos from a variety of sources bringing classroom topics to life
 -
Read modern, diverse business cases
-
Explore hundreds of books and reference titles

Read next

More like this
Sage Recommends
We found other relevant content for you on other Sage platforms.
Have you created a personal profile? Login or create a profile so that you can save clips, playlists and searches