
Theaster Gates: Artist as Catalyst for Community Development
Case
Teaching Notes
Supplementary Resources
Abstract
The case study describes the work of Theaster Gates to revitalize the South Side of Chicago. As an independent philanthropist and artist, Gates has engaged in “creative placemaking” to improve the predominantly African American neighborhood. Gates’ pioneering activities are fueled by a strong belief in the transformative power of art and a personal commitment to make his neighborhood a place he wants to stay and live even when he can afford to leave. Gates’ ability to straddle disparate worlds gives credibility to Gates’ philosophy about the power of artists to be creative and change the world. The case study allows students to analyze and discuss what Gates’ next steps should be and how he should successfully scale his efforts and organizations.
This case was prepared for inclusion in Sage Business Cases primarily as a basis for classroom discussion or self-study, and is not meant to illustrate either effective or ineffective management styles. Nothing herein shall be deemed to be an endorsement of any kind. This case is for scholarly, educational, or personal use only within your university, and cannot be forwarded outside the university or used for other commercial purposes.
2026 Sage Publications, Inc. All Rights Reserved
Resources
Exhibit 1: Key Landmarks and Buildings
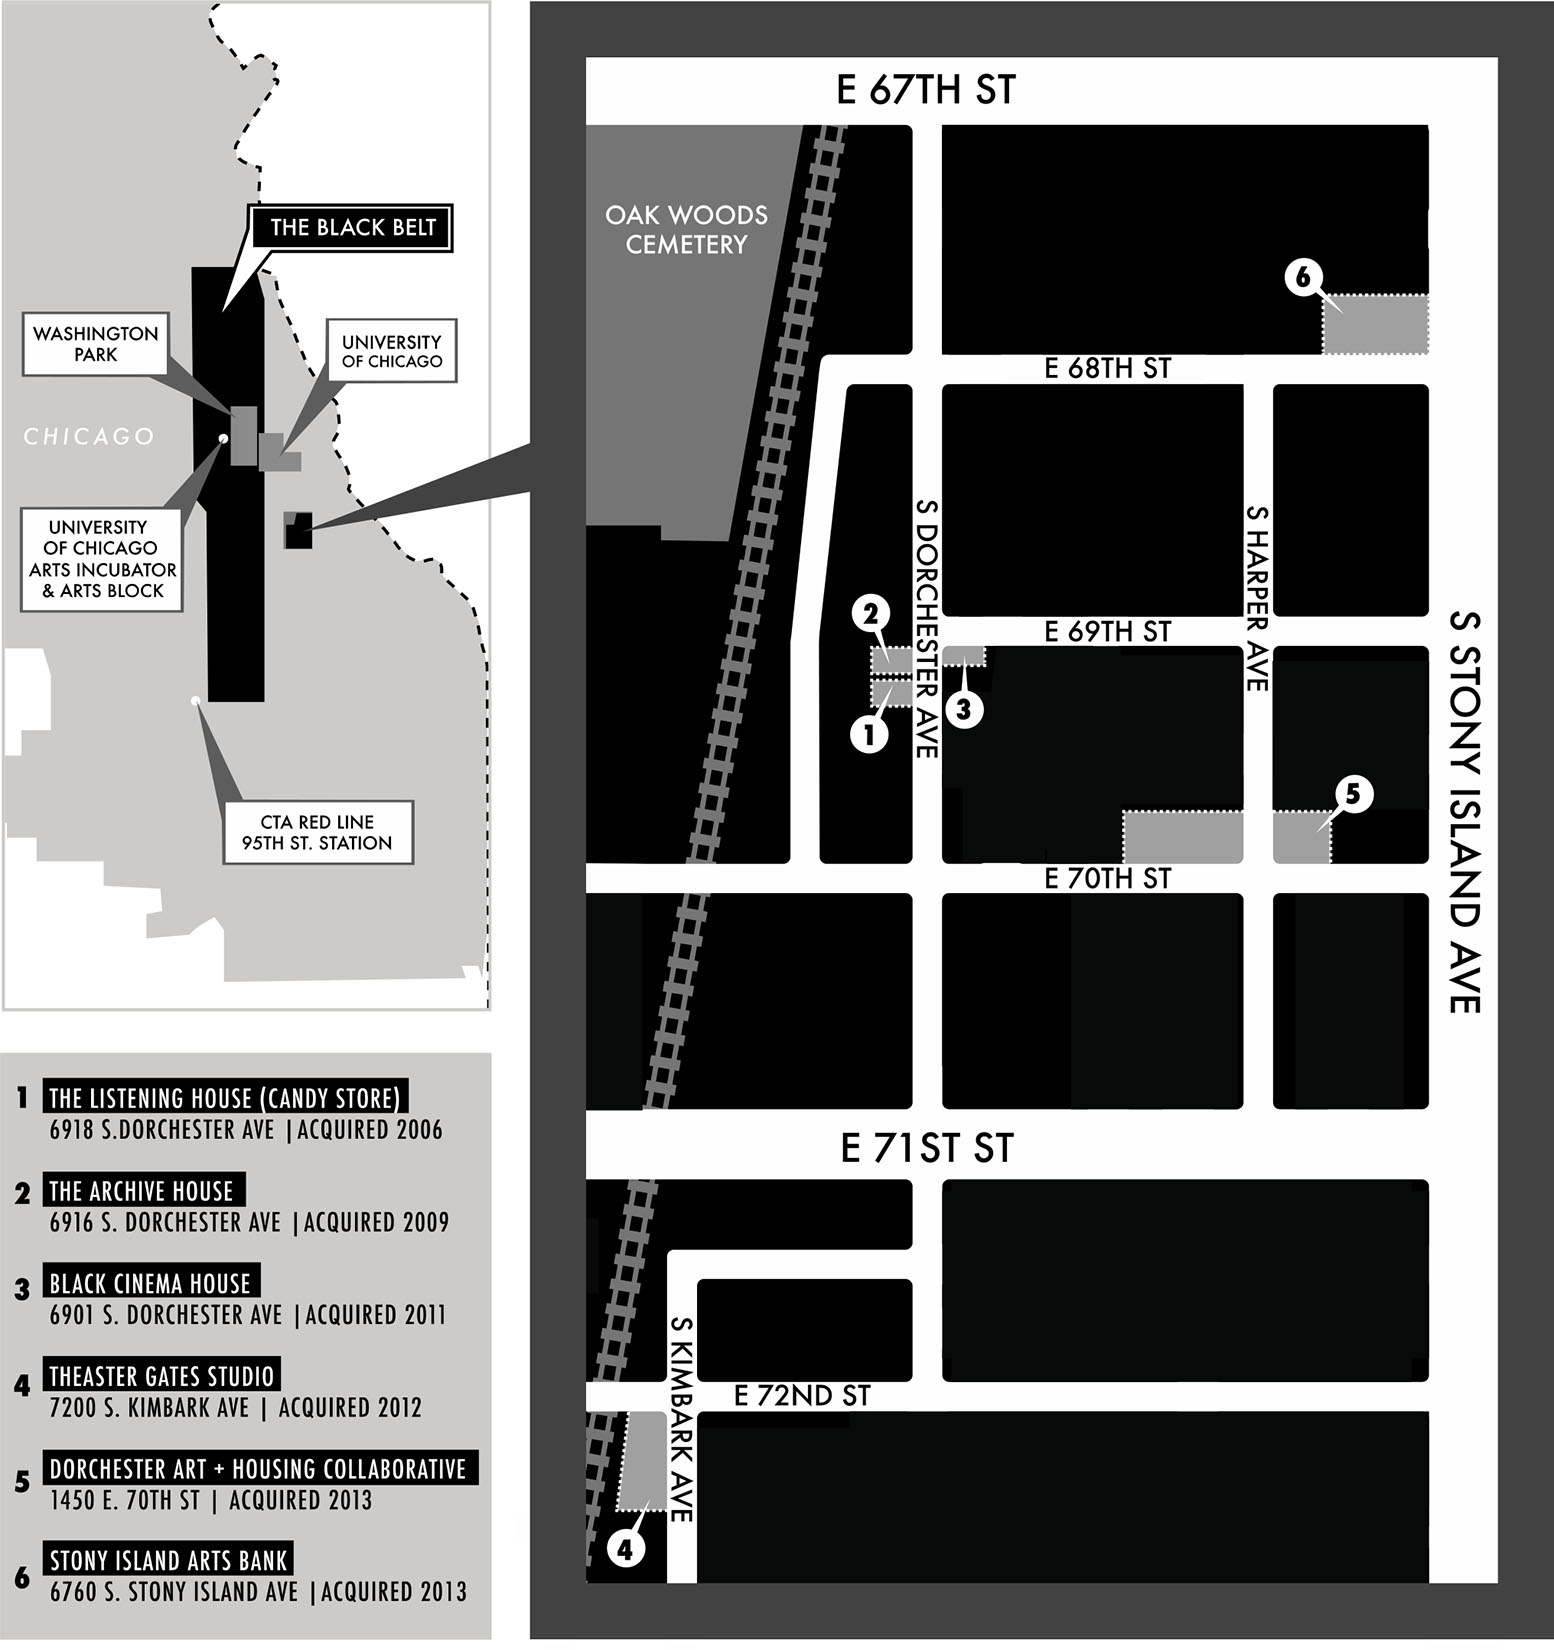
Gates owned a total of 10 properties in the Greater Grand Crossing neighborhood at the time of this case. Some of these buildings offered residential and studio space to artists-in-residence and staff working with Rebuild Foundation and Theaster Gates Studio.
Source: Grant Bloechl, www.grantbloechl.com.
Exhibit 2: Key Entities and Projects
Dorchester Projects
Dorchester Projects are a collection of four buildings centered around the 6900 block of South Dorchester Avenue. They include:
- The Listening House—a former candy store that now houses 8,000 vinyl records from Dr. Wax, a nearby record store that went out of business in 2010.
- Archive House—a former multi-family home that now houses 60,000 de-accessioned glass lantern slides from the University of Chicago’s Art History Department and the Prairie Avenue Bookstore collection—14,000 books on art and architecture obtained from a local bookstore that closed its doors in 2009.
- Black Cinema House—a former multi-family home that offers free bi-monthly public screenings of movies by and featuring African American artists to audiences of approximately 30 people.
- Stony Island Arts Bank—a former bank that at the time of this case was being renovated to house the 18,000 book Johnson Publishing Library. When completed, the building may also house an exhibition hall, performance space, offices for arts-related organizations, and a restaurant.
Rebuild Foundation
In 2009, the Rebuild Foundation began as a community advocacy organization in St. Louis, Missouri. Today in St. Louis, Rebuild manages programs such as art workshops and community gatherings out of two buildings. A public charity that received its ruling from the IRS in 2011, Rebuild took responsibility for managing the collections, designing and implementing programming for Dorchester Projects in Chicago. Regular offerings include bi-monthly film screenings, visiting hours for the collections, youth arts classes, and food-centered community gatherings such as potlucks and block parties. In addition to its operations in St. Louis and Chicago, Rebuild has an independent arm in Omaha, Nebraska that does similar programming. To date, Rebuild has received $375 K in funding from ArtPlace America and $150 K from the Joyce Foundation.
Dorchester Art +Housing Collaborative (DAHC): In 2013, Rebuild Foundation partnered with Brinshore Development to redevelop a former Chicago Housing Authority housing project located at 1450 E. 70th Street. DAHC will consist of 32 mixed-income rental units centered around a cultural facility. One third of the units will be allocated first-come-first-served to individuals on the Chicago Housing Authority waitlist; the other two thirds will be reserved for artists (one-third market rate units and one-third reserved for tenants earning less than 60 percent of the area median income). Rebuild Foundation has been conducting regular focus groups to update community members on the project and engage them around potential uses for the cultural space. Construction began in Fall 2013 and is expected to be completed by Fall 2014.
University of Chicago Arts Incubator
The University of Chicago Arts Incubator was initiated in January 2012 and opened in March 2013. Located at 301 East Garfield Boulevard in a University-owned building that had been vacant for decades, it was born out of the desire to foster better relations between the University of Chicago and its surrounding community. The Incubator’s primary public programming consists of visual art exhibitions, jazz performances, jam sessions, knitting circles, family art workshops, yoga, and talks. Attendees include a mix of community members, University of Chicago students, Chicago-based artists, and art lovers from around the city. In addition, the Incubator helps youth build carpentry skills through the Design Apprenticeship Program, and hosts artists-in-residence providing studio space, access to University facilities, and the opportunity to exhibit their work to the public. At the time of this case, the University of Chicago planned to expand its presence on the 300 East block of Garfield Boulevard to include a café and art spaces. The Theaster Gates Group LLC has leased a nearby vacant lot from the city upon which a public pavilion is to be erected.
Theaster Gates Studio
Theaster Gates Studio, a 24,375 square foot former Anheuser Busch distribution facility located at 7200 South Kimbark Avenue, is the home of Gates’ creative practice. A staff of five assists Gates with art production and management. In addition, 10 contractors handle project-based work, including the ongoing renovation of the building.
95th Street/Dan Ryan Red Line Station Commission: As part of the Chicago Transit Authority’s $240 million renovation of the 95th Street/Dan Ryan train station, Theaster Gates Studio LLC was commissioned to design and install a $1.3MM public art project: $1 million for design, fabrication, and installation; $250,000 for the artist fee; $50,000 for community engagement. Construction of the station is slated to begin in 2014 and last until 2016. The art project is anticipated to employ 10 people and include an apprenticeship program for local students.
Black Artists Retreat: In August 2013, Gates gathered more than 100 African American artists to facilitate inter-generational dialogue about the African American arts landscape, collaboration, and impact within the African American community. Hosted at The Listening House and Theaster Gates Studio, artists included MacArthur “genius grant” winners Carrie Mae Weems and Deborah Willis.
Source: Theaster Gates Studio; various.
Exhibit 3: History of Washington Park and Greater Grand Crossing
The majority of Theaster Gates’ work in Chicago takes place in two South Side neighborhoods: Washington Park and Greater Grand Crossing.
Washington Park
Washington Park, the location of the University of Chicago Arts Incubator, covers the one-and-a-half square miles from Cottage Grove to the Dan Ryan Expressway between 51st Street and 63rd Street. 1 A 372-acre park adjacent to the University of Chicago in the neighborhood’s northeast section is the neighborhood’s namesake.
The 2010 U.S. Census recorded population of 11,717, a 79 percent decline from Washington Park’s 1950 population of 56,856. The neighborhood is primarily residential and was once the site of approximately one-third of the Robert Taylor Homes, which at 4,400 units was the largest public housing project in the world. 2 The city of Chicago currently owns 545 vacant lots within the neighborhood; there are an additional 228 vacant or abandoned properties. 3
Greater Grand Crossing
Greater Grand Crossing, the location of the Dorchester Projects, the Stony Island Arts Bank and Theaster Gates Studio, covers three and one-half square miles from Wallace Street to Kenwood Avenue between 61st Street to 79th street. 4 Located just south of Washington Park, Greater Grand Crossing is also a predominantly residential area. The neighborhood includes the 183-acre Oak Woods Cemetery. In 2010, the neighborhood population was 32,602, a 47 percent decline from its 1950 peak of 61,753. 5 The City owns 359 vacant lots in Greater Grand Crossing; there are an additional 1,028 vacant or abandoned properties in the area. 6
History
During the American Civil War, Chicago emerged as an industrial hub due to its rivals’ (St. Louis and Cincinnati) initial proximity to the front lines and trade stoppages along the Mississippi and Ohio rivers. Chicago became the North’s meatpacking and wheat distribution center. Heavy industry soon followed in the form of steel, manufacturing, and railroads. From 1861 to 1870, the number of factories tripled and the city’s population increased threefold as available jobs attracted an influx of Irish and German immigrants. 7 Chicago was also a terminus on the Underground Railroad during the 1800s, and home for a growing African American population.
When Chicago’s elevated railway lines expanded public transportation to South 63rd Street in the 1893, Washington Park and Grand Boulevard, its northern neighbor, became desirable residential areas for Irish and German families. African Americans moved into the westernmost corridor of both neighborhoods where proximity to the Rock Island railroad tracks depressed housing prices.
World War I triggered a substantial increase in Chicago’s African American population as immigration halted, existing laborers enlisted, and heavy industry turned to women and African Americans as replacement labor sources. Southern African Americans moved north seeking industrial employment. As the African American population expanded, so did its real estate footprint, creating racial tension that led to the Race Riot of July 1919.
Predominantly Irish street gangs burned down African American-occupied homes west of Wentworth Avenue and created a boundary for the African American population that coincides with Washington Park’s current western border. 8 Three months later, nearly 1,200 white residents of Grand Boulevard gathered to protest the increasing number of African Americans in their neighborhood. 9 Their slogan, “They Shall Not Pass” referred to passing beyond Grand Boulevard (now Martin Luther King Jr. Drive), one of the most expensive streets in the area and what soon emerged as the African American community’s eastern boundary.
The hostility both east and west pushed the African American population southward and led to what became known as the “Black Belt.” An area originally bounded by 22nd Street, Wentworth Avenue, 31st Street and Grand Boulevard that eventually pushed southward to 95th street and eastward to Cottage Grove. 10 No official policy or plan created the African American Belt. It reflected the African American population’s response to rapid growth, racial tensions which limited movement eastward or westward, and real estate prices which limited expansion northward into a predominantly commercial area.
By the 1930s, the Black Belt contained over 60 percent of Chicago’s 250,000 African American residents, or approximately 150,000 people. 11 That figure grew to nearly 175,000 by 1950, a very high density for an area with only two-story dwellings. 12 The combination of overcrowding and a growing number of African Americans who could afford to purchase homes spawned an exodus. Those who could afford to moved southward to neighborhoods like Greater Grand Crossing, which had been occupied mostly by Irish and Jewish communities. From 1930 to 1950, Greater Grand Crossing saw an increase of African American residents to 86 percent from six percent. 13
The Black Belt was about to experience more changes in the 1960s due to two major developments: the Dan Ryan Expressway and the Robert Taylor Homes. The Dan Ryan Expressway was built along Wentworth Avenue in 1961-62. “Residents were effectively sealed off from jobs, facilities, and the white residents on the other side of the 10-lane highway.” 14 The Dan Ryan solidified the Black Belt’s western boundary, isolating and segregating the community.
In 1962, the city’s effort to combat overcrowding in the Black Belt led to the Robert Taylor Homes, which became the largest public housing project in the world with 28 buildings, each 16-stories tall, spanning from 39th street to 54th street. Now known as one of the Chicago Housing Authority’s greatest failures, over 80 percent of its 4,400 units had three to five bedrooms and “placing enormous numbers of children and relatively few adults in high-rise buildings resulted in widespread social disorder.” 15
Security became a primary concern in the projects and, by extension, Washington Park. During the 1960s, increased handgun ownership, a greater proportion of baby boomer teenagers, and de-industrialization led to a nationwide increase in crime. This crime wave hit Chicago hard as the number of annual homicides per 100,000 residents more than doubled to 24 from 10.3 over the course of the decade. The situation grew worse within Chicago’s housing projects as street gangs took control of high-rise buildings and began to sell narcotics in the 1970s.
By the 1980s, “inoperable elevators, erratic heat, leaky roofs, uncollected garbage, infested apartments, darkened hallways, and unrepaired playground equipment were norms, not aberrations” within the city’s public housing. 16 Ten percent of families in public housing reported employment and 73 percent relied on public aid. 17 Ninety-five percent of public housing residents were African American and only seven percent of resident families contained two parents. 18
City spending on antidrug and security initiatives within housing projects grew to $80 million in 1995 from $7 million in 1986. 19 By then it was clear that the projects needed to be replaced with a better solution to the city’s housing problems. Since the 1990s, 18 of Chicago’s 27 public housing projects have been demolished and all but one of the remaining nine have been significantly renovated.
Recent Statistics
Population within Washington Park and Greater Grand Crossing fell steadily from the 1950s through 2010 until each neighborhood housed 21 percent and 53 percent of its former number of residents, respectively. 20 Families moved out to avoid the crime, poverty, and substandard living conditions that were anchored by the more than 2,500 public housing units within the two neighborhoods. Public housing residents were displaced by demolition and renovation processes, and the Section 8 voucher program, a subsidy intended to help low-income families afford market-rate housing in response to the decreased supply of publicly owned units, didn’t help stabilize the local population because Washington Park and Greater Grand Crossing lacked the multi-family housing stock to keep these residents in the neighborhoods.
In the wake of the 2008 housing bubble, Washington Park and Greater Grand Crossing are the site of 773 and 1,387 vacant or abandoned properties, respectively. 21 That is a combined 12 percent of the city’s estimated 18,000 vacant or abandoned properties despite only accounting for 2 percent of the city’s footprint by square mileage.
Respectively, four and sixteen homicides occurred in each neighborhood during 2013, more than two and three times the Chicago average per 10,000 residents of 1.6 homicides. 22 Statistics for other violent crimes were similar with Washington Park and Greater Grand Crossing respectively having 414 and 850 incidents during 2013, 2.8 and 3.8 times the city average per 1,000 residents of 9.2 incidents. 23
Per capita income is $13,087 and $17,213 respectively while the Chicago average is $27,148. 24 Thirty-nine percent and 26 percent of residents live below the poverty line, and local unemployment rates are 23 percent and 19 percent, respectively. 25 In comparison, 19 percent of the city’s households live below the poverty level and Chicago’s unemployment rate is 11 percent. 26
Exhibit 4: Chronology
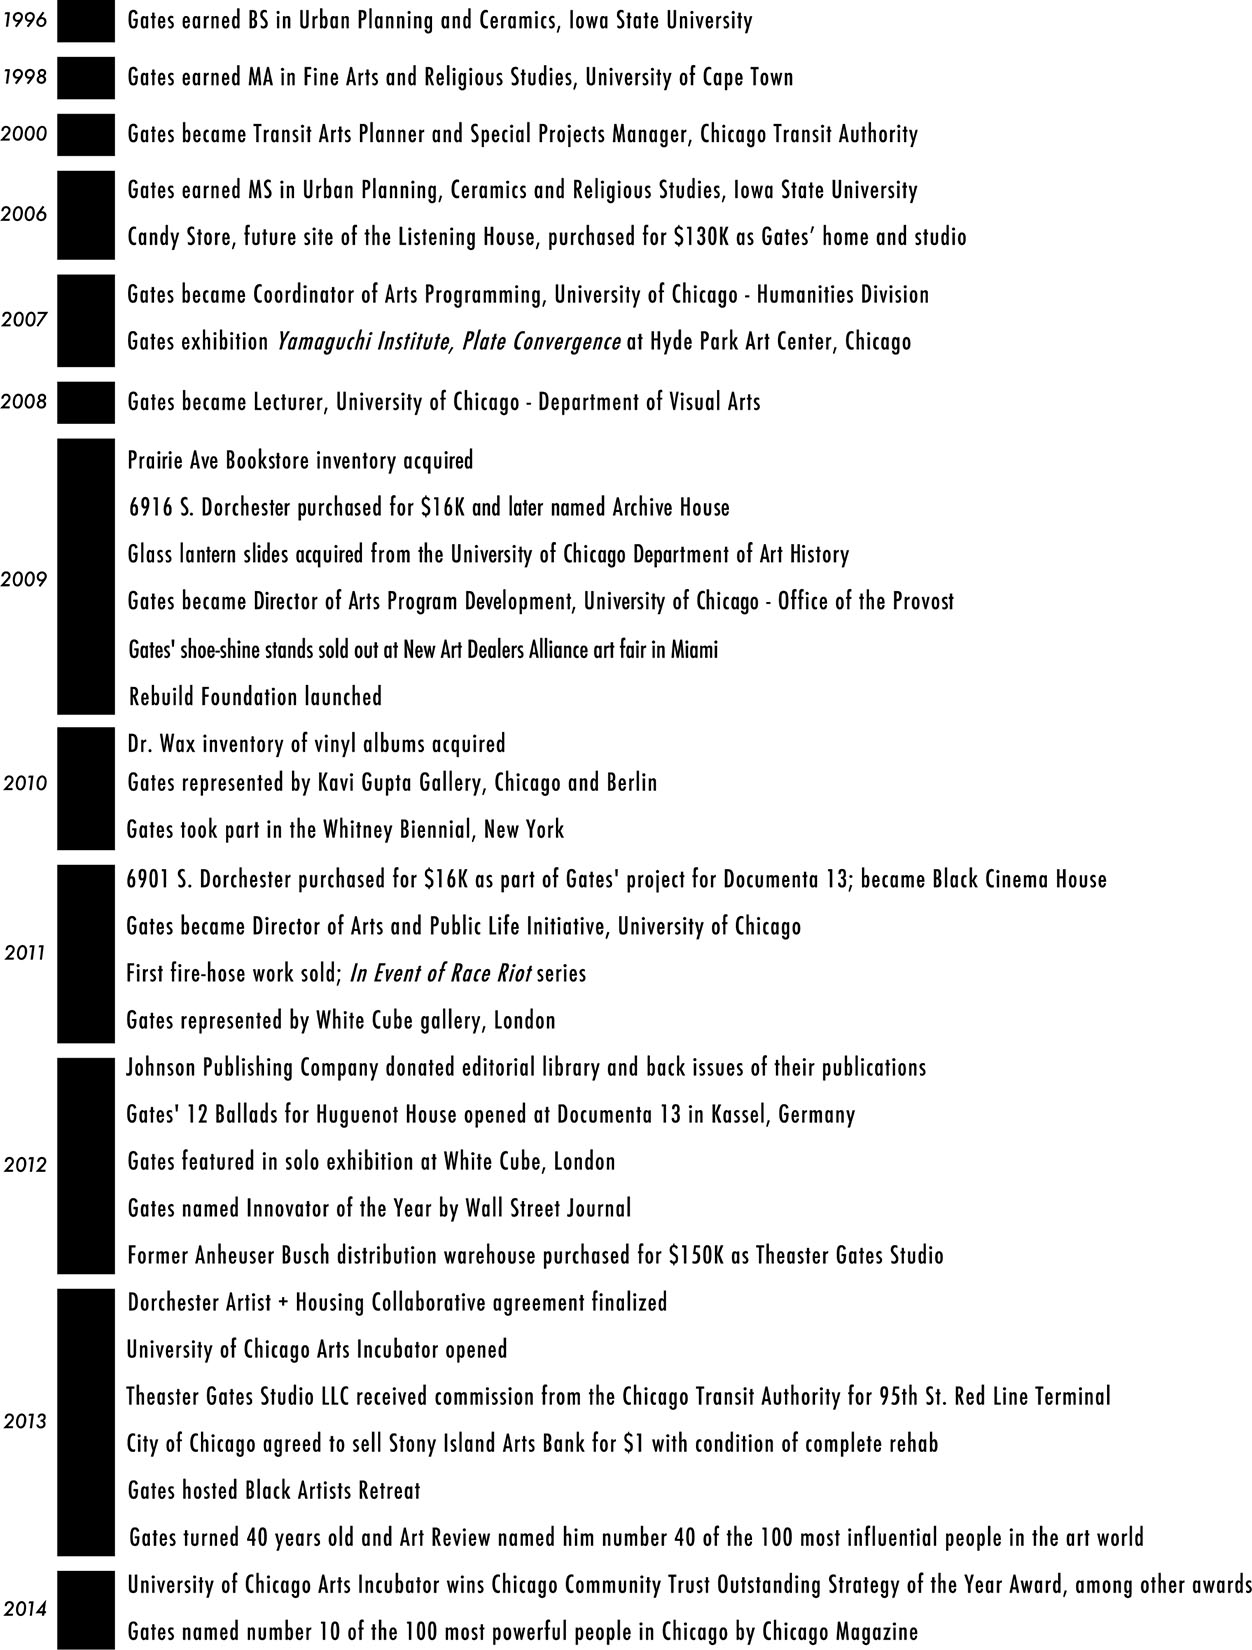
Source: Theaster Gates Studio; various.
Exhibit 5: Creative Placemaking
In their 2010 white paper “Creative Placemaking,” 27 Ann Markusen and Anna Gadwa explain that, “In creative placemaking, partners from public, private, non-profit, and community sectors strategically shape the physical and social character of a neighborhood, town, city, or region around arts and cultural activities. Creative placemaking animates public and private spaces, rejuvenates structures and streetscapes, improves local business viability and public safety, and brings diverse people together to celebrate, inspire, and be inspired.”
The paper profiles 14 case studies from urban and rural locations across the U.S., representing 20 years of experience of how “creative locales foster entrepreneurs and cultural industries” contributing meaningfully to the economies of neighborhoods, cities, and states. The arts help attract and retain non-arts businesses, skilled workers, and wealthy retirees who contribute to the financial health of a place.
But the arts have the power to do more than make a financial contribution to the local economy. The arts are a big part of a neighborhood or town’s “livability.” The arts can breathe life back into empty downtowns, attract visitors to forgotten blocks, make a city more hospitable and fun. The arts create common bonds among neighbors and between neighborhoods. The arts help develop the heart and soul as well as the health and wealth of communities.
ArtPlace America, a national coalition of 14 foundations, 6 financial institutions and 8 federal government agencies describes successful creative placemaking as having a number of characteristics including:
- fostering economic diversity and integration
- contributing to a mix of uses and people that makes places more diverse, interesting, and active
- creating safer places that foster a sense that everyone is welcome
- offering a vision of a different and better future.
To measure the progress of creative placemaking efforts, ArtPlace America has developed “Vibrancy Indicators” 28 to assess change and impact at a neighborhood level. The indicators are divided into three broad areas: People, Activity, and Value. (Note: These indicators are still a work in progress and data is currently being gathered on appropriate value indicators).
ArtPlace Vibrancy Indicators
People Indicators
| # | Variable | Source | Geography |
| 1 | Population | Census | block |
| 2 | Workers in Creative Occupations | ACS | tract |
| 3 | Employment Rate | LEHD/Census | block |
Activity Indicators
| # | Variable | Source | Geography |
| 4 | Indicator Businesses | DB | point |
| 5 | Jobs | LEHD | block |
| 6 | Walkscore | FrontSeat | Point |
| 7 | Mixed Use | LEHD | block |
| 8 | Cell Activity | Spotrank | 100m |
| 9 | Independent Business | DB | point |
| 10 | Creative Industry Jobs | ZBP | zip code |
- Population Density. Population measures the number of persons living in a neighborhood. Rationale: Vibrant neighborhoods contain a density of local population. Increasing population is an indicator of increasing vibrancy. 29
- Percentage of Workers in Creative Occupations. This measure counts the fraction of working neighborhood residents who report that their occupation is either in the category “artists, writers, entertainers” or the category “architects, engineers, and designers.” These data are collected by place of residence, not place of work, and include self-employed persons. Rationale: Vibrant neighborhoods have higher than average concentrations of residents who are employed in the arts, writing, performing and other similar occupations. 30
- Employment Rate. The employment-population ratio measures the economic well-being and engagement of the local population. It is constructed by counting the number of employed residents living in a particular geography (Census Block) and dividing that number by the working age persons living on that same block. The employment population ratio is computed as the number of employed local residents divided by 2010 working age population (18 to 64). Rationale: Vibrant neighborhoods have a high fraction of their residents of working age who are employed. Increases in vibrancy are evidenced by increases in the fraction of the working age population who are employed. 31
- Number of Indicator Businesses. Indicator businesses are those businesses most associated with vibrancy. They are businesses that represent destinations of choice for cultural, recreational, consumption or social activity. Indicator business density is a count of the number of indicator businesses in each cell. Rationale: Vibrant areas have high concentrations of indicator businesses. Indicator businesses include firms in 45 selected industry codes including eating and drinking places, shops, personal service establishments and other businesses that cater to consumers. 32
- Number of Jobs in the Community. Our employment measure counts the number of jobs at businesses in a neighborhood. Jobs are measured by place of employment, not by place of residence, and job holders may or may not be neighborhood residents. Rationale: Vibrant neighborhoods have abundant local job opportunities. Increases in employment are an indicator of improving vibrancy. Definition: Number of jobs in each cell, by place of work. 33
- Walkability (Walk Score). Walk Score measures the walkability of a neighborhood, based on the presence and proximity of walkable destinations. Rationale: Vibrant neighborhoods have many destinations within walking distance. Our measure looks at the pervasiveness and distribution of walkability throughout an area by computing the Walk Score for a number of points in the neighborhood. 34
- Number of Mixed Use Blocks. The Mixed Use Indicator measures the extent to which a particular area is dominated by residential activity or employment activity or whether it is a balance of the two. Rationale: Vibrant neighborhoods contain a mix of jobs and residences. The mixed use measure is computed as the fraction of Census blocks with non-zero levels of reported employment and resident population. 35
- Cell Phone Activity. This measure captures the relative level of cell phone activity in an area on nights and weekends. Rationale: Vibrant neighborhoods have relatively high levels of activity on nights and weekends and are places people congregate away from home and outside of regular 9 to 5 business hours. Our underlying data scores each 100-meter square cell in every metropolitan area on a scale of 1 to 10 based on the level of cell phone activity for each of 168 hours in a given week. Our indicator will be the average score for hours after 5 p.m. on Friday and all day Saturday and Sunday. This will indicate the amount of activity occurring outside regular workday hours. 36
- Percentage of Independent Businesses. The independent business measure computes the number and share of local businesses that are not part of national chains. Rationale: Vibrant neighborhoods have more locally owned independent businesses. This measure is calculated by examining the ownership of eating places. Eating places (restaurants, fast food establishments, and similar businesses) are the most numerous and widespread indicator businesses. We identified the 200 largest national eating place chains and treated all other businesses as locally owned. 37
- Number of Creative Industry Jobs. This measure estimates the number of persons employed at businesses in arts, entertainment, media, and related industries. These data are computed by place of work, not by place of residence, and include wage and salary workers for firms with a payroll, but not self-employed persons and businesses with no taxable payroll. Rationale: Vibrant neighborhoods have higher than average concentrations of workers employed in businesses that involve information, media, arts, and creative endeavors. 38
Source: http://www.artplaceamerica.org/vibrancy-indicators/#sthash.tNSmvpQ8.dpuf.
Exhibit 6: Ecosystem
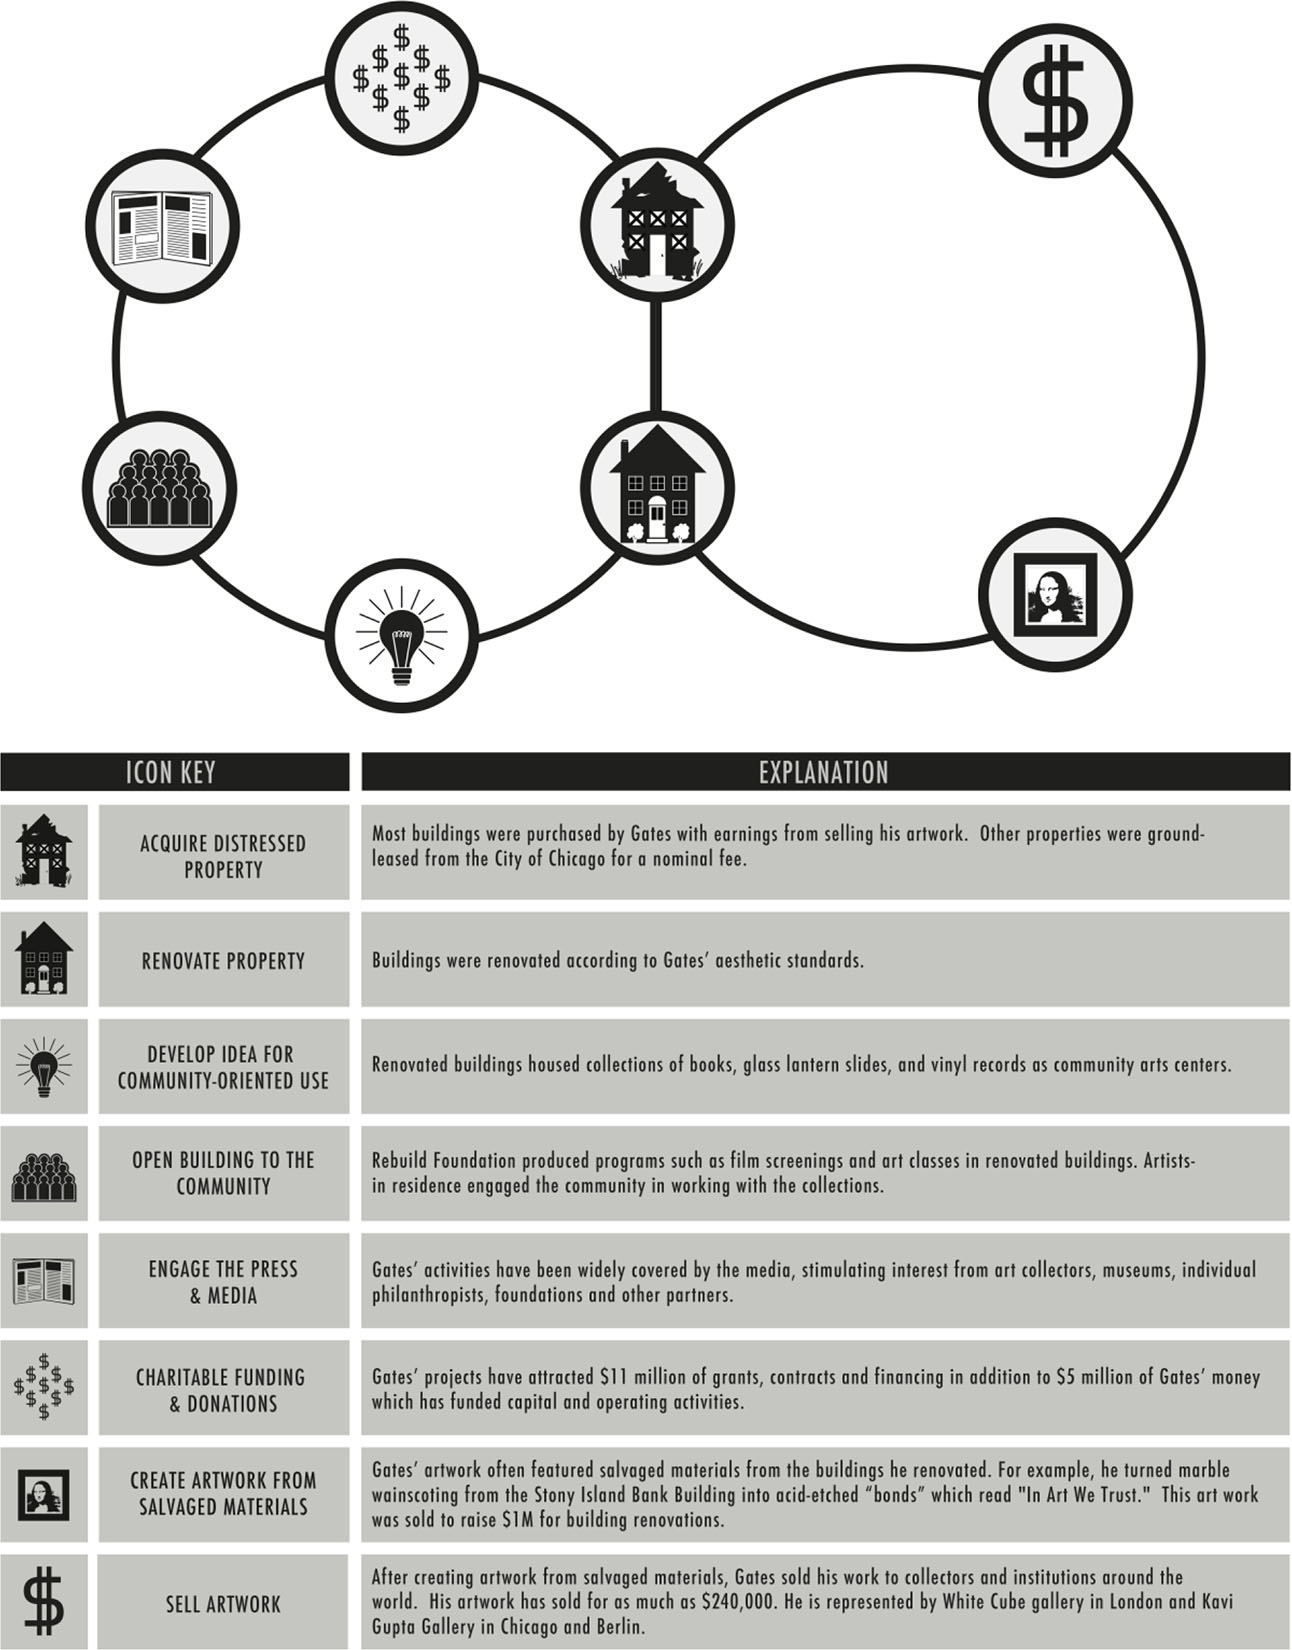
This depiction of the Ecosystem illustrates most of Gates’ activities at the time of this case. Gates’ social practice seeks to address a range of community needs—for example, a lack of jobs or a de-accessioned collection of books in need of a home, as well as reactivating abandoned buildings.
Source: Grant Bloechl, www.grantbloechl.com.
Notes
1. http://crime.chicagotribune.com/chicago/community/washington-park.
2. Bowly, D. The Poorhouse: Subsidized Housing in Chicago 1978.
3. https://data.cityofchicago.org/.
4. http://crime.chicagotribune.com/chicago/community/greater-grand-crossing.
5. U.S. Census data.
6. https://data.cityofchicago.org/.
7. http://www.encyclopedia.chicagohistory.org/pages/2379.html.
8. Pacyga, D. Chicago City of Neighborhoods: Histories and Tours 1986.
9. Ibid.
10. http://www.encyclopedia.chicagohistory.org/pages/140.html.
11. Pacyga, D. Chicago City of Neighborhoods: Histories and Tours 1986.
12. Ibid.
13. http://www.encyclopedia.chicagohistory.org/pages/547.html.
14. Keating, A. Chicago Neighborhoods and Suburbs: A Historical Guide 2008.
15. Hunt, D. Blueprint for Disaster: The Unraveling of Chicago Public Housing 2009.
16. Ibid.
17. Ibid.
18. Ibid.
19. Ibid.
20. U.S. Census data.
21. https://data.cityofchicago.org/.
22. Ibid.
23. Ibid.
24. U.S. Census data.
25. Ibid.
26. Ibid.
27. http://arts.gov/publications/creative-placemaking.
28. Source: http://www.artplaceamerica.org/vibrancy-indicators/.
29. Census 2010 Geographic Detail: Census Block/block.
30. American Community Survey Geographic Detail: Census Tract Activity Indicators.
31. LEHD (employed persons, residence basis), Census (population) Geographic Detail: Census Block.
32. Business Database, Selected SIC codes Geographic Detail: Street Address.
33. LEHD Geographic Detail: Census Bock.
34. FrontSeat Geographic Detail: Points (Street addresses).
35. Computed from LEHD (jobs), Census 2010 (population) Geographic Detail: Census Block.
36. SpotRank Geographic Detail: 100-meter cells.
37. Business Database, Selected SIC codes Geographic Detail: Street Address.
38. Zip Business Patterns Geographic Detail: Zip Code.
This case was prepared for inclusion in Sage Business Cases primarily as a basis for classroom discussion or self-study, and is not meant to illustrate either effective or ineffective management styles. Nothing herein shall be deemed to be an endorsement of any kind. This case is for scholarly, educational, or personal use only within your university, and cannot be forwarded outside the university or used for other commercial purposes.
2026 Sage Publications, Inc. All Rights Reserved
Get a 30 day FREE TRIAL
-
 Watch videos from a variety of sources bringing classroom topics to life
 -
Read modern, diverse business cases
-
Explore hundreds of books and reference titles

Read next

More like this
Sage Recommends
We found other relevant content for you on other Sage platforms.
Have you created a personal profile? Login or create a profile so that you can save clips, playlists and searches