

The Indian Express: Reinvention Through Digital Business
Case
Teaching Notes
Supplementary Resources
Abstract
At the turn of mid-2000, the news industry saw a tectonic shift in the reading habits of people, driven by developments in digital technology. News industry’s traditional business model of relying on advertisement income was majorly disrupted. This led to a steep decline in revenues from the print business. The case describes the strategy and organization-building initiatives of a leading newspaper in India, as it transitioned from a print newspaper media ecosystem to a digital news ecosystem. Anant Goenka, a third-generation member of the family, led the digital foray. While Anant created a USD 20 million digital business in 4 years, the path toward the next goal of achieving a topline of USD 150 million in the next 7–8 years was not clear. Furthermore, it might entail transforming the Indian Express Group, with close to 90 years of legacy of strong editorial ideologies, to adapt and embrace the rules of the game of the digital ecosystem. This case presents an excellent opportunity to learn the nature and extent of the challenges involved in building and scaling up a digital news business, including the transition from a traditional newspaper business.
This case study is provided in this Sage Business collection primarily as a basis for classroom discussion or self-study and is not meant to illustrate either effective or ineffective management styles. Nothing herein shall be deemed to be an endorsement of any kind. This case study is for scholarly, educational, or personal use only within your university, and cannot be forwarded outside the university or used for other commercial purposes.
© 2026 Sage Publications, Inc. All Rights Reserved.
Resources
Exhibit 1. Digital Reach of the Indian Express Group
A. Average monthly page views (in million)
2011 | 2012 | 2013 | 2014 | 2015 | 2016 | 2017 | |
indianexpress.com | 10.4 | 9.9 | 21 | 40.6 | 66.3 | 109 | 168 |
financialexpress.com | 1.7 | 1.4 | 1.6 | 5.7 | 5.1 | 26 | 30 |
jansatta.com | – | 0.16 | 0.25 | 0.41 | 1 | 6.3 | 44.7 |
loksatta.com | 3.4 | 3.7 | 4.2 | 8.5 | 12 | 18.5 | 47 |
Source: Indian Express Digital.
Source: ComScore multiplatform numbers, July 2017.
Source: Comscore desktop platform numbers, July 2017.
Source: ComScore desktop platform numbers, September 2017.
Source: Comscore multiplatform, March 2018.
Source: Comscore multiplatform, August 2017.
Source: Comscore multiplatform, March 2018.
Source: Comscore multiplatform, March–April 2018.
B. Data comparing the digital reach of the Indian Express Group and competitor groups
Sr.no. | Digital properties | Unique visitors (in ‘000) |
1 | The Times of India sites | 82,273 |
2 | The Indian Express Group | 56,391 |
3 | India Today Group | 55,508 |
4 | india.com sites | 49,458 |
5 | NDTV | 47,151 |
6 | HT Media Group | 45,985 |
7 | Bhaskar Group sites | 37,597 |
8 | Jagran sites | 36,763 |
9 | oneindia.com sites | 33,868 |
10 | dailyhunt.in | 29,265 |
Source: ComScore multiplatform numbers, July 2017.
Source: Comscore desktop platform numbers, July 2017.
Source: ComScore desktop platform numbers, September 2017.
Source: Comscore multiplatform, March 2018.
Source: Comscore multiplatform, August 2017.
Source: Comscore multiplatform, March 2018.
Source: Comscore multiplatform, March–April 2018.
C. Data comparing the digital reach of indianexpress.com with that of other flagship dailies
Sr.no. | Digital properties | Unique visitors (‘000) |
1 | The Times of India sites | 15,080 |
2 | The Indian Express Group | 12,533 |
3 | india.com sites | 9696 |
4 | India Today Group | 9524 |
5 | NDTV | 9110 |
6 | HT Media Group | 7412 |
7 | News 18 | 6510 |
8 | firstpost.com | 5667 |
9 | The Economic Times | 4627 |
10 | Jagran sites | 4307 |
11 | oneindia.com sites | 4270 |
12 | The Hindu Group | 4057 |
13 | Dotdash | 3967 |
14 | Bhaskar Group sites | 2707 |
15 | ABP News Network | 2249 |
16 | Yahoo-ABC News Network | 2097 |
Source: Comscore desktop platform numbers, July 2017.
Source: ComScore desktop platform numbers, September 2017.
Source: Comscore multiplatform, March 2018.
Source: Comscore multiplatform, August 2017.
Source: Comscore multiplatform, March 2018.
Source: Comscore multiplatform, March–April 2018.
D. Top Hindi news websites
Hindi news website | Monthly unique visitors (‘000) |
bhaskar.com | 2193 |
jansatta.com | 1977 |
AajTak | 1695 |
jagran.com | 1602 |
Navbharat Times | 1205 |
Amar Ujala | 1196 |
NDTV Khabar | 883 |
Source: ComScore desktop platform numbers, September 2017.
Source: Comscore multiplatform, March 2018.
Source: Comscore multiplatform, August 2017.
Source: Comscore multiplatform, March 2018.
Source: Comscore multiplatform, March–April 2018.
E. Top business news websites
Business news website | Monthly unique visitors (‘000) |
The Economic Times | 21,771 |
The Financial Express | 15,261 |
moneycontrol.com | 12,491 |
NDTV Profit | 8502 |
Business Standard | 7168 |
Mint | 6546 |
Business Today | 4994 |
Source: Comscore multiplatform, March 2018.
Source: Comscore multiplatform, August 2017.
Source: Comscore multiplatform, March 2018.
Source: Comscore multiplatform, March–April 2018.
F. Top Marathi news websites
Marathi news website | Unique visitors (‘000) |
Loksatta | 3786 |
Maharashtra Times | 3217 |
Lokmat | 1272 |
ibnlokmat.tv | 604 |
eSakal.com | 519 |
Source: Comscore multiplatform, August 2017.
Source: Comscore multiplatform, March 2018.
Source: Comscore multiplatform, March–April 2018.
G. Top Malayalam news websites
Malayalam news website | Unique visitors (‘000) |
Manorama Online | 3596 |
mathrubhumi.com | 372 |
iemalayalam.com | 330 |
mangalam.com | 43 |
Source: Comscore multiplatform, March 2018.
Source: Comscore multiplatform, March–April 2018.
H. InUth.com unique visitors
Total unique visitors | 953,000 |
Total views | 8 million |
Total minutes | 2 million |
Reach (%) | 0.3% of the total digital population |
Average minutes per visit | 2.1 |
Source: Comscore multiplatform, March–April 2018.
Exhibit 2. Most-read Indian Newspapers in English, Hindi and Marathi
A. English dailies
Title | Readership (in ‘000) |
The Times of India | 13,047 |
Hindustan Times | 6847 |
The Hindu | 5300 |
The Economic Times | 3103 |
Mumbai Mirror | 1813 |
The Indian Express | 1599 |
The Telegraph | 1558 |
The New Indian Express | 1507 |
The Tribune | 1490 |
Deccan Chronicle | 1389 |
Source: Indian Readership Survey, 2017.
Source: Indian Readership Survey, 2017.
Source: Indian Readership Survey, 2017.
B. Hindi dailies
Title | Readership (in ‘000) |
Dainik Jagran | 70,377 |
Hindustan | 52,397 |
Amar Ujala | 46,094 |
Dainik Bhaskar | 45,105 |
Rajasthan Patrika | 16,326 |
Prabhat Khabar | 13,492 |
Punjab Kesari | 12,232 |
Patrika | 9823 |
Navbharat Times | 7641 |
Nai Dunia | 6386 |
Source: Indian Readership Survey, 2017.
Source: Indian Readership Survey, 2017.
C. Marathi dailies
Title | Readership (in ‘000) |
Lokmat | 18,066 |
Sakal | 10,498 |
Punya Nagari | 9520 |
Pudhari | 7273 |
Loksatta | 3794 |
Source: Indian Readership Survey, 2017.
Exhibit 3. Global Trends in the News Publishing Industry
A. Print advertising and circulation revenue, 2012–2016
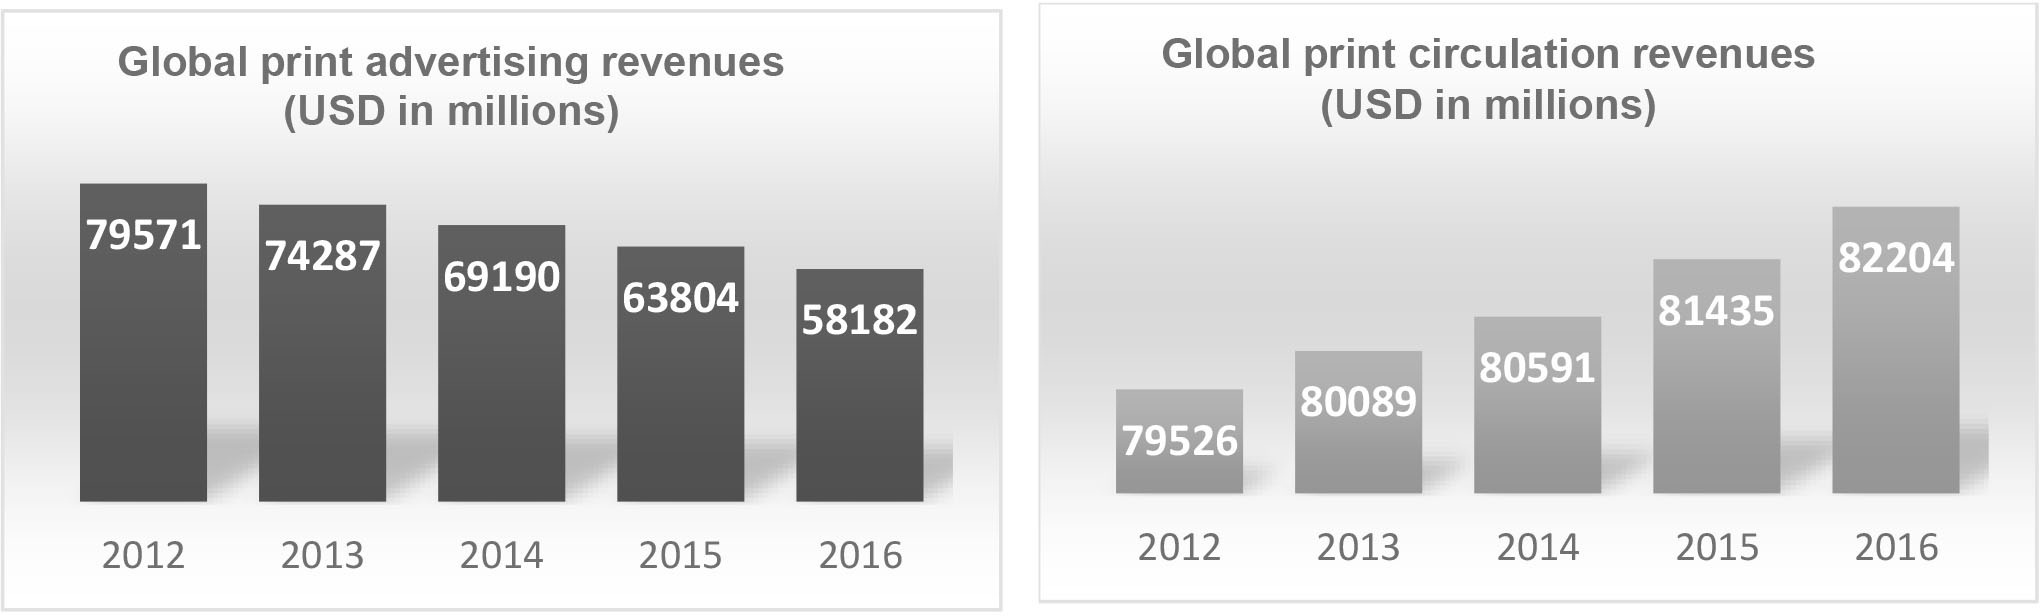
The bar graph on the left shows the comparison of the print advertising revenues. The horizontal axis lists the years and ranges from 2012 to 2016. The data from the graph are tabulated below.
The bar graph on the right shows the comparison of the print circulation revenues. The horizontal axis lists the years and ranges from 2012 to 2016. The data from the graph are tabulated below.
Years | 2012 | 2013 | 2014 | 2015 | 2016 |
Revenues (U S D in millions) | 79526 | 80089 | 80591 | 81435 | 82204 |
Source: WAN-IFRA WPT analysis, Zenith, PwC Global Entertainment and Media Outlook, 2017–2021.
B. Digital advertising and circulation revenue, 2012–2016
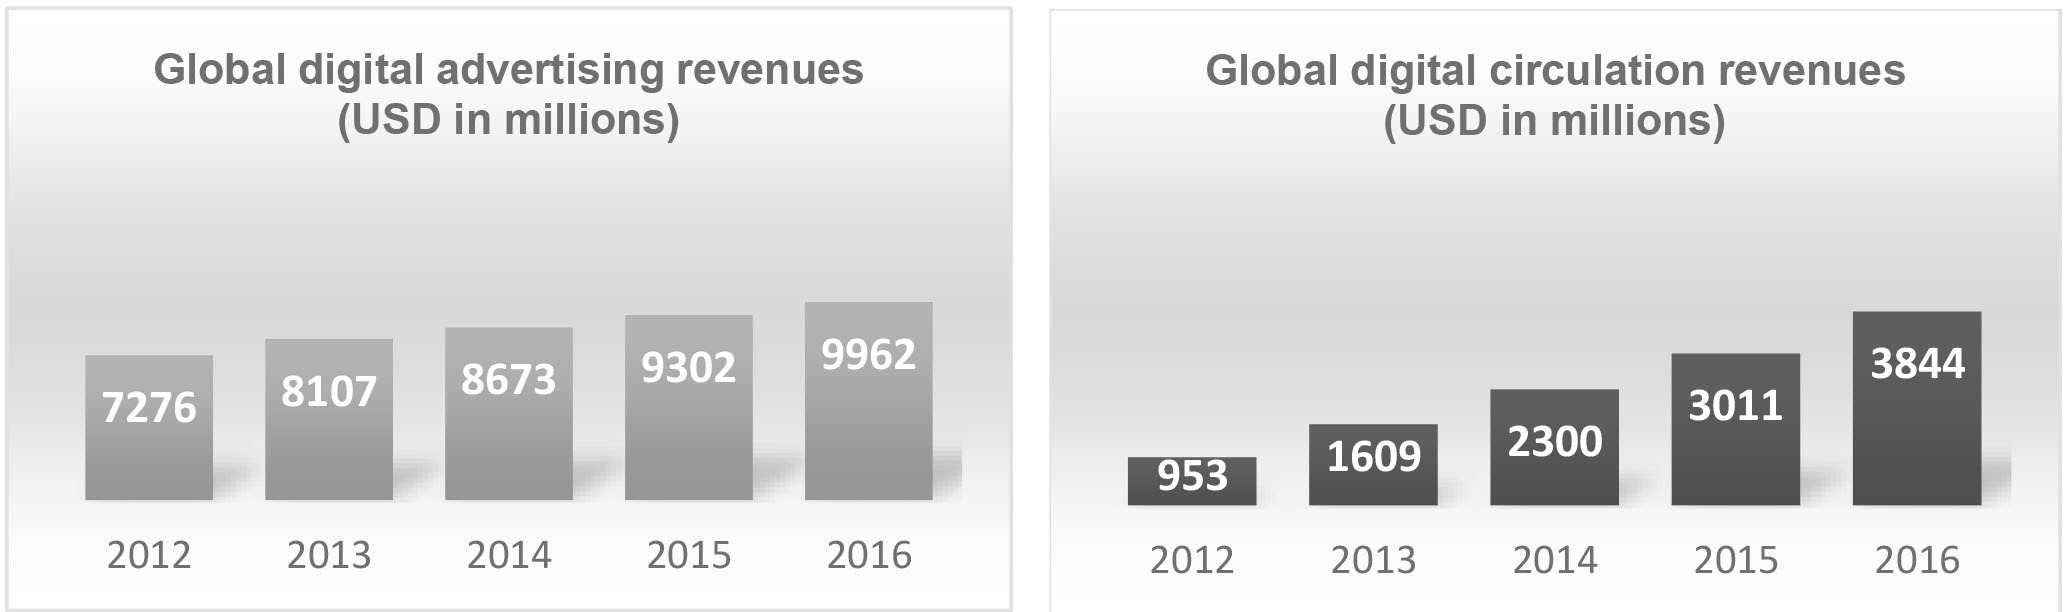
The bar graph on the left shows the comparison of the digital advertising revenues. The horizontal axis lists the years and ranges from 2012 to 2016. The data from the graph are tabulated below.
Years | 2012 | 2013 | 2014 | 2015 | 2016 |
Revenues (U S D in millions) | 7276 | 8107 | 8673 | 9302 | 9962 |
The bar graph on the right shows the comparison of the digital circulation revenues. The horizontal axis lists the years and ranges from 2012 to 2016. The data from the graph are tabulated below.
Years | 2012 | 2013 | 2014 | 2015 | 2016 |
Revenues (U S D in millions) | 953 | 1609 | 2300 | 3011 | 3844 |
Source: WAN-IFRA WPT analysis, Zenith, PwC Global Entertainment and Media Outlook, 2017–2021.
C. Global news industry revenue source (in US million)
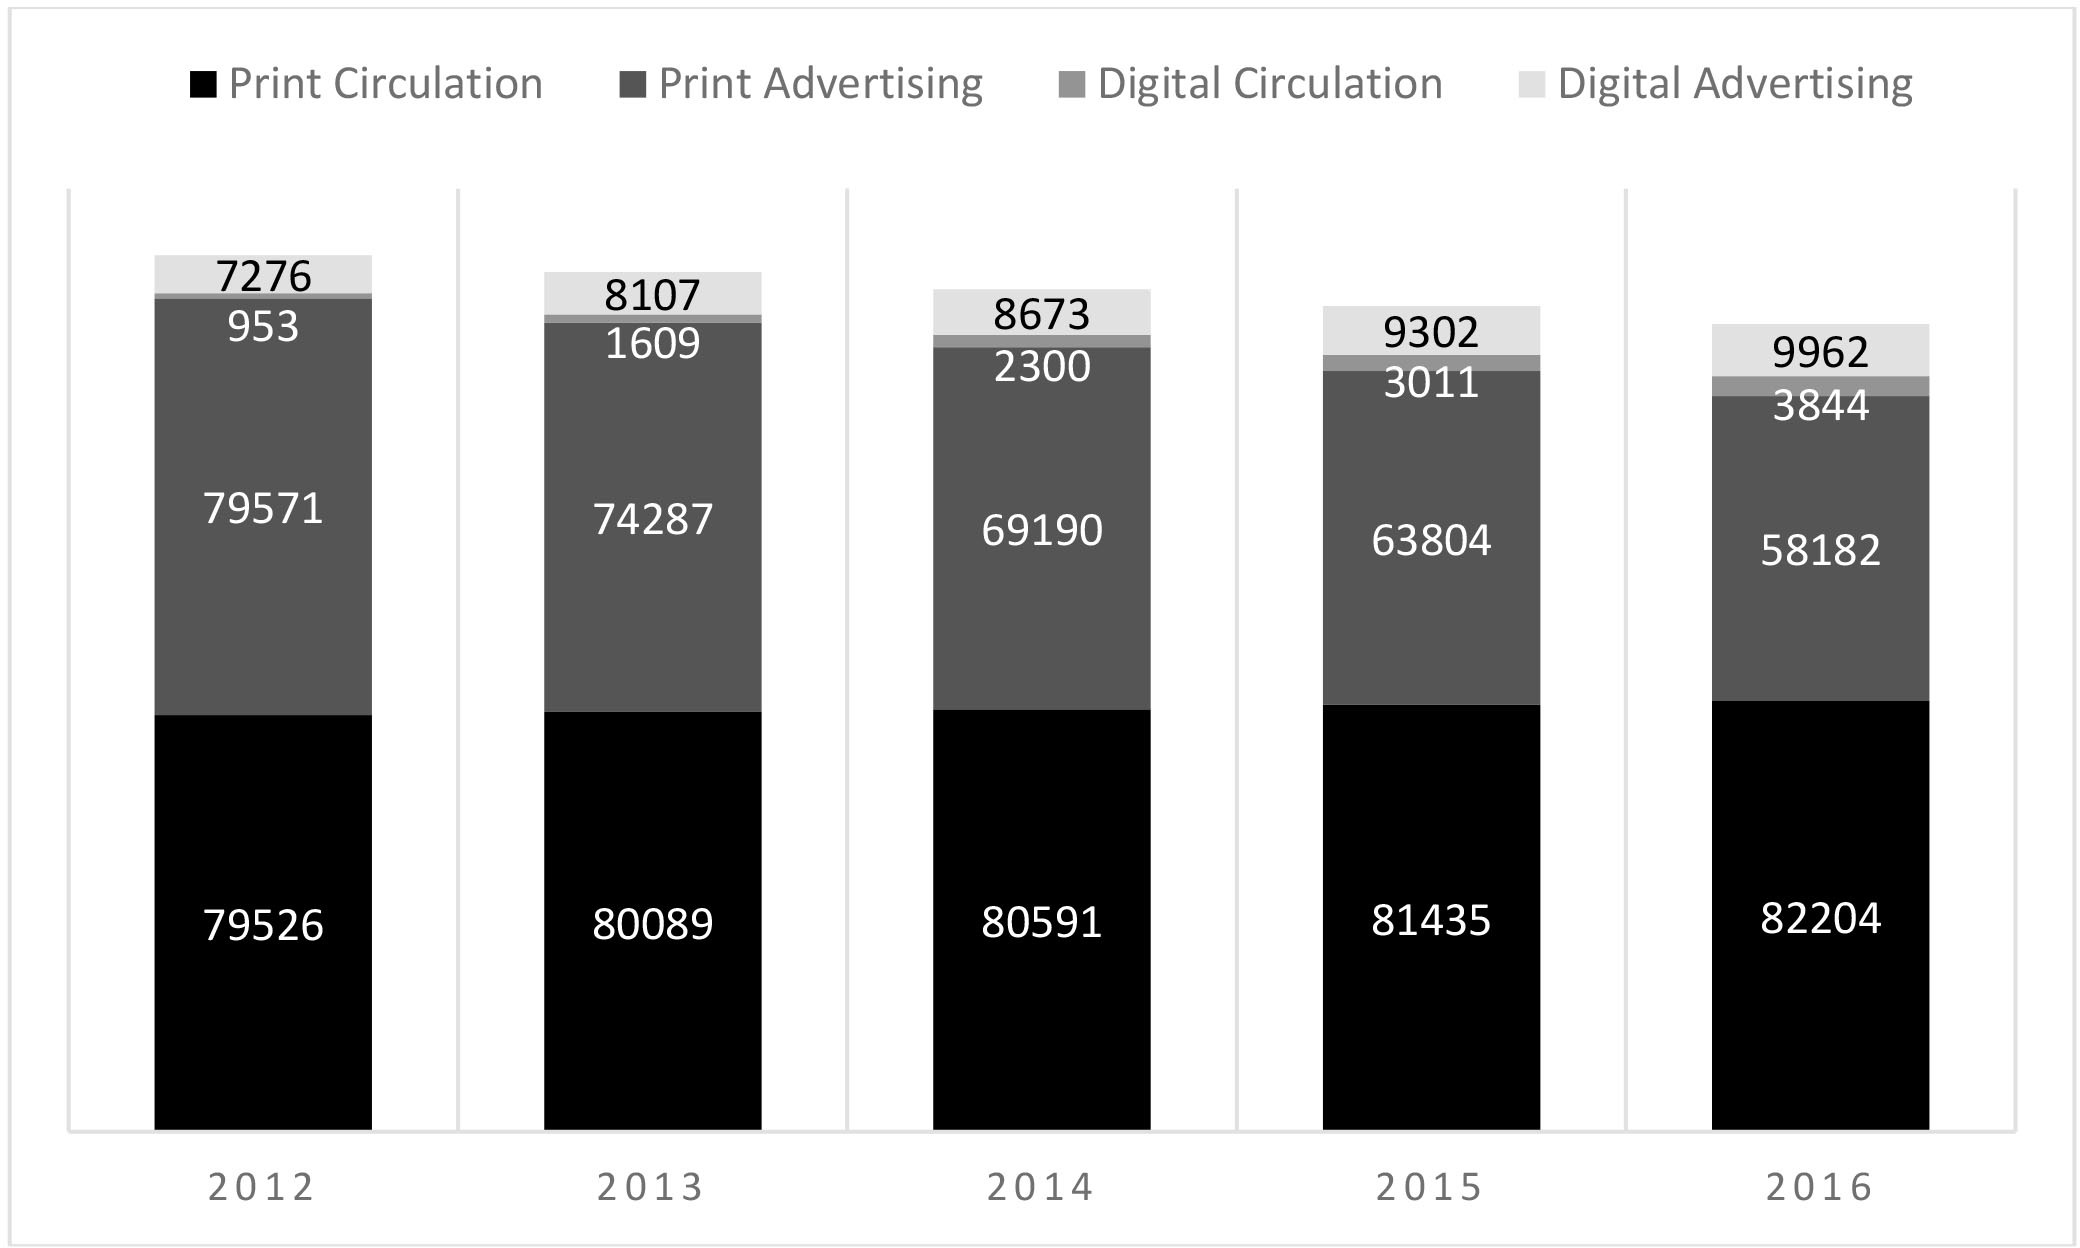
The horizontal axis lists the years and ranges from 2012 to 2016. The data from the graph are tabulated below.
Years | 2012 | 2013 | 2014 | 2015 | 2016 |
Revenues (U S D in millions) | 953 | 1609 | 2300 | 3011 | 3844 |
Source: WAN-IFRA WPT analysis, Zenith, PwC Global Entertainment and Media Outlook, 2017–2021.
D. Advertising and circulation revenue (in US million)
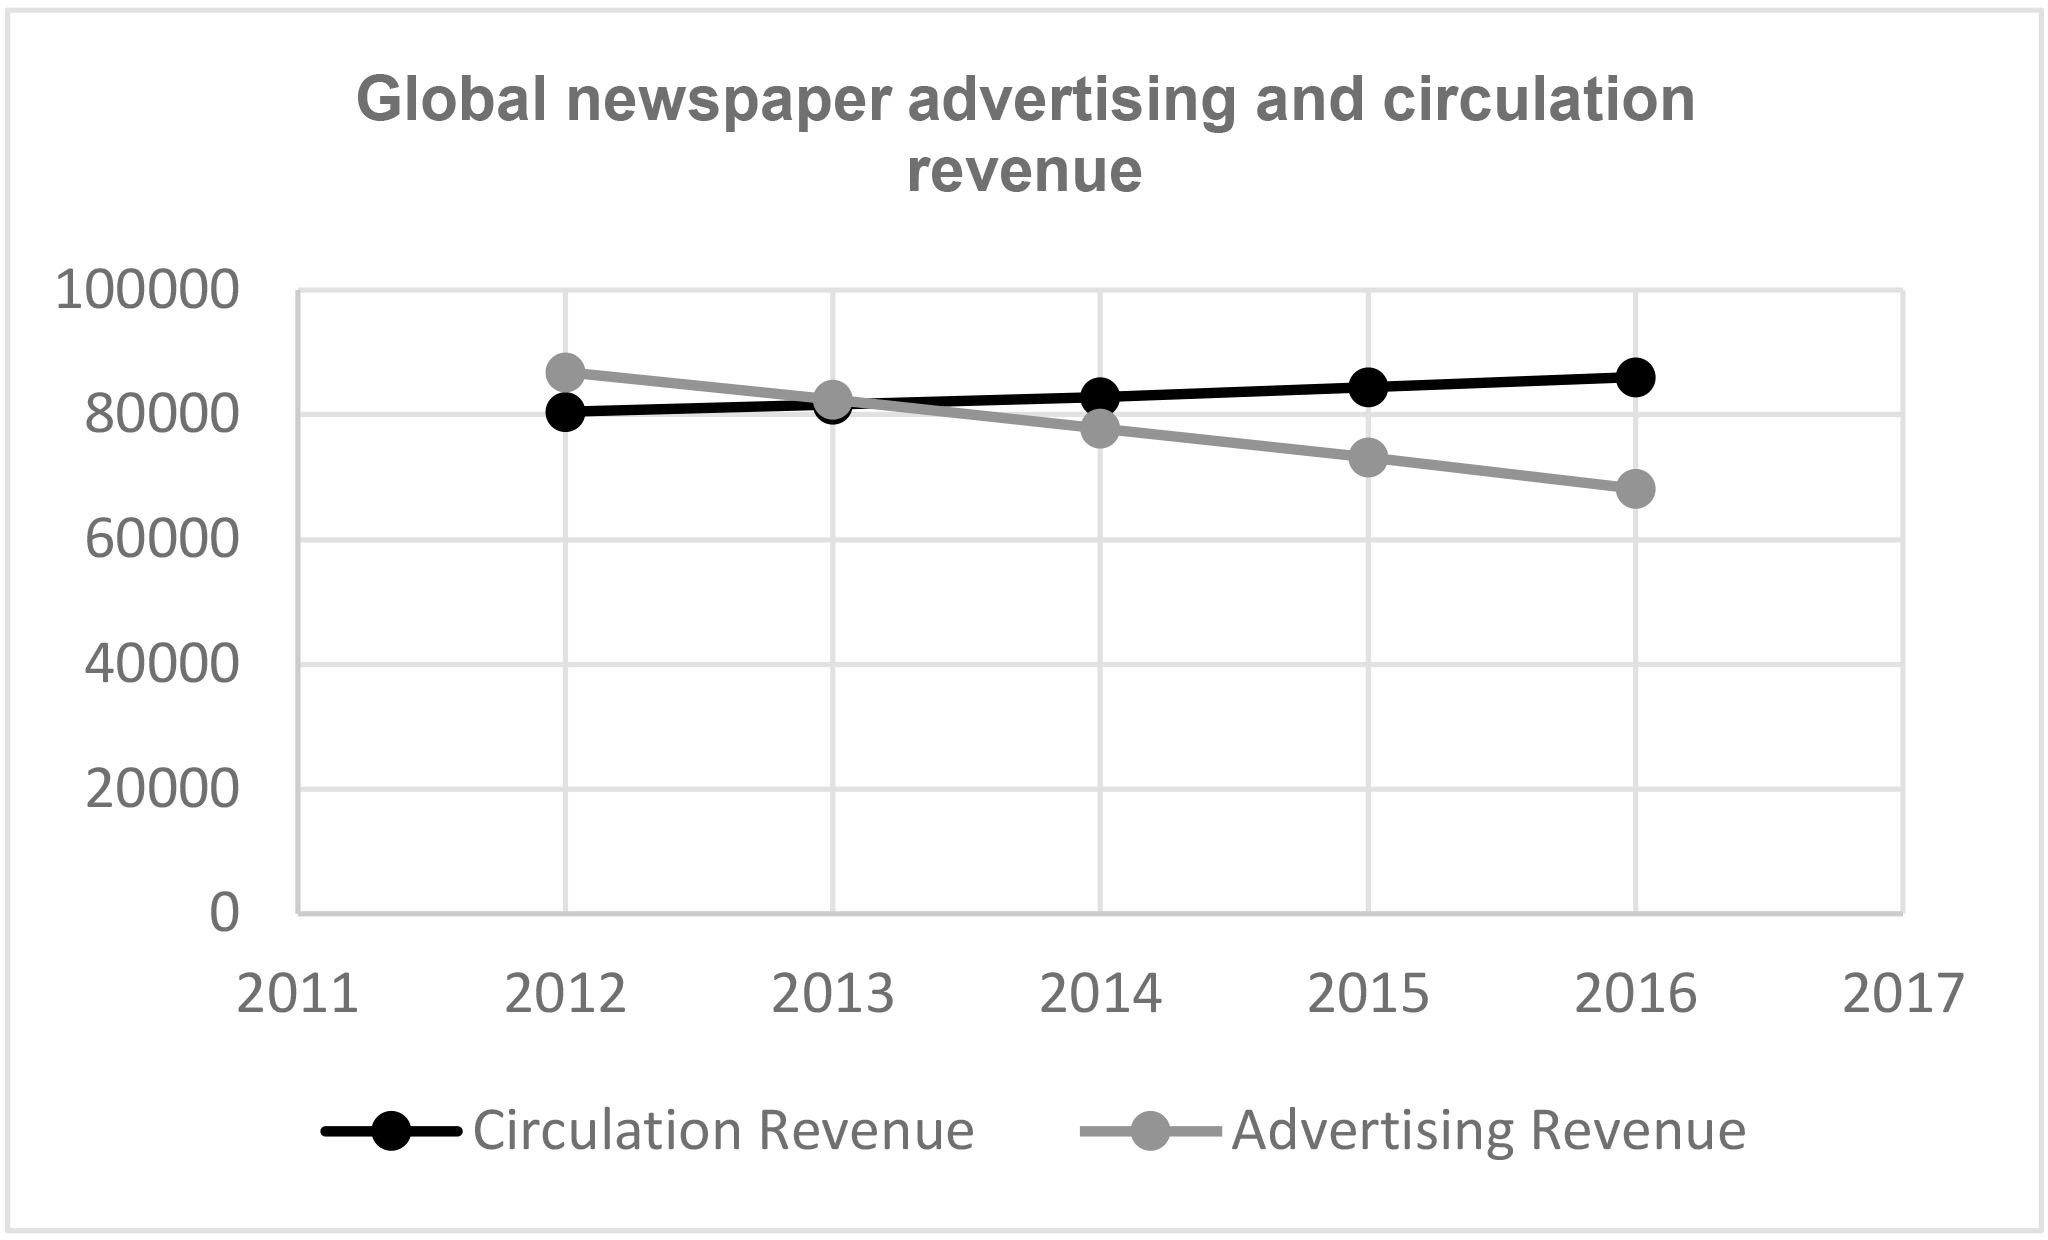
The horizontal axis lists the years and ranges from 2011 to 2017 with nil increments. The vertical axis lists the values and ranges from 0 to 100000 in increments of 20000. The approximate data from the graph are tabulated below.
Years / Revenues (U S D in millions) | 2012 | 2013 | 2014 | 2015 | 2016 | 2017 |
Advertising Revenue | blank | 88000 | 80000 | 79000 | 78000 | 66000 |
Circulation Revenue | blank | 80000 | 80000 | 80000 | 84000 | 86000 |
Outlook, 2017–2021.
The digital revolution had shaken up the fundamental business model of the industry. Print advertising revenues continued to drop significantly. Digital advertising, which was expected to compensate for this loss, never reached its potential. Print, still, accounted for 91% of revenues of the news industry. Traditionally, advertising revenue subsidized the cost of producing news. It was not valid anymore as circulation revenues were higher than advertising revenues and the gap was increasing.
Source: WAN-IFRA WPT analysis, Zenith, PwC Global Entertainment and Media.
E. Change in print newspaper circulation over the past 5 years
The vertical axis lists the values and ranges from negative 40.00% to 50.00% in increments of 10. The data from the graph are tabulated below.
Regions / Years / percentage change | Europe | Asia | North America | Latin America | Australia and Oceania | Africa and MENA |
5 years | negative 20.5% | 40% | negative 11.60% | negative 5.30% | negative 30.70% | negative 0.40% |
1 year | negative 5.8% | 8.80% | negative 2.40% | negative 1.40% | negative 7.70% | 0.20% |
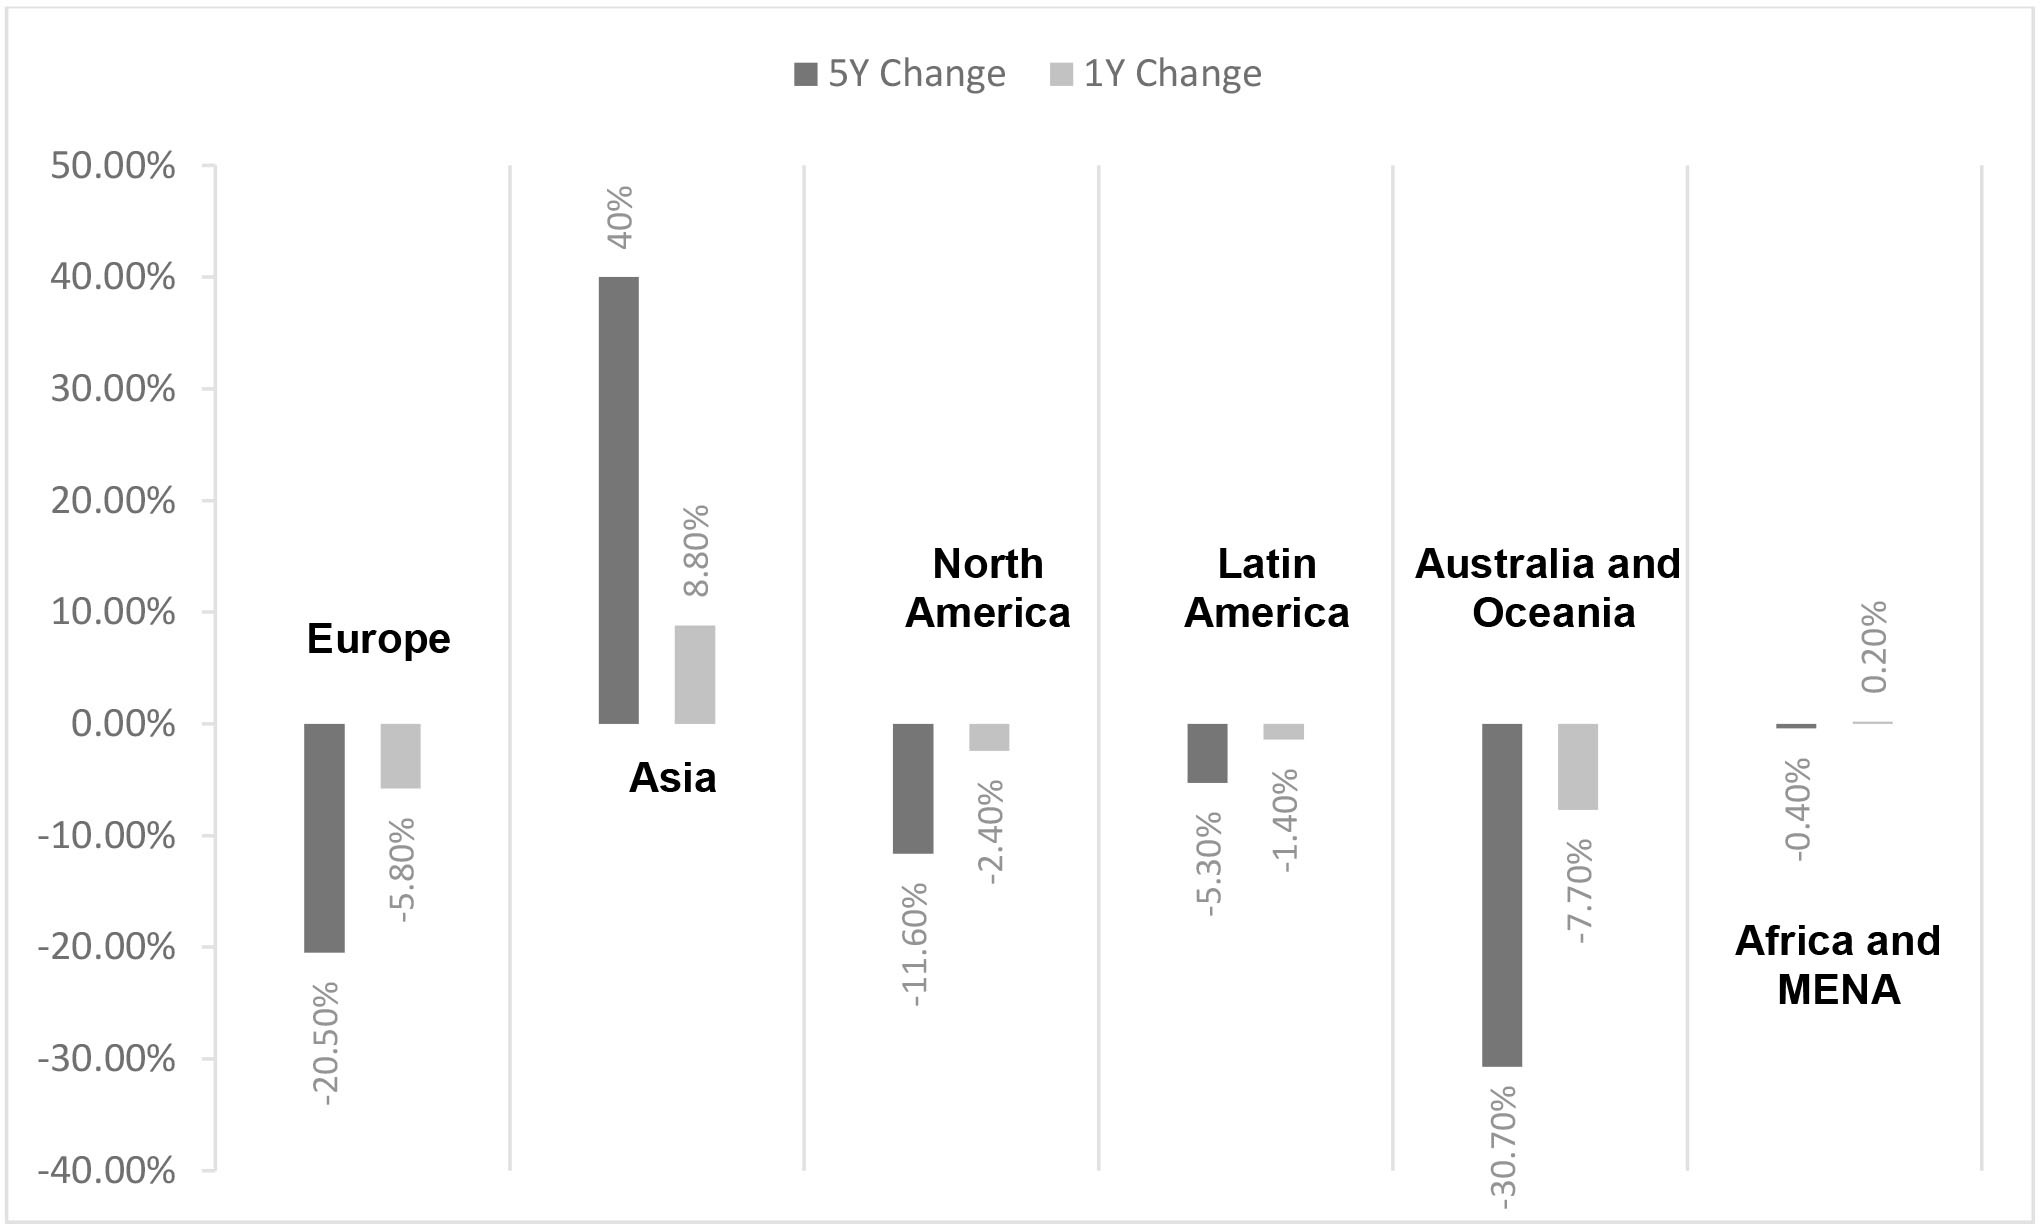
Source: WPT 2017 analysis.
Despite the digital revolution, the global print circulation had continued to grow from 614 million copies in 2012 to 757 million in 2017.1 However, the growth came only from the Asian markets. Asia accounted for a 40% increase in circulation, while other regions reported significant losses.
F. Global advertising trend
Since 2012, global advertising expenditure increased at CAGR 3.8% to about USD 550 billion in 2016.2 Newspapers and magazines showed a downward trend, television nearly saturated and the positive trend was clearly in favor of the internet. Unfortunately, the increased ad spend on internet had not translated to revenues for news media, which was shaken up by a heavy drop in print advertising from USD 79.5 billion in 2012 to USD 59 billion in 2016.
Google and Facebook captured 64% of all internet advertising spend in 2016.3 Moreover, in the digital domain, news publishers competed with millions of other websites for advertising. Out of roughly USD 250 billion internet advertising spend, the news industry made just USD 10 billion.
G. Distributed content: Search and social media, the biggest gateway for traffic
The graph on the left shows a comparison of the percentage of all pageviews from search engines. The vertical axis lists the regions. The data from the graph are tabulated below.
Regions | Oceania | Asia / Pacific | Central / Eastern Europe | Western Europe | Latin America | United States |
Percentage of pageviews from search engines | 52% | 50% | 48% | 48% | 48% | 44% |
The graph on the left shows a comparison of the percentage of all pageviews from search engines. The vertical axis lists the regions. The data from the graph are tabulated below.
Regions | Oceania | Asia / Pacific | Central / Eastern Europe | Western Europe | Latin America | United States |
Percentage of pageviews from social platforms | 35% | 32% | 32% | 32% | 30% | 29% |
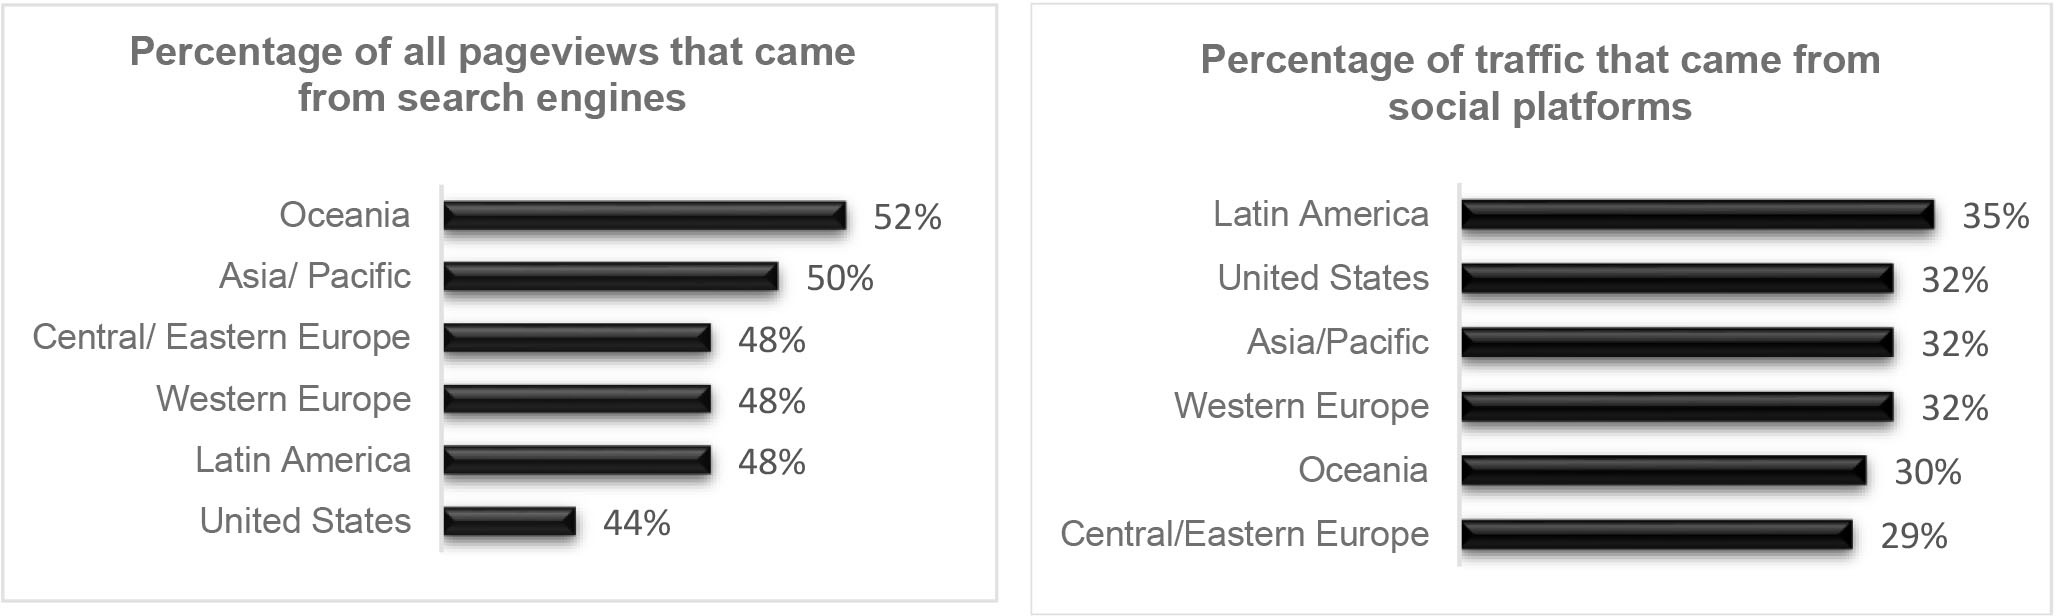
Source: Chartbeat, 2017.
Search engines and social media drove traffic for news publishers. However, these platforms found a need to host content rather than diverting the readers to news publishers’ websites. The result was platforms such as Facebook’s Instant Articles and Google’s Accelerated Mobile Pages (AMP).
If direct traffic was the best way to build a strong brand and long-term relationship with clients and convert them for digital subscription, over-reliance on distributed content may have shut the doors.
H. Rise of programmatic advertising
The horizontal axis lists the years and ranges from 2016 to 2021. The vertical axis on the left lists the values and ranges from 0 to 90 in increments of 10. The vertical axis on the right lists the percentages and ranges from 10% to 100% in increments of 10. The data from the graph are tabulated below.
Years | 2016 | 2017 | 2018 | 2019 | 2020 | 2021 |
Values (U S D in billions) | 25.48 | 35.46 | 46.05 | 57.3 | 68.47 | 79.75 |
Percentage ad Spends | 73% | 78.50% | 81.20% | 83.50% | 85% | 86.50% |
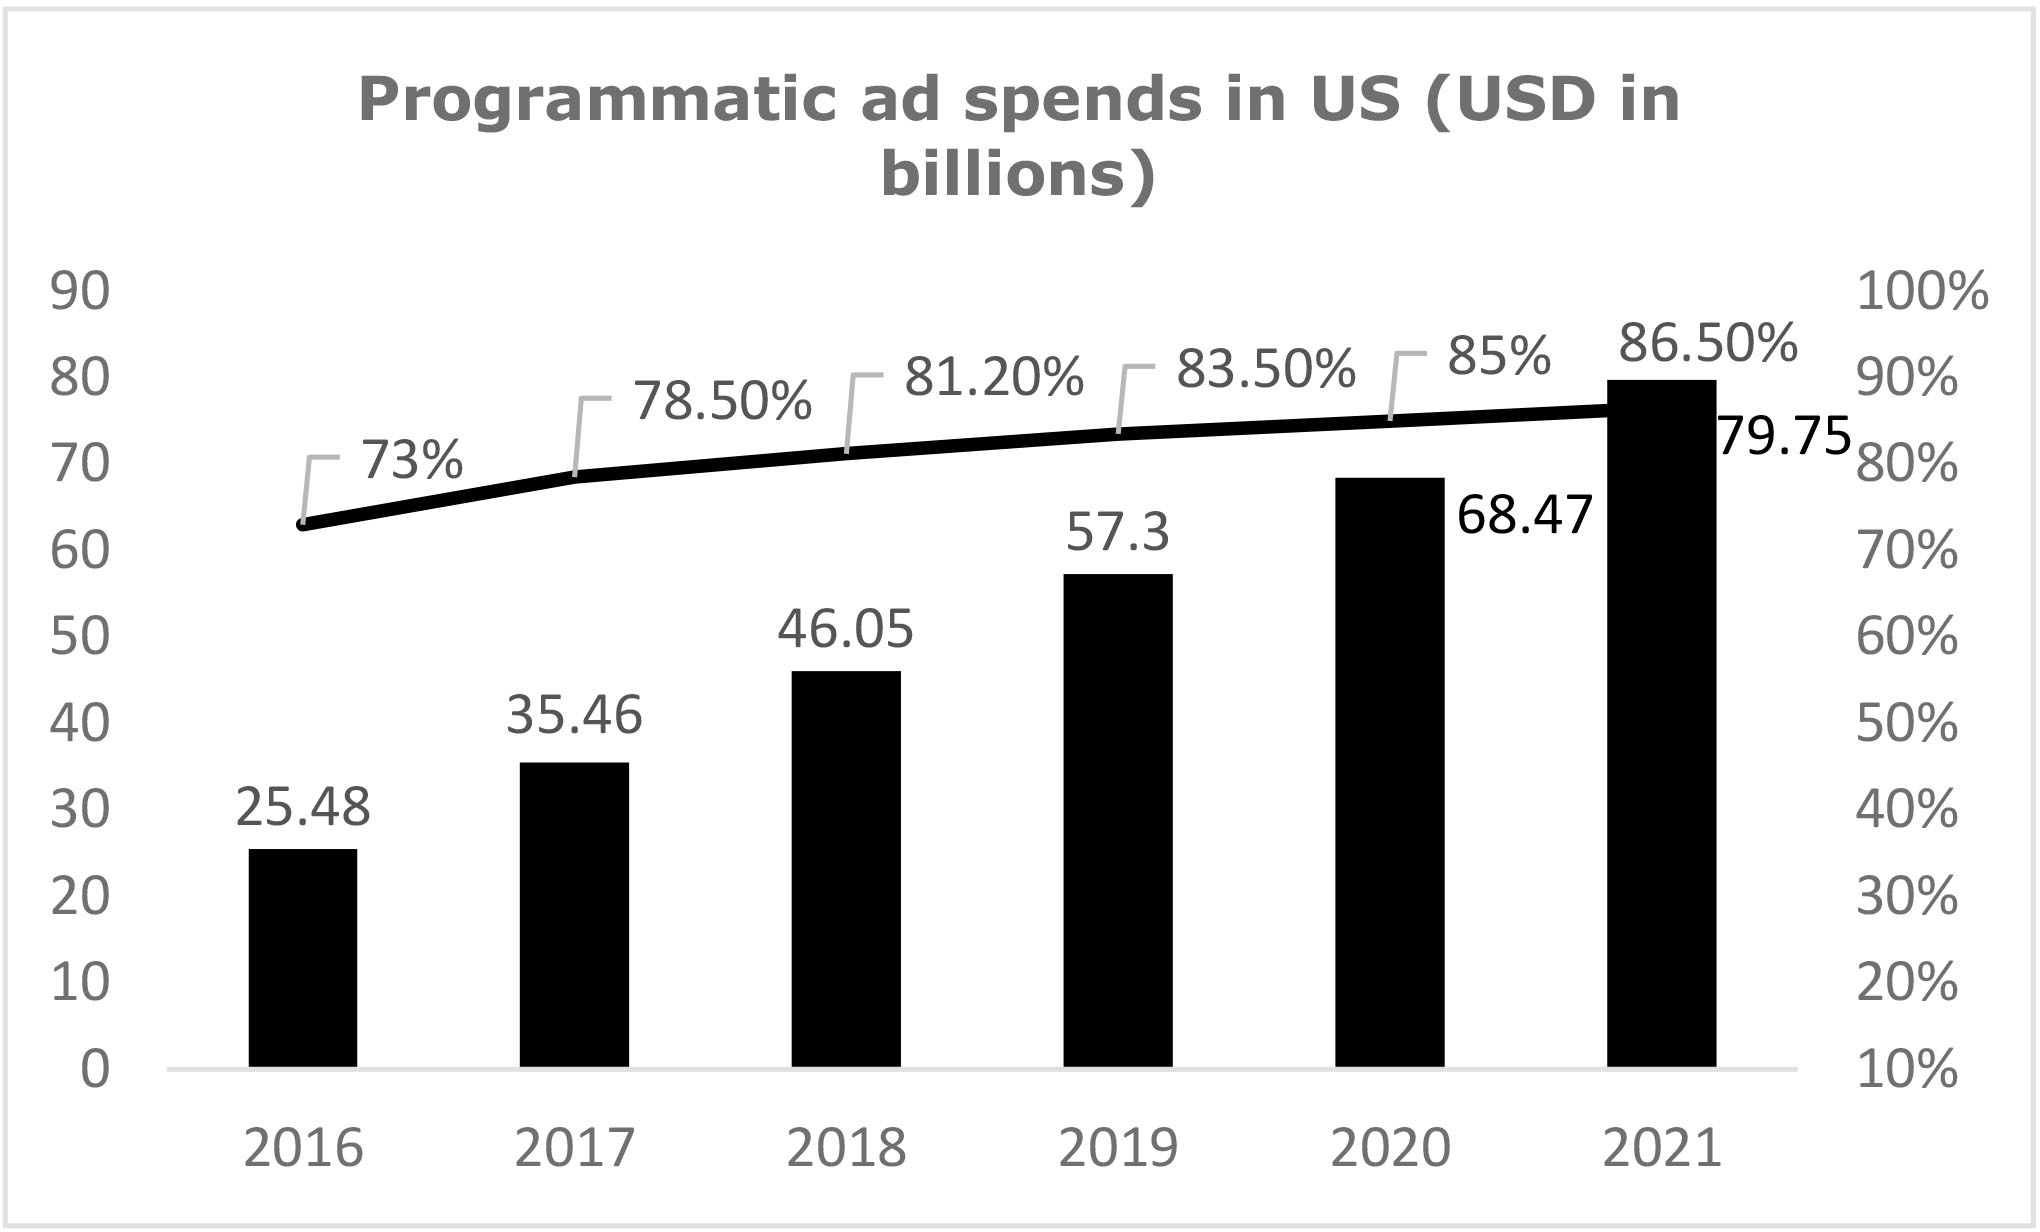
Programmatic ad trading continued to increase. In the US, programmatic advertising was projected to rise to 86.5% by 2021.4
Demand for a less intrusive ad format and the rise of ad blockers had also led to the growth of native ads and sponsored content. PwC estimated that native ads would account for 74% of the display digital ad revenue in the US by 2021.5
Source: eMarketer, October 2019.
I. Trend in India
India was one of the fastest-growing markets for the newspaper industry.
As of March 2016, there were 110,851 registered publications in the country, an increase from 105,443 in 2015.6 The number of registered publications continued to grow at a pace of 5% per annum. The total circulation of copies increased from 510 million per publication date in 2014–2015 to 610 million in 2015–2016.7 Although mobile devices and internet penetration had continued to grow in India, it had not affected the growth of print. This was attributed to the rising literacy levels and the low cover price of newspapers in India. Vernacular dailies continued to dominate the Indian newspaper market. As per Registrar of the Newspapers for India (RNI) 2015–2016, Hindi publications reported a circulation of 314.5 million copies, followed by English dailies with 65.4 million. Other major languages are Urdu with 51.7 million copies, Telugu with 27.6 million copies, and Marathi with 36.7 million copies per publication day.
The country was also one of the fastest growing in mobile internet penetration. Cisco predicted that the number of mobile internet users would increase from 373 million in 2016 to about 829 million in 2021, covering 59% of the Indian population.8 Cisco also reported that video would continue to dominate internet traffic, and in 2021, India will consume 84 billion internet video minutes per month.9
On the advertising front, as per a report from the Federation of Indian Chambers of Commerce and Industry and Ernst & Young, the share of digital advertising out of the total advertising spend was 17% in 2017.10 This pie was expected to grow and reach 22% in 2020. In print advertising, English language dailies came under pressure, while vernacular dailies had a marginal growth. However, print advertising was expected to grow by 10% in 2018 and 2019.
Exhibit 4. Digital Newsroom Dynamics
The dynamics of print and digital newsrooms are distinctly different.
The editors in the print newsroom have the luxury of time. News lands here from various sources. The editors then decide which news items to publish; they verify the news, add value with analysis and opinion, and publish them in the newspaper. They have a large and concrete base of readers who have subscribed to the newspaper.
The editors in the digital newsroom, however, work in a completely different environment. First, news is published as soon as it arrives in the newsroom. Most of the feeds are from news agencies and are available to all news publishers. Whoever breaks the news first gets a higher ranking on Google and, in turn, higher page views. Second, the readers decide which news item from the list of available options they want to read.
In many cases, the news was “googled,” and readers reach the news publisher’s website through search engines. Hence, search engine optimization (SEO) is the most critical priority of a digital media house. Third, the reader base is not guaranteed. Every news publisher aims for high page views and publishes news items that drive traffic.
At IE Digital, a group of editors keeps a close watch on the news feed from other agencies and their reporters. As soon as they receive a news item, they write an SEO-friendly article, choose an appropriate unified resource locator (URL) with the right keywords and publish it. The editors also follow Google News to be up-to-date with the top-trending stories. If the Indian Express does not have an article on these trending stories on Google, the team immediately creates one. When news breaks, a stub is published with available information. The stub is then updated with more information in due course. Speed is paramount.
The breaking-news culture, however, has a flip side as there are chances of publishing erroneous news, which can impact the brand image. On the other hand, not publishing a trending news item that is carried by every other news publisher could impact traffic. At IE Digital, the team always verifies the news before publishing it. When not possible, the editors decide whether to publish it.
Verifying and publishing news items are the key competencies of any editor in the digital newsroom. The challenge, however, has shifted to obtaining the news items that are seen and picked up by readers—a trend of viral news. There is an inherent tension in choosing the right tags, keywords, and URL to make the news rank high on Google and at the same time maintain the sanctity of responsible journalism.
Rajan remarked:
We have to be quick, accurate and also get our articles discovered. In the newsroom, we challenge each other in a friendly competition to see whose stories rank higher on Google. It adds fun to our challenging job.
Exhibit 5. Video Strategy of IE Digital
YouTube is a powerful platform with its own audience groups and its own strengths and weaknesses. The group is on the lookout for a YouTube audience growth expert to join full time to define a YouTube strategy, which will form just one part of the group’s entire video strategy. Facebook is another platform that requires IE to have its own independent strategy.
Ragini, Chief Video Editor, IE Digital
Video offerings from IE Digital can be broadly divided into the following categories:
Informative: These were mostly the videos received from journalists aimed at adding differentiating values to the news items. These videos required minimal efforts from the video team and were uploaded on the website after minor editing and sometimes without any editing at all. The video team spent time in training the journalists to improve the quality of the first videos.
Explanatory: These were the editorial versions of the videos. These could be anything from a review of a new gadget or a vehicle or explaining a critical political matter like the Doklam face-off. Such videos required a lot of research and took a lot of time, sometimes even months, to produce.
Entertaining: These videos served the purpose of assisting website discovery on popular media like Facebook, Google and YouTube. IE Digital had its YouTube channel “IndianExpressOnline” and the video team worked to develop quality content that garnered a lot of interest from internet users.
Interviews: These videos, namely, Idea Exchange weekly interviews on the YouTube channel, were aimed at building the reader’s loyalty by reinforcing the Express brand digitally. Under this initiative, a video was uploaded every Sunday morning (the day the full-page long interview was published in the print newspaper). It was mentioned in the print version that the interview is available for viewing on indianexpress.com. This also helped in projecting a unified image of the digital and print offerings of the Indian Express.
Some Popular Videos from IE Digital’s Video Team in Different Formats
The video is titled a day in the life of a female bouncer. The clip on the left shows the bouncer in a traditional outfit. The clip on the right shows the bouncer in a shirt. The video has 335,885 views, 2.2K likes, and Indian Express Online has 103K subscribers.
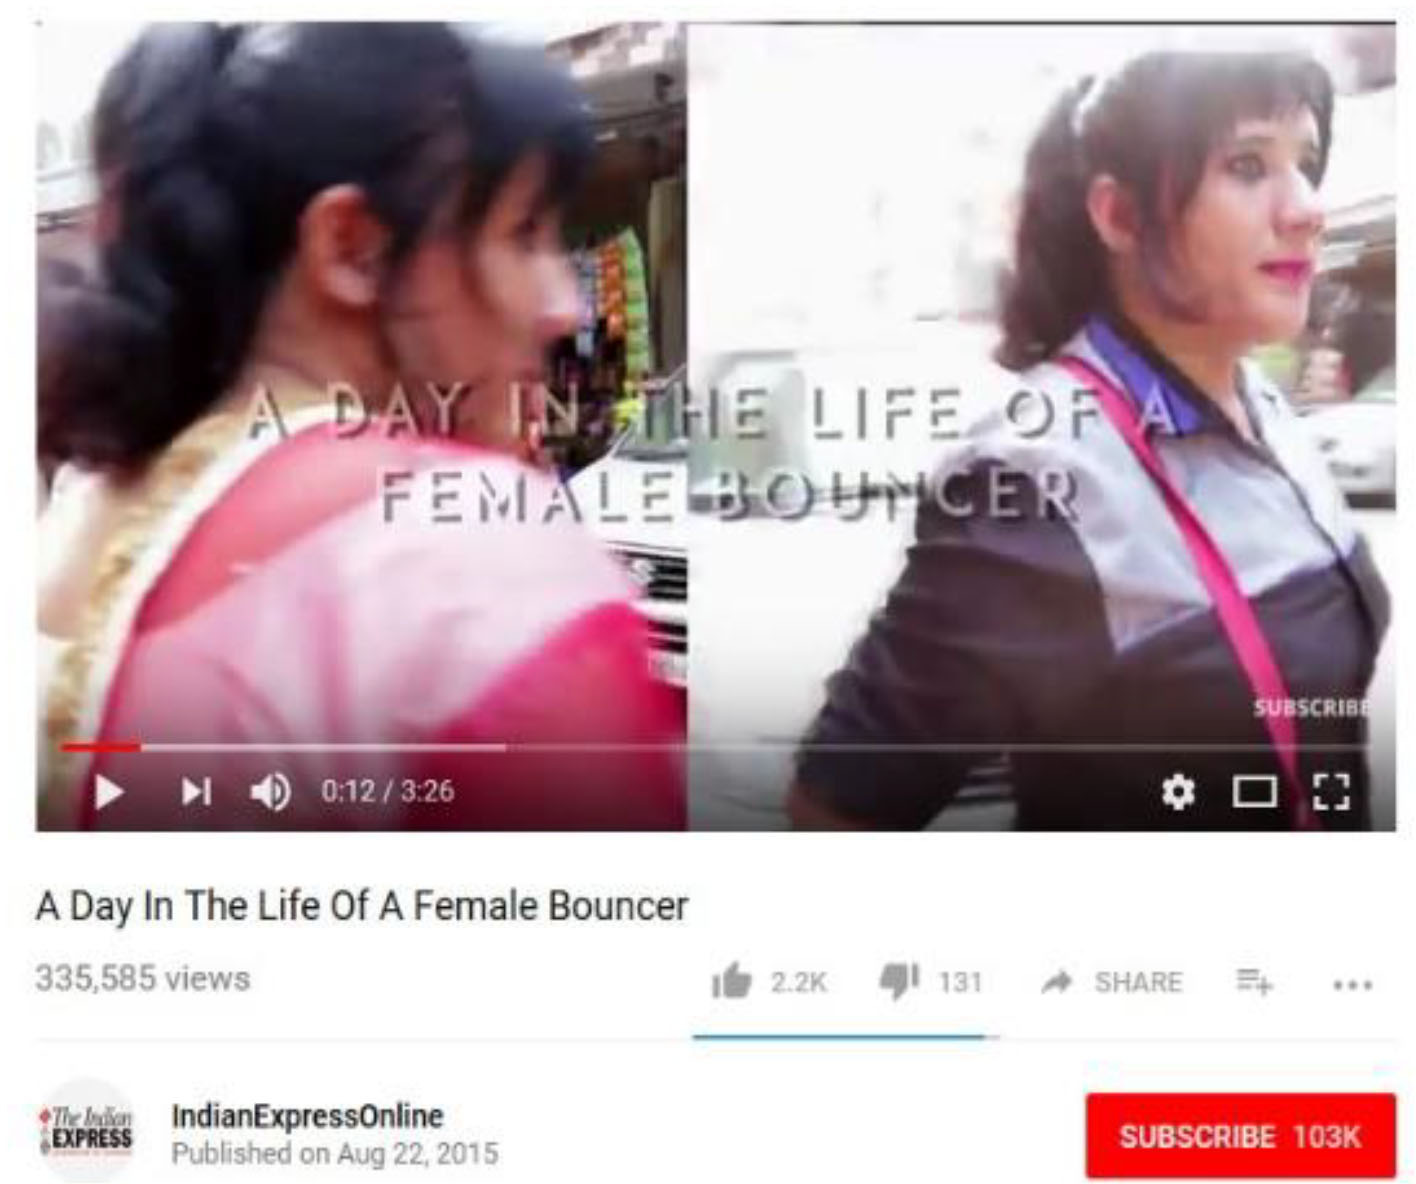
1. A day in the life of a female bouncer https://www.youtube.com/watch?v=-So-hheuiQk
The video is titled Aamir Khan on intolerance and delinking terrorism from religion hashtag R N G Awards. The clip shows Aamir Khan on a stage in conversation with the interviewer. The video has 718,499 views, 2.9K likes, and Indian Express Online has 103K subscribers.

2. Aamir Khan on intolerance and delinking terrorism from religion https://www.youtube.com/watch?v=jnZTcee5H7o&t=68s
The video is titled Explained: How G S T will work? The text on the clip reads to understand how GST will work let’s go shopping! The video has 604,430 views, 3.6K likes, and Indian Express Online has 103K subscribers.

3. Explained: How will GST work? https://www.youtube.com/watch?v=JK8CzkQh1FY
The video is titled Chennai Floods Explained: Why is Chennai under water? The video clip shows the road in a street immersed in water and a bike is gushing through it. The video has 694,523 views, 1.5K likes, and Indian Express Online has 103K subscribers.

4. Chennai floods explained: Why is Chennai under water? https://www.youtube.com/watch?v=x4dNIfx6HVs
Source: Based on interviews of the IE Digital staff, October 2017.
Exhibit 6. IE Digital Revenues, 2017–2018 (in INR million)
Revenue | Apr-17 | May-17 | Jun-17 | Jul-17 | Aug-17 | Sep-17 | Oct-17 | Nov-17 | Dec-17 | Jan-18 | Feb-18 | Mar-18 | YTD 17–18 |
A. Direct sales | 16.836 | 12.176 | 11.271 | 13.159 | 8.612 | 15.604 | 21.473 | 14.746 | 15.551 | 14.406 | 22.329 | 19.826 | 185.990 |
Domestic-direct | 10.556 | 7.777 | 6.151 | 7.526 | 3.874 | 10.990 | 15.546 | 8.446 | 8.630 | 10.761 | 16.289 | 13.225 | 119.771 |
Desktop and tablet | 10.556 | 7.777 | 6.151 | 7.526 | 3.754 | 10.707 | 15.186 | 8.082 | 7.762 | 9.091 | 13.538 | 12.161 | 112.290 |
Mobile | 0.120 | 0.283 | 0.360 | 0.365 | 0.868 | 1.670 | 2.751 | 1.064 | 7.481 | ||||
Less trade discount | 0.048 | 0.048 | |||||||||||
Net domestic-direct | 10.508 | 7.777 | 6.151 | 7.526 | 3.874 | 10.990 | 15.546 | 8.446 | 8.630 | 10.761 | 16.289 | 13.225 | 119.723 |
Network-direct | 6.328 | 4.399 | 5.120 | 5.633 | 4.739 | 4.614 | 5.927 | 6.300 | 6.922 | 3.645 | 6.040 | 6.601 | 66.267 |
Domestic | 1.391 | 1.132 | 1.090 | 1.625 | 1.286 | 1.770 | 3.068 | 3.802 | 4.574 | 2.946 | 3.961 | 5.125 | 31.770 |
Desktop and tablet | 0.834 | 1.132 | 1.090 | 1.625 | 1.265 | 1.495 | 2.925 | 3.518 | 4.225 | 2.621 | 3.636 | 5.033 | 29.399 |
Mobile | 0.556 | 0.021 | 0.275 | 0.143 | 0.285 | 0.350 | 0.325 | 0.325 | 0.092 | 2.372 | |||
Network-international | 4.937 | 3.268 | 4.030 | 4.008 | 3.453 | 2.845 | 2.859 | 2.497 | 2.347 | 0.698 | 2.078 | 1.476 | 34.497 |
Desktop and tablet | 4.513 | 2.990 | 3.662 | 3.579 | 3.232 | 2.626 | 2.717 | 2.338 | 2.215 | 0.698 | 1.753 | 1.151 | 31.473 |
Mobile | 0.424 | 0.278 | 0.368 | 0.429 | 0.221 | 0.219 | 0.143 | 0.159 | 0.133 | 0.326 | 0.326 | 3.024 | |
B. Google and PubMatic | 11.309 | 16.602 | 25.610 | 17.673 | 17.918 | 16.080 | 15.640 | 15.893 | 15.690 | 15.819 | 13.823 | 19.247 | 201.303 |
Desktop and tablet | 7.963 | 11.297 | 19.485 | 12.011 | 11.869 | 11.226 | 10.120 | 10.971 | 9.355 | 15.819 | 13.823 | 19.247 | 153.186 |
Mobile | 3.346 | 5.305 | 6.125 | 5.662 | 6.049 | 4.854 | 5.520 | 4.922 | 6.335 | 48.117 | |||
C. Special partnerships | 5.222 | 6.564 | 7.136 | 6.550 | 7.145 | 6.901 | 6.819 | 5.901 | 6.748 | 3.777 | 3.961 | 5.032 | 71.757 |
Foreign | 5.222 | 6.564 | 7.136 | 6.550 | 7.145 | 6.901 | 6.819 | 5.901 | 6.748 | 3.777 | 3.961 | 5.032 | 71.757 |
Desktop and tablet | 5.222 | 6.564 | 7.136 | 6.550 | 7.145 | 6.901 | 6.819 | 5.901 | 6.748 | 3.777 | 3.961 | 5.032 | 71.757 |
Mobile | |||||||||||||
Domestic | |||||||||||||
D. Content sales | 1.848 | 2.202 | 2.450 | 2.161 | 2.369 | 2.393 | 2.450 | 2.734 | 2.665 | 2.652 | 2.019 | 2.056 | 28.000 |
Domestic | 1.123 | 1.348 | 1.458 | 1.132 | 1.212 | 1.425 | 1.450 | 1.650 | 1.650 | 1.691 | 1.200 | 1.200 | 16.538 |
Foreign | 0.726 | 0.854 | 0.991 | 1.029 | 1.158 | 0.968 | 1.000 | 1.084 | 1.015 | 0.962 | 0.819 | 0.856 | 11.462 |
E. Event income | 19.500 | 1.200 | 20.700 | ||||||||||
F. Other income (loss) | −0.189 | −0.140 | 0.054 | −0. 275 | |||||||||
Total Rev (A+B+C+D+E+F) | 35.215 | 37.544 | 46.467 | 39.543 | 36.044 | 40.978 | 46.382 | 58.774 | 41.855 | 36.464 | 41.992 | 46.216 | 507.475 |
Source: IE Digital.
Exhibit 7. Digital Advertising
Typically, news websites monetize digital content through subscription, advertisement, and content sales to other platforms.
Direct advertising: The in-house advertising team sells slots to prospective advertisers. Any business house that chooses the websites in which to include their advertisements wants to extract the maximum returns out of their investments and looks for the maximum attention from a relevant audience. The most popular content attracts maximum attention. Thus, it is a closed loop, and monetization is closely linked to the content that a website carries.
Programmatic advertising: It is done through Ad Networks such as Google AdSense, Googlem AdMob, Adsterra and AdMaven that flow advertisements to the news publisher’s website.11 In programmatic ad placements, in many cases, business houses do not have control over where their advertisements appear. The news publisher’s website offers a safe platform that can be used to reach out to selected target audience. Hence, news websites are at an advantage. In many countries, news publishers have joined together to start their own ad exchanges.12
Content sales: Revenue is also earned by selling content to news aggregators such as Google’s Accelerated Mobile Pages (AMP) and Facebook’s Instant Articles. In these, news publishers have the option to place their advertisement inventory or let the platform flow ads from its ad networks. The platform then shares revenue with news publishers.
Rajan expressed his concern about the revenue-sharing mechanism:
Periodically, we receive payments from Facebook. We have no clue how they calculate the revenue share.
Notes
1. 1. WPT analysis: WAN-IFRA World Press Trends 2017.
2. 2. WAN-IFRA World Press Trends 2017, Zenith.
3. 23. Retrieved from https://www.zenithmedia.com/google-facebook-now-control-20-global-adspend/ on March 15, 2018.
4. 24. Retrieved from https://marketingland.com/social-now-dominates-57-3-billion-u-s-programmatic-display-market-271876 on March 15, 2018.
5. 25. BI Intelligence estimates based on historical data from IAB, PwC and IHS. WAN-IFRA WPT 2016.
6. 26. Registrar of Newspapers for India, 2015-2016.Retrieved from http://rni.nic.in/all_page/PIN2015_16.html on March 15, 2018.
7. 27. Registrar of Newspapers for India. A total of 27,445 publishers filed their annual statements for the year 2015–2016.
8. 28. Retrieved from https://www.financialexpress.com/economy/internet-users-to-double-to-829-million-by-2021-report/709719/ on March 15, 2017.
9. 29. Retrieved from https://www.cisco.com/c/dam/m/en_us/solutions/service-provider/vni-forecast-highlights/pdf/India_2021_Forecast_Highlights.pdf on March 15, 2018.
10. 30. Retrieved from http://ficci.in/spdocument/22949/FICCI-study1-frames-2018.pdf on December 20, 2018.
11. 31. Retrieved from http://altitudedigital.com/company-blog/programmatic-advertising-deconstructed-vol-1-ad-networks/ on March 15, 2018.
12. 32. Retrieved from https://www.exchangewire.com/blog/2014/12/02/australian-publishers-form-premium-advertising-exchange/ on March 15, 2018.
This case study is provided in this Sage Business collection primarily as a basis for classroom discussion or self-study and is not meant to illustrate either effective or ineffective management styles. Nothing herein shall be deemed to be an endorsement of any kind. This case study is for scholarly, educational, or personal use only within your university, and cannot be forwarded outside the university or used for other commercial purposes.
© 2026 Sage Publications, Inc. All Rights Reserved.
Get a 30 day FREE TRIAL
-
 Watch videos from a variety of sources bringing classroom topics to life
 -
Read modern, diverse business cases
-
Explore hundreds of books and reference titles

Read next

More like this
Sage Recommends
We found other relevant content for you on other Sage platforms.
Have you created a personal profile? Login or create a profile so that you can save clips, playlists and searches