

Five Guys: From Customer to Franchise Owner
Case
Teaching Notes
Supplementary Resources
Abstract
This case presents the challenges faced by a potential entrepreneur called Carolina in her plans to open a Five Guys franchise restaurant in a new country, Portugal. To implement her idea, Carolina started by reviewing the franchise disclosure document and carried out a survey to gather information about the burger restaurant industry. The case highlights the steps required to evaluate a new investment, namely forecasting cash flows, identifying the associated risks, analyzing the industry, and evaluating the financing options. The case also explores the option of delaying the project.
Carolina had to decide whether to open a new franchise restaurant or to accept a job offer. She is unsure of the investment viability as well as the risks associated with the project particularly with the COVID-19 pandemic. Weighing in her decision are also the financing options available to her.
This case was prepared for inclusion in Sage Business Cases primarily as a basis for classroom discussion or self-study, and is not meant to illustrate either effective or ineffective management styles. Nothing herein shall be deemed to be an endorsement of any kind. This case is for scholarly, educational, or personal use only within your university, and cannot be forwarded outside the university or used for other commercial purposes.
2026 Sage Publications, Inc. All Rights Reserved
Resources
Appendix A: Survey
This survey intends to analyze the Portuguese burger restaurant industry and to evaluate the possibility of opening an American burger chain franchise. This survey is anonymous and should be answered by individuals who reside in and around Lisbon and who regularly dine at burger restaurants.
Thank you for your collaboration.
Question 1: Gender
- Female
- Male
Question 2: Age
- Less than 24
- 24 to 34
- 35 to 44
- 45 to 54
- 55 to 65
- More than 65
Question 3: Nationality
- Portuguese
- Other
Question 4: Do you usually go to burger restaurants? If you answer “No,” you will be directed to Question 7.
- Yes
- No
Question 5: How many meals per week do you usually eat in burger restaurants?
- Less than 1 per week
- 1
- 2
- 3
- 4
- 5
- 6
- 7
- 8
- 9
- 10
- 11
- 12
- 13
- 14
Question 6: What is the main reason why you to go to burger restaurants? You will then be directed to Question 8.
- Price
- Quality of service
- Speed of service
- Quality of the product
- The restaurant’s ambiance
- Location
- Convenience/easy access
- Other
Question 7: What is the main reason why you do not go to burger restaurants?
- Price
- Quality of service
- Speed of service
- Quality of the product
- The restaurant’s ambiance
- Location
- Convenience/easy access
- Other
Question 8: Which of the following fast-food chains do you know?
- McDonald’s
- Burger King
- Wendy’s
- Denny’s
- Shake Shack
- Five Guys
- Hardee’s
- Carl’s Jr.
- Subway
- Steak ’n Shake
Question 9: Have you heard of the Five Guys brand?
- Yes
- No
Five Guys is an American burger chain, which is present in countries such as Spain, Britain, and Germany. The chain is known for its typical American design and high-quality fresh ingredients. Besides the free peanuts, Five Guys stands out for its fresh burgers and its French fries cooked in peanut oil. The freshness of the ingredients is guaranteed by the absence of freezers at the restaurants. Five Guys offers a variety of choices, such as sandwiches, hot dogs, milkshakes, different types of French fries, and vegetarian options.
Question 10: In the event of Five Guys opening a restaurant in Lisbon, would you be willing to try it? If you choose “No,” you will be directed to Question 12.
- Yes
- No
Question 11: How many meals per week would you be willing to eat at Five Guys?
- Less than 1 per week
- 1
- 2
- 3
- 4
- 5
- 6
- 7
- 8
- 9
- 10
- 11
- 12
- 13
- 14
Question 12: Why would you try Five Guys?
- Price
- Location
- Quality of service
- Quality of the product
- Reputation of the brand
- Other
Question 13: Bearing in mind the quality of the ingredients and of the service, what price would you be willing to pay for a menu? (Menu = burger/hot dog/sandwich + French fries + drink/milkshake)
- EUR 8.00–10.00
- EUR 10.00–12.00
- EUR 12.00–14.00
- EUR 14.00–16.00
- More than EUR 16.00
Question 14: Where would you preferably go to eat at a Five Guys restaurant?
- Centro Colombo
- Amoreiras
- Centro Vasco da Gama
- Lisbon airport
- Armazéns do Chiado
Appendix B: Summary of the Results of the Survey
Sample: 325
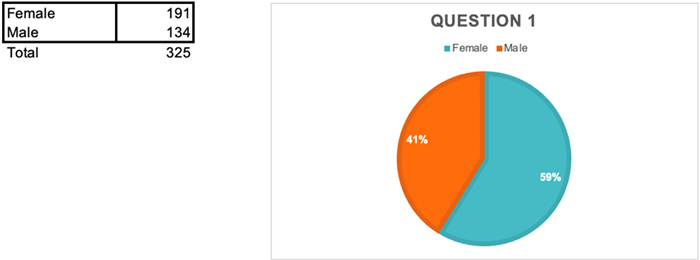
The table is replicated as follows:
| Female | 191 |
| Male | 134 |
| Total | 325 |
The pie chart is titled question 1. The data shown by the pie chart are listed as follows:
- Male (41%)
- Female (59%)
Question 1: Gender
The table is replicated as follows:
| Less than 24 | 111 |
| 24 to 34 | 157 |
| 35 to 44 | 25 |
| 45 to 54 | 25 |
| 55 to 65 | 7 |
| More than 65 | 0 |
| Total | 325 |
The pie chart is titled question 2. The data shown by the pie chart are listed as follows:
- Less than 24 (34%)
- 24 to 34 (48%)
- 35 to 44 (8%)
- 45 to 54 (8%)
- 55 to 65 (2%)
- More than 65 (0%)
Question 2: Age
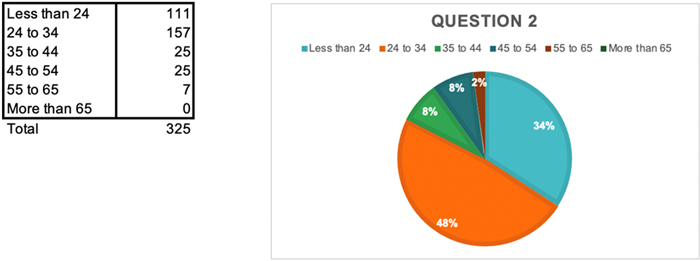
The table is replicated as follows:
| Portuguese | 319 |
| Other | 6 |
| Total | 325 |
The pie chart is titled question 3. The data shown by the pie chart are listed as follows:
- Portuguese (98%)
- Other (2%)
Question 3: Nationality
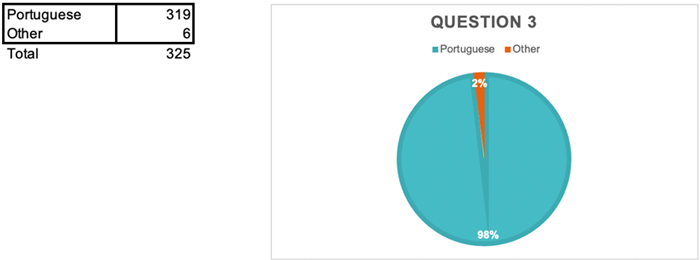
The table is replicated as follows:
| Yes | 267 |
| No | 58 |
| Total | 325 |
The pie chart is titled question 4. The data shown by the pie chart are listed as follows:
- Yes (82%)
- No (18%)
Question 4: Do you usually eat at burger restaurants? If you choose “No,” you will be directed to Question 7.
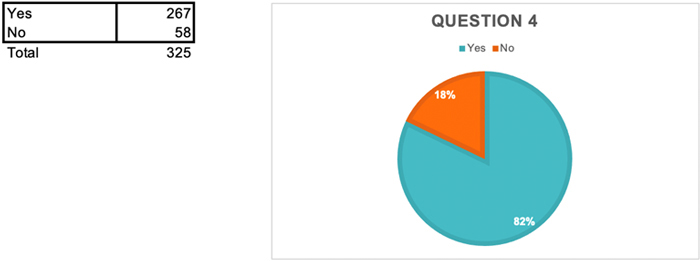
The table is replicated as follows:
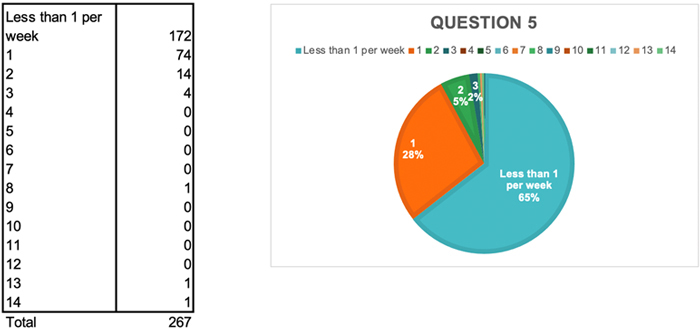
| Less than 1 per week | 172 |
| 1 | 74 |
| 2 | 14 |
| 3 | 4 |
| 4 | 0 |
| 5 | 0 |
| 6 | 0 |
| 7 | 0 |
| 8 | 1 |
| 9 | 0 |
| 10 | 0 |
| 11 | 0 |
| 12 | 0 |
| 13 | 1 |
| 14 | 1 |
| Total | 267 |
The pie chart is titled question 5. The data shown by the pie chart are listed as follows:
- Less than 1 per week (65%)
- 1 (28%)
- 2 (5%)
- 3 (2%)
- 4 (0%)
- 5 (0%)
- 6 (0%)
- 7 (0%)
- 8 (plotted but percentage not mentioned)
- 9 (0%)
- 10 (0%)
- 11 (0%)
- 12 (0%)
- 13 (plotted but percentage not mentioned)
- 14 (plotted but percentage not mentioned)
Question 5: How many meals per week do you usually eat at burger restaurants?
The table is replicated as follows:
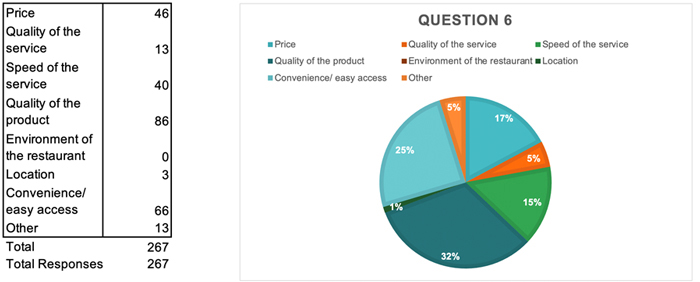
| Price | 46 |
| Quality of the service | 13 |
| Speed of the service | 40 |
| Quality of the product | 86 |
| Environment of the restaurant | 0 |
| Location | 3 |
| Convenience/easy access | 66 |
| Other | 13 |
| Total | 267 |
| Total responses | 267 |
The pie chart is titled question 6. The data shown by the pie chart are listed as follows:
- Price (17%)
- Quality of the service (5%)
- Speed of the service (15%)
- Quality of the product (32%)
- Environment of the restaurant (0%)
- Location (1%)
- Convenience/easy access (25%)
- Other (5%)
Question 6: What is the main reason why you to go to burger restaurants? You will then be directed to Question 8.
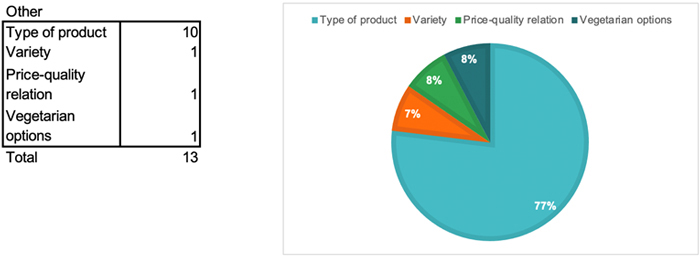
The table is titled Other and is replicated as follows:
| Type of product | 10 |
| Variety | 1 |
| Price-quality relation | 1 |
| Vegetarian options | 1 |
| Total | 13 |
The data shown by the pie chart are listed as follows:
- Type of product (77%)
- Variety (7%)
- Price-quality relation (8%)
- Vegetarian options (8%)
Question 7: What is the main reason why you do not eat at burger restaurants?
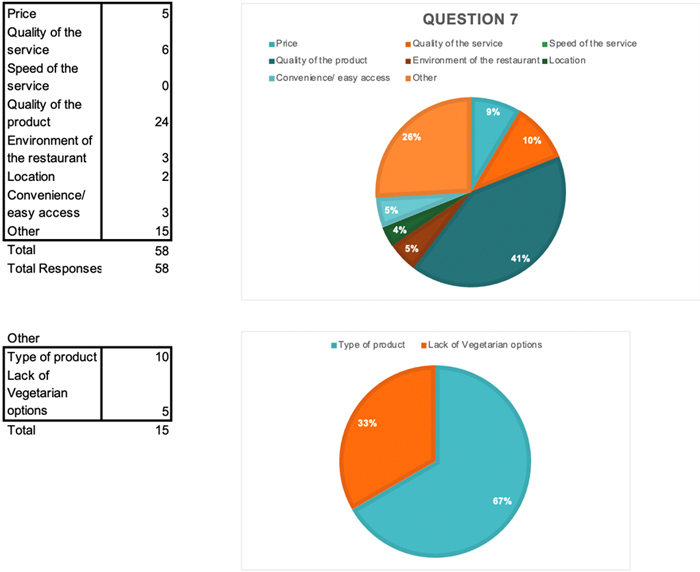
The table at the top is replicated as follows:
| Price | 5 |
| Quality of the service | 6 |
| Speed of the service | 0 |
| Quality of the product | 24 |
| Environment of the restaurant | 3 |
| Location | 2 |
| Convenience/easy access | 3 |
| Other | 15 |
| Total | 58 |
| Total responses | 58 |
The pie chart at the top is titled Question 7. The data shown by the pie chart are listed as follows:
- Price (9%)
- Quality of the service (10%)
- Speed of the service (0%)
- Quality of the product (41%)
- Environment of the restaurant (5%)
- Location (4%)
- Convenience/easy access (5%)
- Other (26%)
The table at the bottom is titled Other and is replicated as follows:
| Type of product | 10 |
| Lack of vegetarian options | 5 |
| Total | 15 |
The data shown by the pie chart are listed as follows:
Type of product (67%)
Lack of vegetarian options (33%)
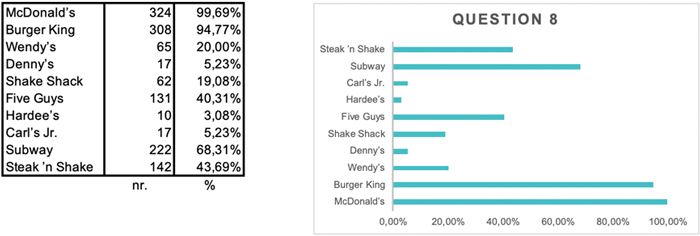
Question 8: Which of the following fast-food chains do you know?
The table is replicated as follows:
| McDonald’s | 324 | 99.69% |
| Burger King | 308 | 94.77% |
| Wendy’s | 65 | 20.00% |
| Denny’s | 17 | 5.23% |
| Shake Shack | 62 | 19.08% |
| Five Guys | 131 | 40.31% |
| Hardee’s | 10 | 3.08% |
| Carl’s Jr. | 17 | 5.23% |
| Subway | 222 | 68.31% |
| Steak ’n Shake | 142 | 43.69% |
| nr. | % | |
The bar chart is titled question 8. Its horizontal axis is scaled from 0.00% to 100.00% in increments of 20.00% and its vertical axis lists the restaurants. The bar chart plots the percentages mentioned in the above table.
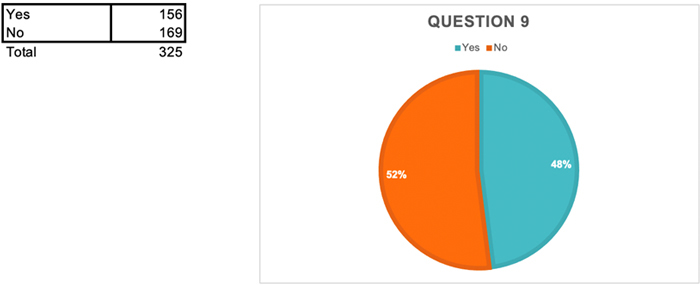
Question 9: Have you heard of the Five Guys brand?
The table is replicated as follows:
| Yes | 156 |
| No | 169 |
| Total | 325 |
The pie chart is titled question 9. The data shown by the pie chart are listed as follows:
- Yes (48%)
- No (52%)
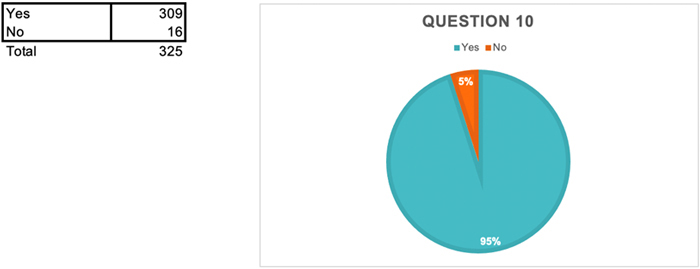
Question 10: If Five Guys opens a restaurant in Lisbon, would you be willing to try it? If you choose “No,” you will be directed to Question 12.
The table is replicated as follows:
| Yes | 309 |
| No | 16 |
| Total | 325 |
The pie chart is titled question 10. The data shown by the pie chart are listed as follows:
- Yes (95%)
- No (5%)
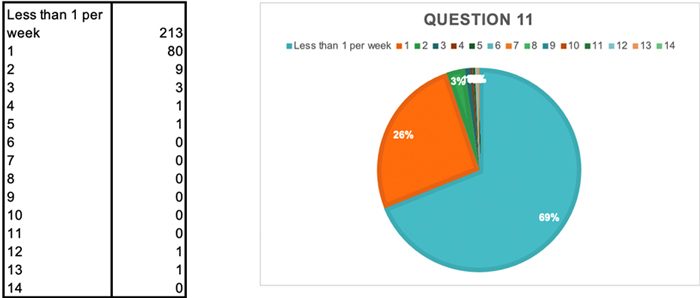
Question 11: How many meals per week would you be willing to eat at Five Guys?
The table is replicated as follows:
| Less than 1 per week | 213 |
| 1 | 80 |
| 2 | 9 |
| 3 | 3 |
| 4 | 1 |
| 5 | 1 |
| 6 | 0 |
| 7 | 0 |
| 8 | 0 |
| 9 | 0 |
| 10 | 0 |
| 11 | 0 |
| 12 | 1 |
| 13 | 1 |
| 14 | 0 |
The pie chart is titled question 11. The data shown by the pie chart are listed as follows:
- Less than 1 per week (68.93%)
- 1 (25.89%)
- 2 (2.91%)
- 3 (0.97%)
- 4 (0.32%)
- 5 (0.32%)
- 6 (0.00%)
- 7 (0.00%)
- 8 (0.00%)
- 9 (0.00%)
- 10 (0.00%)
- 11 (0.00%)
- 12 (0.32%)
- 13 (0.32%)
- 14 (0.00%)
The percentages plotted in the pie chart are rounded up.
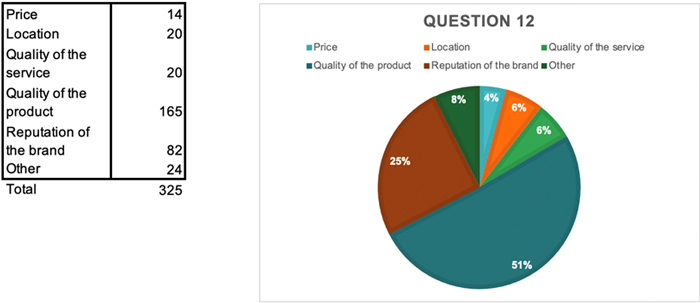
Question 12: Why would you try Five Guys?
The table is replicated as follows:
| Price | 14 |
| Location | 20 |
| Quality of the service | 20 |
| Quality of the product | 165 |
| Reputation of the brand | 82 |
| Other | 24 |
| Total | 325 |
The pie chart is titled question 12. The data shown by the pie chart are listed as follows:
- Price (4%)
- Location (6%)
- Quality of the service (6%)
- Quality of the product (51%)
- Reputation of the brand (25%)
- Other (8%)
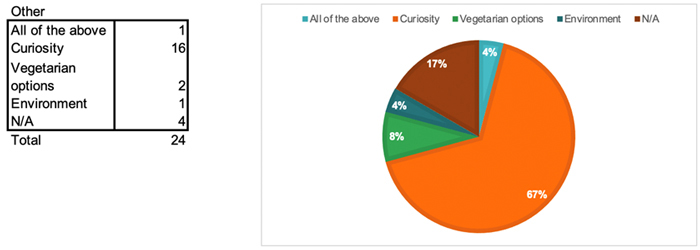
The table is titled Other and is replicated as follows:
| All of the above | 1 |
| Curiosity | 16 |
| Vegetarian options | 2 |
| Environment | 1 |
| N/A | 4 |
| Total | 24 |
The data shown by the pie chart are listed as follows:
- All of the above (4%)
- Curiosity (67%)
- Vegetarian options (8%)
- Environment (4%)
- N/A (17%)
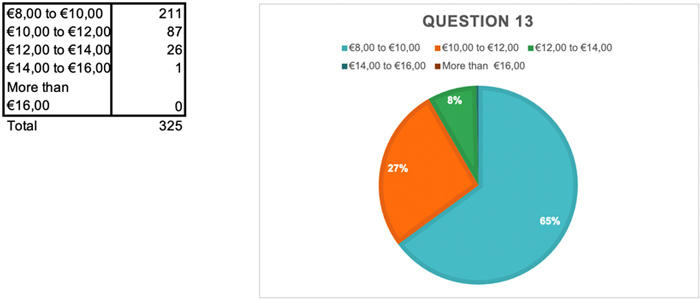
Question 13: Bearing in mind the quality of the ingredients and of the service, what price would you be willing to pay for a menu? (Menu = burger/hot dog/sandwich + French fries + drink/milkshake)
The table is replicated as follows:
| EUR 8.00–10.00 | 211 |
| EUR 10.00–12.00 | 87 |
| EUR 12.00–14.00 | 26 |
| EUR 14.00–16.00 | 1 |
| More than EUR 16.00 | 0 |
| Total | 325 |
The pie chart is titled question 13. The data shown by the pie chart are listed as follows:
- EUR 8.00–10.00 (64.92%)
- EUR 10.00–12,00 (26.77%)
- EUR 12.00–14.00 (8%)
- EUR 14.00–16.00 (0.31%)
- More than EUR 16.00 (0.00%)
The percentages plotted in the pie chart are rounded up.
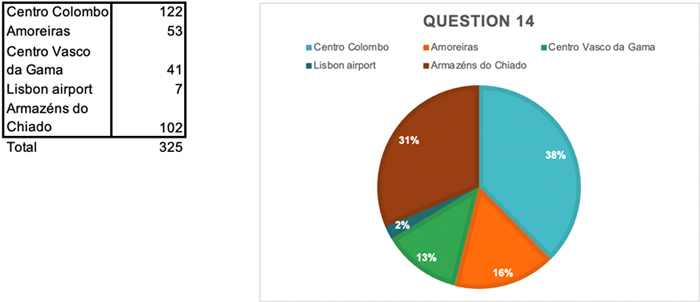
Question 14: Where would you preferably go to eat a Five Guys restaurant?
The table is replicated as follows:
| Centro Colombo | 122 |
| Amoreiras | 53 |
| Centro Vasco da Gama | 41 |
| Lisbon airport | 7 |
| Armazéns do Chiado | 102 |
| Total | 325 |
The pie chart is titled question 14. The data shown by the pie chart are listed as follows:
- Centro Colombo (38%)
- Amoreiras (16%)
- Centro Vasco da Gama (13%)
- Lisbon airport (2%)
- Armazéns do Chiado (31%)
This case was prepared for inclusion in Sage Business Cases primarily as a basis for classroom discussion or self-study, and is not meant to illustrate either effective or ineffective management styles. Nothing herein shall be deemed to be an endorsement of any kind. This case is for scholarly, educational, or personal use only within your university, and cannot be forwarded outside the university or used for other commercial purposes.
2026 Sage Publications, Inc. All Rights Reserved
Get a 30 day FREE TRIAL
-
 Watch videos from a variety of sources bringing classroom topics to life
 -
Read modern, diverse business cases
-
Explore hundreds of books and reference titles

Read next

More like this
Sage Recommends
We found other relevant content for you on other Sage platforms.
Have you created a personal profile? Login or create a profile so that you can save clips, playlists and searches