
Creating Competitive Advantage: Maruti Suzuki India Ltd.
Case
Teaching Notes
Supplementary Resources
Abstract
Maruti Suzuki India Ltd. (MSIL) is India’s largest car manufacturer and leading distributor of spare parts, dealing primarily in passenger vehicles, multi-utility, and multi-purpose vehicles. It has an extensive network of sales outlets across the country. MSIL went through three distinct phases: up to 1999 the market was a sellers market and there was very little competition; post 2000 (first recession) till 2007 when other multinationals entered the Indian market and customers began looking for design safety; and post the 2008–09 global financial crisis (second recession). In the second phase MSIL created value through cost leadership strategies, design and new product launches. MSIL managed to create value under growing competition from 2004 to 2008. At the beginning of FY 2007–2008 MSIL had attained a growth rate of 12%, slightly higher than the industry average, but during FY 2008–09, the sales volumes dropped resulting in a net profit slow down of 29.6%. S. Nakanishi (MSIL’s MD and CEO) faced a serious challenge: how to maintain competitiveness while dealing with growing domestic demand and changing customer preferences.
This case was prepared for inclusion in Sage Business Cases primarily as a basis for classroom discussion or self-study, and is not meant to illustrate either effective or ineffective management styles. Nothing herein shall be deemed to be an endorsement of any kind. This case is for scholarly, educational, or personal use only within your university, and cannot be forwarded outside the university or used for other commercial purposes.
2026 Sage Publications, Inc. All Rights Reserved
Resources
Exhibit 1: Industry Growth – The Flatness in Growth Was Actually an Aggregate of Huge Quarterly Swings
Percentage of YOY growth of FY09 passenger vehicles is plotted on the y axis with 5% intervals. Time of the year divided into quarters is plotted along the x axis. The values from the graph are given in the table below:
| Time (quarterly intervals) | YOY growth of FY09 passenger vehicles |
| Q1 FY09 | 15.10% |
| Q2 FY09 | 0.50% |
| Q3 FY09 | −15.50% |
| Q4 FY09 | 1.60% |
| Industry total | 0.10% |
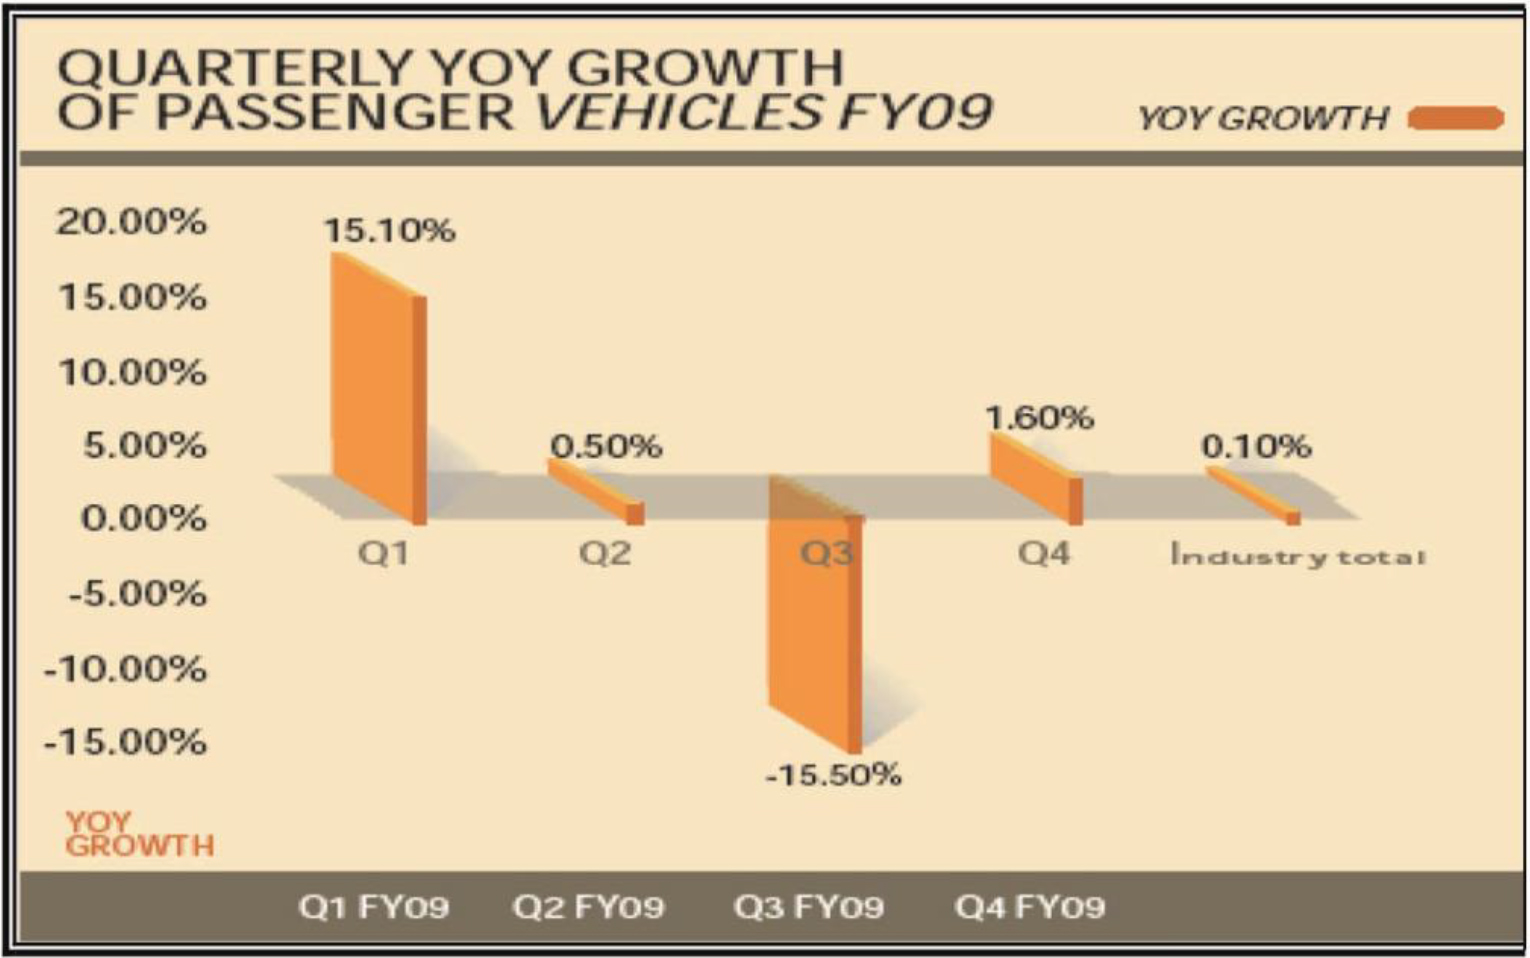
Exhibit 2: Auto Industry Growth – Indian Automobile Domestic Sales Growth Rate (%)
| Category | 2003–04 | 2004–05 | 2005–06 | 2006–07 | 2007–08 | 2008–09 |
| Total CVs | 36% | 22% | 10% | 33% | 5% | −21.7% |
| M&HCVs | 39% | 23% | 5% | 33% | 0% | −33% |
| LCVs | 32% | 21% | 19% | 34% | 12% | −7% |
| Total Passenger Vehicles | 28% | 18% | 8% | 21% | 12% | 0.1% |
| Passenger Cars | 29% | 18% | 8% | 22% | 12% | 1.3% |
| A1 | 17% | −31% | −23% | −11% | −12% | −29% |
| A2 | 23% | 34% | 15% | 31% | 14% | 3.1% |
| A3 | 51% | 26% | 7% | 6% | 15% | 7.1% |
| A4, A5 & A6 | 209% | 60% | 7% | 40% | 4% | −13.3% |
| Utility Vehiclees | 29% | 20% | 10% | 13% | 11% | −7.9% |
| MPVs | 14% | 9% | 2% | 25% | 21% | 5.7% |
| Total Two Wheelers | 11% | 16% | 14% | 11% | −8% | 2.6% |
| Scooters | 7% | 4% | −2% | 4% | 12% | 9.1% |
| Motorcycles | 14% | 19% | 17% | 13% | −12% | 1.2% |
| Mopeds | −9% | 5% | 3% | 7% | 16% | 4.2% |
| Three Wheelers | 23% | 8% | 17% | 12% | −10% | −4.1% |
| Grand Total | 15% | 16% | 13% | 13.7% | −4.6% | 0.7% |
Exhibit 3: History of Maruti Suzuki Product Launches
| YEAR | What Happened |
| 1982 | Signed License and JV agreement with SMC Japan. |
| 1983 | Launched Maruti 800. |
| 1984 | Launched Omni. |
| 1985 | Launched Gypsy. |
| 1986 | Produced 1, 00,000 Vehicles. |
| 1987 | Exported First Lot of 500 cars to hungry. |
| 1990 | Launched Indiaís First sedan Maruti 1000. |
| 1992 | SMC increased its stake in Maruti to 50%. |
| 1993 | Launched ZEN |
| 1994 | Produced 1 million cars and Launched Esteem |
| 1996 | Launched 24 hour Maruti on road service |
| 1997 | Produced 2 million cars and Launched Baleno and WagonR |
| 2000 | Launched IDTR jointly with the Delhi Govt.to promote safe driving. ( A CSR initiative) |
| 2001 | Launched Versa and Launched Maruti True Value(Pre Owned Business Car) |
| 2002 | SMC increased its stake in Maruti to 54.2% |
| 2003 | Launched Grand vitara Produced 4 million cars Listed on Bombay Stock Exchange and National Stock Exchange. |
| 2005 | Launched Swift |
| 2006 | Produced 6 million Cars Signed MOU with Haryana Govt. for adoption of ITI. Inaugurated second IDTR in Delhi |
| 2007 | Launched Swift Diesel Inaugurated fourth assembly line and diesel engine plant at Manesar Launched rural scheme Ghar Ghar mein Maruti; Mera sapna Meri Maruti. Launched SX4 Maruti Udyog Limited Renamed as Maruti Suzuki India Limited Signed MOU with Gujrat Govt. to set up driving and technical institute for tribal youth In Gujrat Adopted four villages in Manesar |
| 2008 | Launched Swift Dzire Inaugurated the K series diesel plant at Gurgaon Launched A star Completed 25 years of operations in India |
| 2009 | First shipment of A star for overseas market from Mundra Port Signed MOU with uttarakhand Govt. to set up IDTR at uttarakhand |
Source: Compiled from Maruti Suzuki Website.
Exhibit 4
Financial Highlights of Maruti Suzuki
| Year | Net Sales (Rs in Million) | PAT (Rs in Million) | EBIDTA (Rs in Million) |
| 2004–05 | 109,108 | 8536 | 18,140 |
| 2005–06 | 120,034 | 11,891 | 20,558 |
| 2006–07 | 145,922 | 15,620 | 25,888 |
| 2007–08 | 178,603 | 17,308 | 31,308 |
| 2008–09 | 203,583 | 12,187 | 24,334 |
Exports and Domestic Sales of Maruti Suzuki
| Year | Net Sales (Units) | Export Sales (Units) | Domestic Sales (Units) |
| 2004–05 | 536,301 | 48,899 | 487,402 |
| 2005–06 | 561,822 | 34,784 | 527,038 |
| 2006–07 | 674,924 | 39,295 | 635,629 |
| 2007–08 | 764,842 | 53,024 | 711,818 |
| 2008–09 | 792,167 | 70,023 | 722,144 |
Exhibit 5: Revenue Model
| Particulars | 2005–06 | 2006–07 | 2007–08 | 2008–09 | 2009–10 |
| Total sales | 138661 | 161367 | 197990 | 216590 | 298534 |
| Sale of spare parts | 8382 | 10075 | 11503 | 14262 | 19539 |
| Gross Sales | 147043 | 171442 | 209493 | 230852 | 318073 |
| Income from Service | 488 | 617 | 759 | 970 | 1404 |
| Other Income | 4292 | 5984 | 8876 | 9985 | 10209 |
| Total Income | 4780 | 6601 | 9635 | 10955 | 11613 |
| Total ( Total sales + Spare parts + Total Income) | 151823 | 178043 | 219128 | 241807 | 329686 |
**All figures are in million
Source: Compiled from the annual report of Maruti Suzuki for the year 2007–08, 08–09, 09–10
Exhibit 6: Classification of Car Segments and Types
| A1 Segment – Mini | Up to 3400mm (M800, Nano) |
| A2 Segment – Compact | 3401 to 4000mm (Alto, wagon r, Zen, i10, A-star, Swift, i20, palio, indica etc.) |
| A3 Segment – Midsize | 4001 to 4500mm (City, Sx4, DZire, Logan, Accent, Fiesta, Verna etc.) |
| A4 Segment – Executive | 4501 to 4700mm (Corolla, civic, C class, Optra, Octavia etc.) |
| A5 Segment – Premium | 4701 to 5000mm (Camry, E class, Accord, Sonata, Laura, Superb etc.) |
| A6 Segment – Luxury | Above 5000mm (Mercedes S class, 5 series etc.) |
Source: http://www.indiamarks.com/car-segmentation-society-indian-automobile-manufacturers/
Exhibit 7: Trends in Domestic Sales and Market Share in Passenger Vehicle From 2004 to 2009
|
| Sales (thousands) | Growth | Market Share (%) | ||||||||||||
| FY | 2004 | 2005 | 2006 | 2007 | 2008 | 2009 (6M) | 2008 | 3-year CAGR | 2009 (6M) | 2004 | 2005 | 2006 | 2007 | 2008 | 2009 (6M) |
| Total | 902.10 | 1,061.57 | 1,143.08 | 1,379.98 | 1,547.99 | 778.80 | 12.2 | 13.4 | 7.5 | 100 | 100 | 100 | 100 | 100 | 100 |
| BMW | 0.00 | 0.00 | 0.00 | 0.30 | 2.16 | 1.46 | 630.4 | 98.4 | 0.0 | 0.0 | 0.0 | 0.0 | 0.1 | 0.2 | |
| Fiat | 10.52 | 5.57 | 1.34 | 2.48 | 3.90 | 2.74 | 56.9 | −11.2 | 33.9 | 1.2 | 0.5 | 0.1 | 0.2 | 0.3 | 0.4 |
| FML | 6.92 | 6.80 | 7.22 | 8.50 | 8.11 | 3.19 | −4.5 | 6.1 | −4.1 | 0.8 | 0.6 | 0.6 | 0.6 | 0.5 | 0.4 |
| Ford | 21.71 | 27.26 | 28.87 | 41.80 | 33.88 | 14.06 | −18.9 | 7.5 | −22.5 | 2.4 | 2.6 | 2.5 | 3.0 | 2.2 | 1.8 |
| GM | 17.99 | 29.17 | 30.81 | 38.86 | 66.54 | 32.97 | 71.3 | 31.6 | 7.0 | 2.0 | 2.7 | 2.7 | 2.8 | 4.3 | 4.2 |
| HM | 15.79 | 14.91 | 15.11 | 13.53 | 12.68 | 5.51 | −6.3 | −5.3 | −16.1 | 1.7 | 1.4 | 1.3 | 1.0 | 0.8 | 0.7 |
| Honda | 21.66 | 37.33 | 42.73 | 61.33 | 62.80 | 23.46 | 2.4 | 18.9 | −19.9 | 2.4 | 3.5 | 3.7 | 4.4 | 4.1 | 3.0 |
| Hyundai | 129.79 | 142.20 | 158.98 | 195.26 | 216.50 | 126.88 | 10.9 | 15.0 | 29.7 | 14.4 | 13.4 | 13.9 | 14.1 | 14.0 | 16.3 |
| ICML | 0.00 | 0.00 | 0.00 | 0.00 | 0.00 | 1.88 | 393.7 | 0.0 | 0.0 | 0.0 | 0.0 | 0.0 | 0.2 | ||
| M&M | 68.97 | 79.59 | 84.03 | 89.78 | 129.91 | 61.34 | 44.7 | 17.7 | 3.1 | 7.6 | 7.5 | 7.4 | 6.5 | 8.4 | 7.9 |
| MSIL | 420.95 | 487.40 | 527.04 | 635.63 | 711.82 | 351.80 | 12.0 | 13.5 | 4.5 | 46.7 | 45.9 | 46.1 | 46.1 | 46.0 | 45.2 |
| MBIL | 1.54 | 1.86 | 1.67 | 1.81 | 2.18 | 1.49 | 20.5 | 5.3 | 62.7 | 0.2 | 0.2 | 0.1 | 0.1 | 0.1 | 0.2 |
| Skoda | 3.71 | 7.27 | 10.08 | 12.44 | 14.19 | 9.19 | 14.0 | 25.0 | 68.1 | 0.4 | 0.7 | 0.9 | 0.9 | 0.9 | 1.2 |
| TML | 139.99 | 179.08 | 188.86 | 226.92 | 227.92 | 113.18 | 0.4 | 8.4 | 7.2 | 15.5 | 16.9 | 16.5 | 16.4 | 14.7 | 14.5 |
| Toyota | 42.56 | 43.13 | 46.35 | 51.35 | 55.40 | 29.67 | 7.9 | 8.7 | 10.4 | 4.7 | 4.1 | 4.1 | 3.7 | 3.6 | 3.8 |
| PVs | 696.15 | 820.18 | 882.21 | 1,076.58 | 1,203.53 | 600.39 | 11.8 | 13.6 | 5.4 | 100 | 100 | 100 | 100 | 100 | 100 |
Exhibit 8: Players in the Passenger Car Segment
| Manufacturer | Mini | Compact | Mid-size | Executive | Premium | Luxury 1 |
| Maruti Suzuki India Ltd (MSIL) | 800 | Alto, Wagon Fi, Swift, Zen Estilo | Dzire, SX4 | |||
| Hyundai Motor India Ltd (HMIL) | Santro, Getz, i10 | Accent, Verna | Sonata | |||
| Tata Motors Ltd (TML) | Indica | Indigo | ||||
| Fiat India Pvt Ltd (FIPL) | Palio, 500 | |||||
| General Motors India Pvt Ltd (6M) | Spark, U-VA | Aveo | Optra | |||
| Ford India Pvt Ltd (Ford) | Fusion | Ikon, Fiesta | ||||
| Hindustan Motors Ltd. (HML) | Ambassador, Lancer, Cedi; | |||||
| Honda Siel Cars India Ltd (HSIL) | City | Civic | Accord | |||
| Mercedes Gen: India Pvt. Ltd (MB) | C-Class | E-Class | S-Class | |||
| Skoda Auto India Pvt Ltd (Skoda) | Fabia | Octavia, Laura | Superb | |||
| Toyota Kirloskar (Toyota) | Corolla Altis | Camry | ||||
| BMW | 3-Series | 5-Series | 7-Series | |||
| Mahindra & Mahindra(MSM) | Logan | |||||
| Volkswagen (VW) | Jetta | Passat | ||||
Source: ICRA management consultancy report oct 2008
Exhibit 9: Global Trend (Global Light Vehicle Sales Volume)
A label above the bar graph reads “The global auto market is expected to regain a positive growth in the coming years and Asia will become largest growth region,” and the heading of the graph reads Global Light Vehicle Sales Volume (1998–2015F, By Mil. Unit). Time in years is plotted along the x axis and percentage increase in sales is plotted along the y axis for North America, Europe, Asia and other countries. An overall trend of percentage increase is marked as a line graph above the bar graph showing a gradual +2% increase between years 1998 and 2008, −4% decrease between the years 2008 and 2009, and a steep +6% increase between the years 2009 and 2015. Percentage values of light vehicle sales in different countries shown in the graph are given in a tabular form below:
| Years | North America | Europe | Asia | Others | Overall sales across the globe |
| 1998 | 34% | 36% | 20% | 9% | 51.6% |
| 2000 | 35% | 35% | 22% | 8% | 56.2% |
| 2002 | 34% | 33% | 24% | 8% | 56.7% |
| 2004 | 32% | 33% | 26% | 9% | 61.4% |
| 2006 | 29% | 32% | 28% | 11% | 66.2% |
| 2008 | 24% | 32% | 30% | 14% | 66.0% |
| 2009 | 20% | 29% | 38% | 13% | 63.6% |
| 2015F | 22% | 24% | 40% | 13% | 90.1% |
The CAGR values for years 1998–2009 is −2.9%, −0.2% and 7.9%.
A note below the graph reads Vehicle weight less than 6 total.
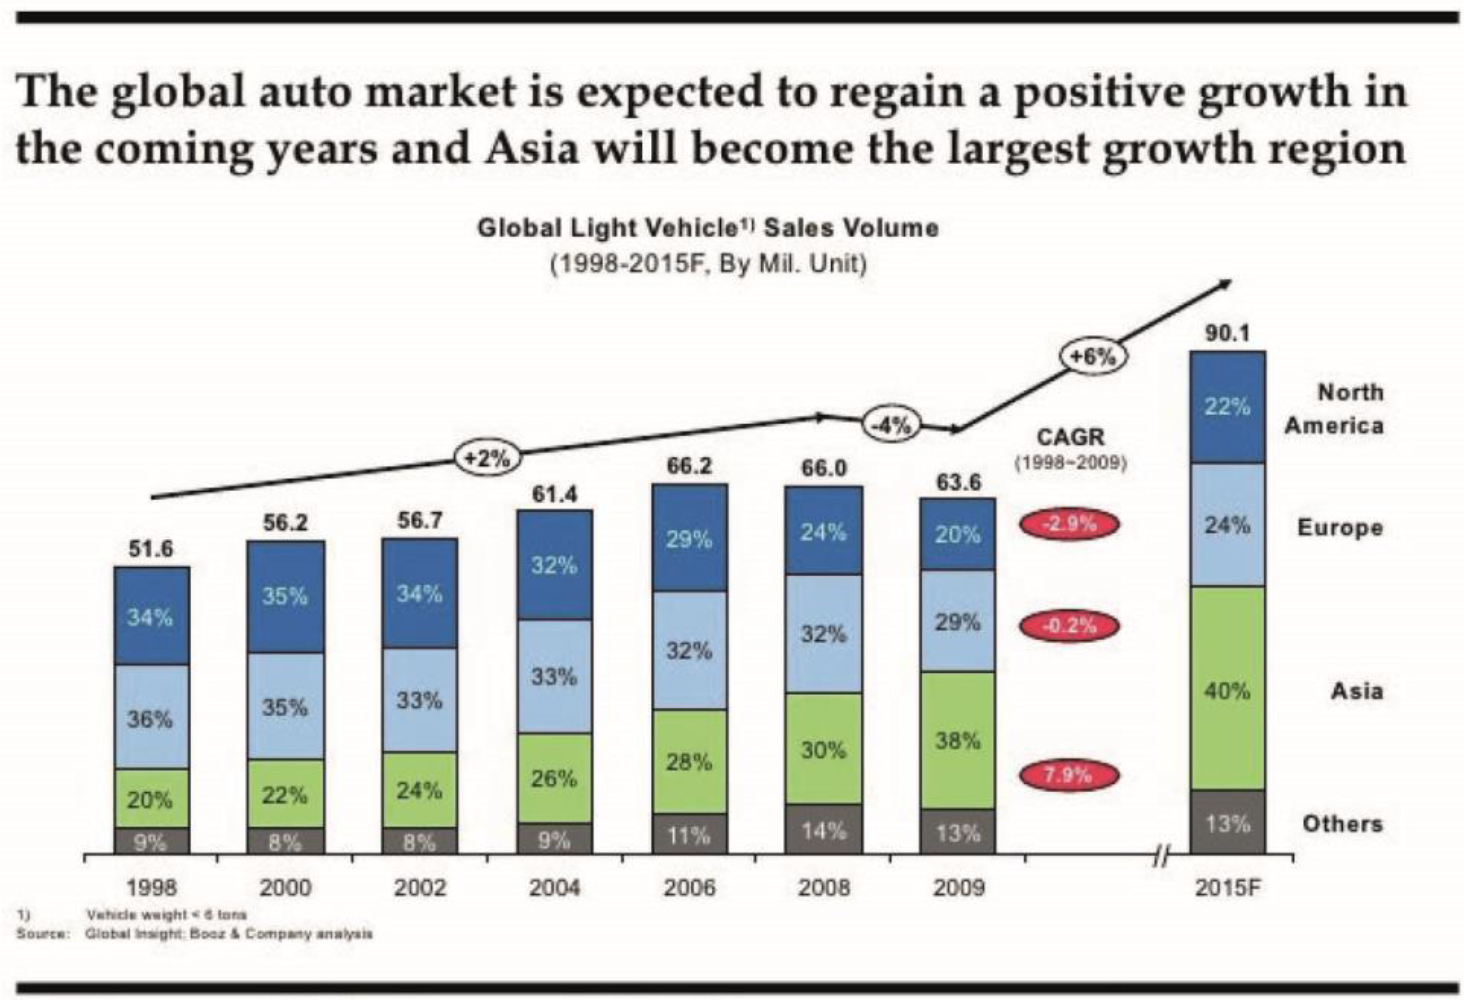
Exhibit 10: Financial Ratios
Annual Performance Ratios (As a Percentage of Net Sales)
| Parameters | FY ‘09 | FY ‘08 | Change |
| Material cost | 79.78% | 76.41% | 3.37% |
| Manufacturing & Admin | 7.70% | 6.0% | 1.37% |
| Expense | 0.95% | 0.82% | 0.13% |
| Power & Fuel | 3.3% | 2.8% | 0.50% |
| Royalty | |||
| Selling and Distribution | 3.63% | 3.14% | 0.49% |
| Expenses | 1.44% | 0.91% | 0.53% |
| Transportation costs | |||
| Employee cost | 2.31% | 1.99% | 0.32% |
| EBIDTA | 11.95% | 17.53% | (5.58)% |
| Depreciation | 3.47% | 3.18% | 0.29% |
| PBT | 8.23% | 14% | (5.77)% |
| PAT | 5.99% | 9.69% | (3.70)% |
| Other Income | 4.90% | 4.69% | 0.21% |
Exhibit 11: Liquidity and Solvency Ratios
| Ratio | 31.03.09 | 31.03.08 | 31.03.07 | |
| Current Ratio | Current Assets/Current Liabilities | 54911/33976 1.61 | 30979/28257 1.09 | 38341/25015 1.53 |
| Quick Ratio | Current Assets – inventory/Current Liabilities | 45888/33976 1.35 | 20599/28257 0.72 | 31327/25015 1.25 |
| Debt Equity Ratio | Debt/Equity | 6989/93449 0.07 | 9002/84154 0.11 | 6308/68539 0.092 |
| Fixed Asset Ratio | Fixed Asset/Long term funds | 40708/100438 0.40 | 32965/93156 0.35 | 26597/74847 0.355 |
| Shareholders Equity Ratio | Shareholders equity/Total Assets | 93449/101989 0.91 | 84154/94857 0.88 | 68539/76522 0.89 |
| Interest Coverage Ratio | EBIT/Interest | 17268/510 34 | 25626/596 42.9 | 23174/376 61.6 |
Exhibit 12: Profitability Ratios
| Ratio | 31.03.09 | 31.03.08 | 31.03.07 | |
| Gross Margin(%) | Sales-COGS/Sales | 203583-161768/203583 20.53 | 178603-141056/178603 21.02 | 16.66 |
| Net Profit Margin(%) | PAT/Sales | 12187/203583 5.98 | 17308/178603 9.6 | 15620/145922 10.7 |
| Operating Profit Margin(%) | Operating Profit(PBT + DEP + INT)/Sales | 24333/203583 11.9 | 31308/178603 17.5 | 25888/145922 17.7 |
| Return On capital employed | Profit after tax/Net worth | 12187/103241 11.8 | 17308/95666 18.09 | 15620/74847 20.86 |
Exhibit 13: Indian Middle Class
The households are classified into five main groups: Globals, Strivers, Seekers, Aspirers and Deprived based on their annual income. Time in years is plotted along the x axis and the annual income along with the number of households is plotted along the y axis. Data given in the graph are shown in the table below.
| Years/Types of households | 2005 | 2015 | 2025 | |
| Globals | Annual income (in trillion Indian rupees) | 2.0 | 6.3 | 21.7 |
| Number of households (in millions) | 1.2 | 3.3 | 9.5 | |
| Strivers (Middle class) | Annual income (in trillion Indian rupees) | 1.6 | 3.8 | 20.9 |
| Number of households (in millions) | 2.4 | 5.5 | 33.1 | |
| Seekers (Middle class) | Annual income (in trillion Indian rupees) | 3.1 | 15.2 | 30.6 |
| Number of households (in millions) | 10.9 | 55.1 | 94.9 | |
| Aspirers | Annual income (in trillion Indian rupees) | 11.4 | 14.6 | 13.7 |
| Number of households (in millions) | 91.3 | 106.0 | 93.1 | |
| Deprived | Annual income (in trillion Indian rupees) | 5.4 | 3.8 | 2.6 |
| Number of households (in millions) | 101.1 | 74.1 | 49.9 | |
Note beneath the graph reads as Annual income: globals => 1,000,000 rupees; strivers = 500,000 – 1,000,000; seekers = 200,000 – 499,999; aspirers = 90,000 – 199,999; deprived = <90,000; 45.7 rupees = $1 in real 2000 dollars or 8.5 rupees = $1 adjusted for purchasing power parity; 45.7 rupees = $1 in real 2000 dollars or 8.5 rupees = $1 adjusted for purchasing power parity. Source: McKinsey Global Institute Analysis.
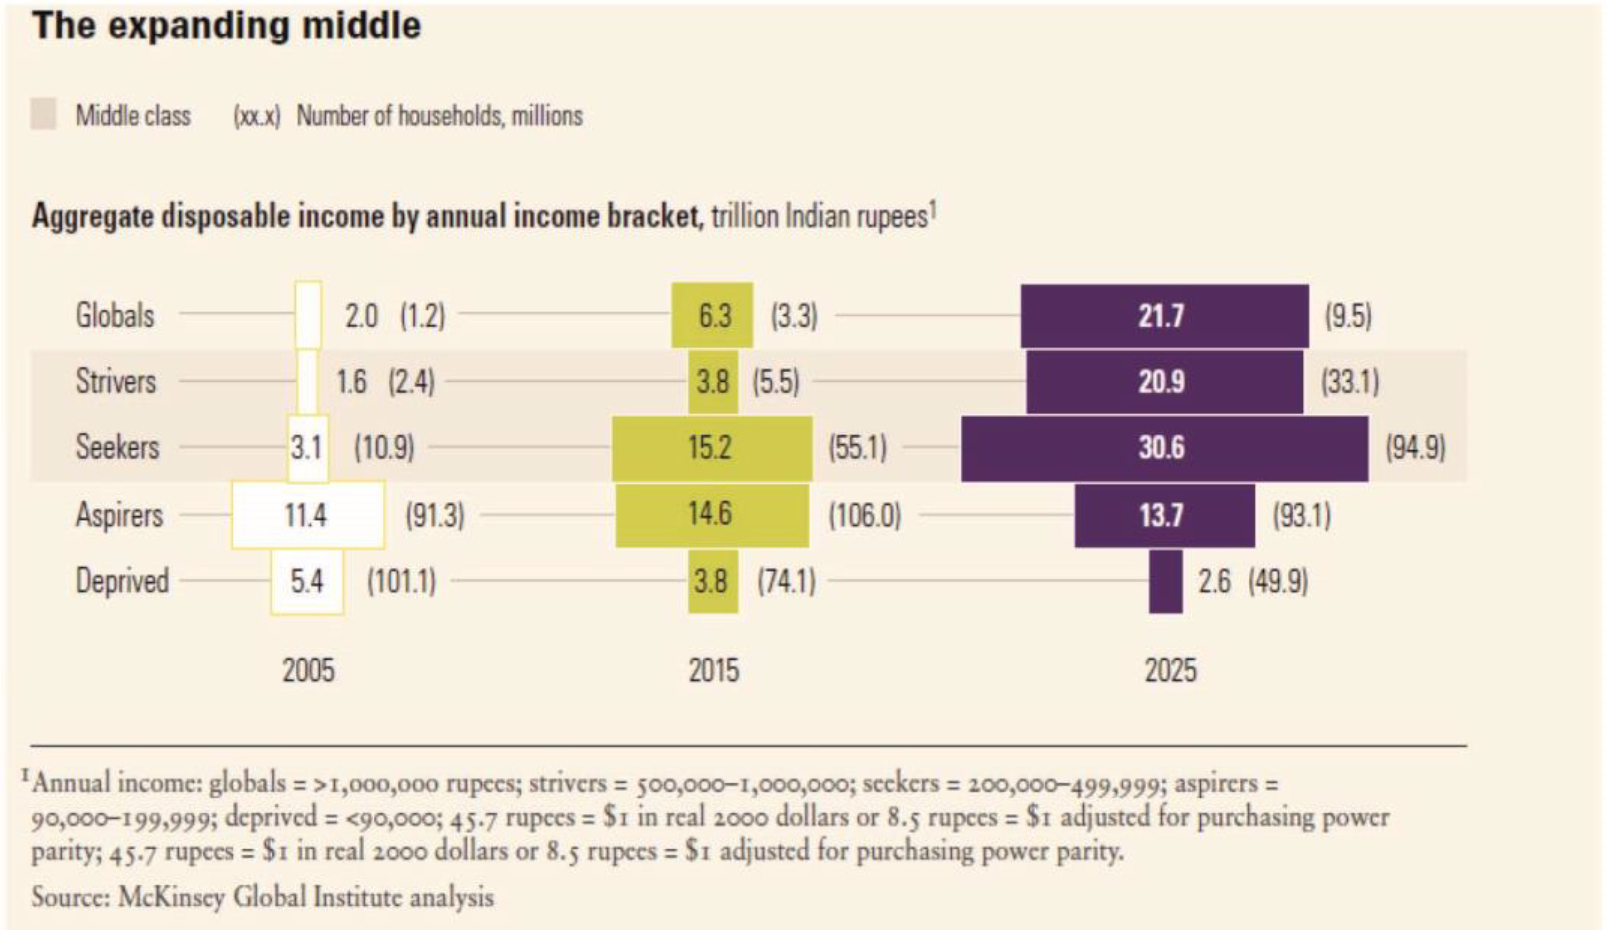
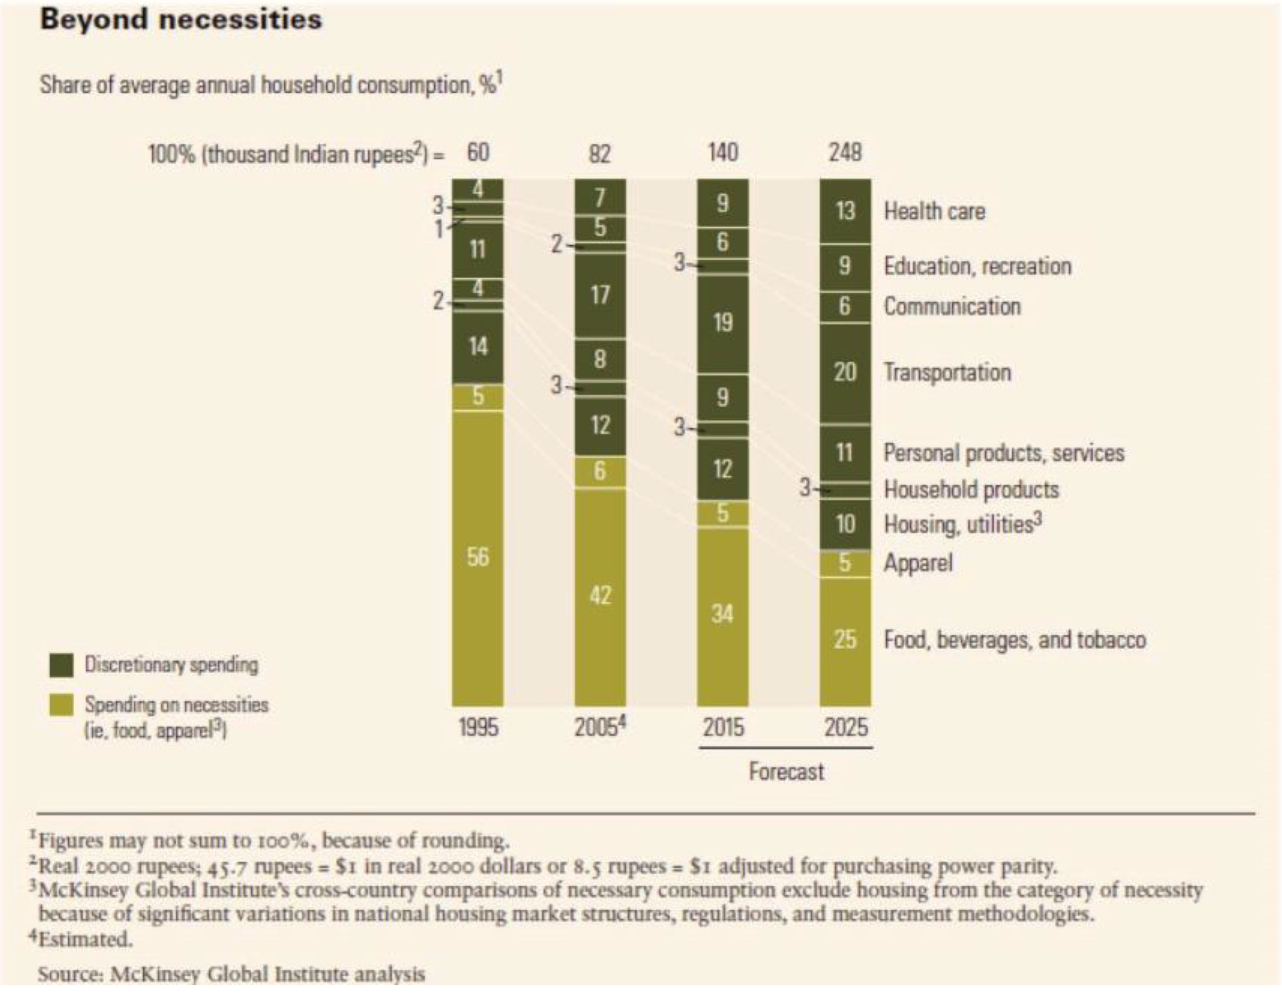
Exhibit 14: Indian Middle Class Consumption Pattern
Heading of the graph reads “Beyond necessities.” Time in years is plotted along the x axis in 10 year intervals and the percentage of household expenses for various needs is plotted along the y axis. The values from the graph are given as a table below:
| Years/Percentage of expenses spent on various household necessities | 1995 | 2005 | 2015 (forecast) | 2025 (forecast) | |
| Discretionary spending | Health care | 4% | 7% | 9% | 13% |
| Education, recreation | 3% | 5% | 6% | 9% | |
| Communication | 1% | 2% | 3% | 6% | |
| Transportation | 11% | 17% | 19% | 20% | |
| Personal products, services | 4% | 8% | 9% | 11% | |
| Household products | 2% | 3% | 3% | 3% | |
| Housing utilities | 14% | 12% | 12% | 10% | |
| Spending on necessities (ie. food, apparel) | Apparel | 5% | 6% | 5% | 5% |
| Food, beverages and tobacco | 56% | 42% | 34% | 25% | |
| Share of average annual household consumption 100% (thousand Indian rupees) | 60 | 82 | 140 | 248 | |
Note beneath the graph reads as 1. Figures may not sum to 100%, because of rounding. 2. Real 2000 rupees; 45.7 rupees = $1 in real 2000 dollars or 8.5 rupees = $1 adjusted for purchasing power parity. 3. McKinsey Global Institutes cross-country comparisons of necessary consumption exclude housing from the category of necessity because of significant variations in national housing market structures, regulations, and measurements methodologies. 4. Estimated. Source: McKinsey Global Institute Analysis.
This case was prepared for inclusion in Sage Business Cases primarily as a basis for classroom discussion or self-study, and is not meant to illustrate either effective or ineffective management styles. Nothing herein shall be deemed to be an endorsement of any kind. This case is for scholarly, educational, or personal use only within your university, and cannot be forwarded outside the university or used for other commercial purposes.
2026 Sage Publications, Inc. All Rights Reserved
Get a 30 day FREE TRIAL
-
 Watch videos from a variety of sources bringing classroom topics to life
 -
Read modern, diverse business cases
-
Explore hundreds of books and reference titles

Read next

More like this
Sage Recommends
We found other relevant content for you on other Sage platforms.
Have you created a personal profile? Login or create a profile so that you can save clips, playlists and searches